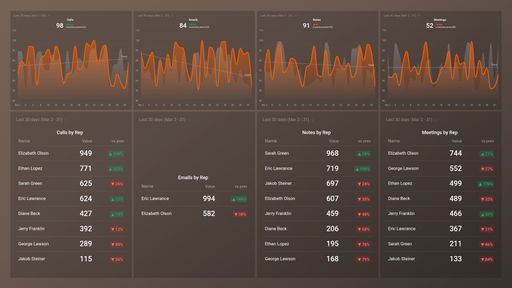
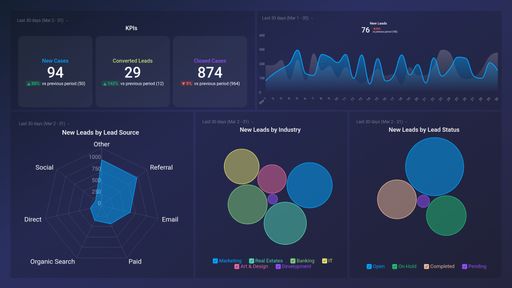
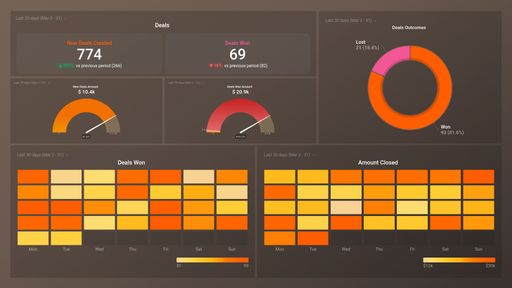
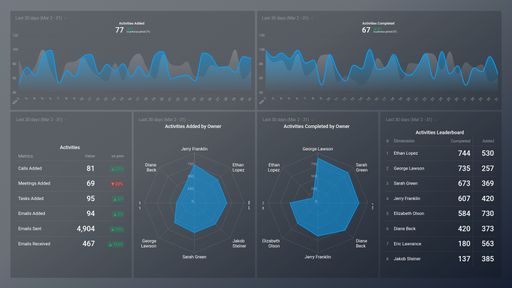
Track some of the most common Sales Team Activity metrics and KPIs and analyze your Sales Team Activity performance with just a few clicks.
TOP Sales Team Activity INTEGRATIONS
Use this free Semrush Domain Overview Dashboard Template to get a full overview of your domain KPIs. From your current domain rank and organic traffic to the referring domains and AdWords traffic, you can drill deep into your domain data.
What you’ll learn from this Semrush Domain Overview Dashboard Template:
As you know domain rank in Semrush tells you the highest organic visibility based on how much estimated monthly traffic your domain is getting from organic search and by checking it you can determine if there is a need to change your approach or if it is trending up just continue on the path towards your goal.
- How is my domain performing when it comes to attracting organic traffic?
See how much organic traffic your domain is pulling within a set time period, you can compare it to a previous one to pinpoint any major rise or drop. This can help you measure the effectiveness of your SEO efforts in increasing your website’s rankings.
- Are my AdWords campaigns successful?
Get insights into your domain AdWords traffics to determine how many visitors they are generating. You can compare different time periods for this and see if there are major fluctuations that require your attention.
- Drill deep into your backlink profile and both your referring domains and IPs
By tracking these metrics you can have a clear cross-section of how many backlinks total you have, are they all from different IPs and different domains. That can provide you with the data to clean up and boost your backlink profile.
What other campaign metrics can you track and visualize with SEMrush
What other campaign metrics can you track and visualize with SEMrush?
- Visibility trend
- Keyword ranking
- Estimated traffic
- Rankings distribution
- Organic traffic
- Reffering IPs
- Backlinks and more
There are many different metrics and metric combinations you can track using these integrations. And in Databox, you can quickly visualize dozens of SEMrush metrics in a variety of different ways.
Read more about SEMrush integration
Don’t just track your KPIs. Here are hundreds of tips for improving your website’s search engine optimization efforts.
Visualizing your performance data in a way that’s easy for everyone to interpret is the first step toward improved performance. So, what can you do when some of these metrics are trending down?
We’ve collected a few resources that contain tips from hundreds of other SEO professionals on improving website conversion, page views, average time on page, and more.
 HubSpot CRM (3)
 Intrix CRM (1)
 Pipedrive CRM (1)
 HubSpot Marketing (1)
 Salesforce CRM (1)