

A manual walkthrough, and the Claude skill that does it for you.
TL;DR
- You don’t need an attribution platform. Your ad platform exports and a spreadsheet already have most of the signal a paid media manager needs to run a defensible cross-channel report. The work is in joining them.
- Three steps build the manual baseline. Export campaign performance from each ad platform you run for the same date range. Harmonize the exports into a single spreadsheet so the metric definitions match. Judge each channel against its funnel role, not a single universal metric.
- The judgment step is where cross-channel reports usually fail. Awareness campaigns scored on CPA look broken. Retargeting scored on impression share looks fine. Funnel role has to be part of the report, not an afterthought in the summary email.
- Cadence matters more than precision. Weekly volume checks, monthly full reconciliations, quarterly channel-mix decisions.
- The Paid Ads Cross-Channel Performance Report Claude skill automates the join. The same platforms, the same data, a nine-section interactive HTML report in under 90 seconds, with the funnel-role judgment baked in.
Every cross-channel measurement guide tells you that you need an attribution platform. You don’t. Your ad platform exports and a spreadsheet already have most of the signal. Here’s how to build the report manually, and here’s the skill that does it for you when manual stops being worth the time.
The procedure is three steps in tools you’re already using. Export campaign performance from every ad platform you run for the same date range. Harmonize the exports into a single working spreadsheet where every row uses the same metric definitions. Then judge each channel against the funnel role it was actually built for. Awareness on TikTok is not scored the same way as branded search on Google.
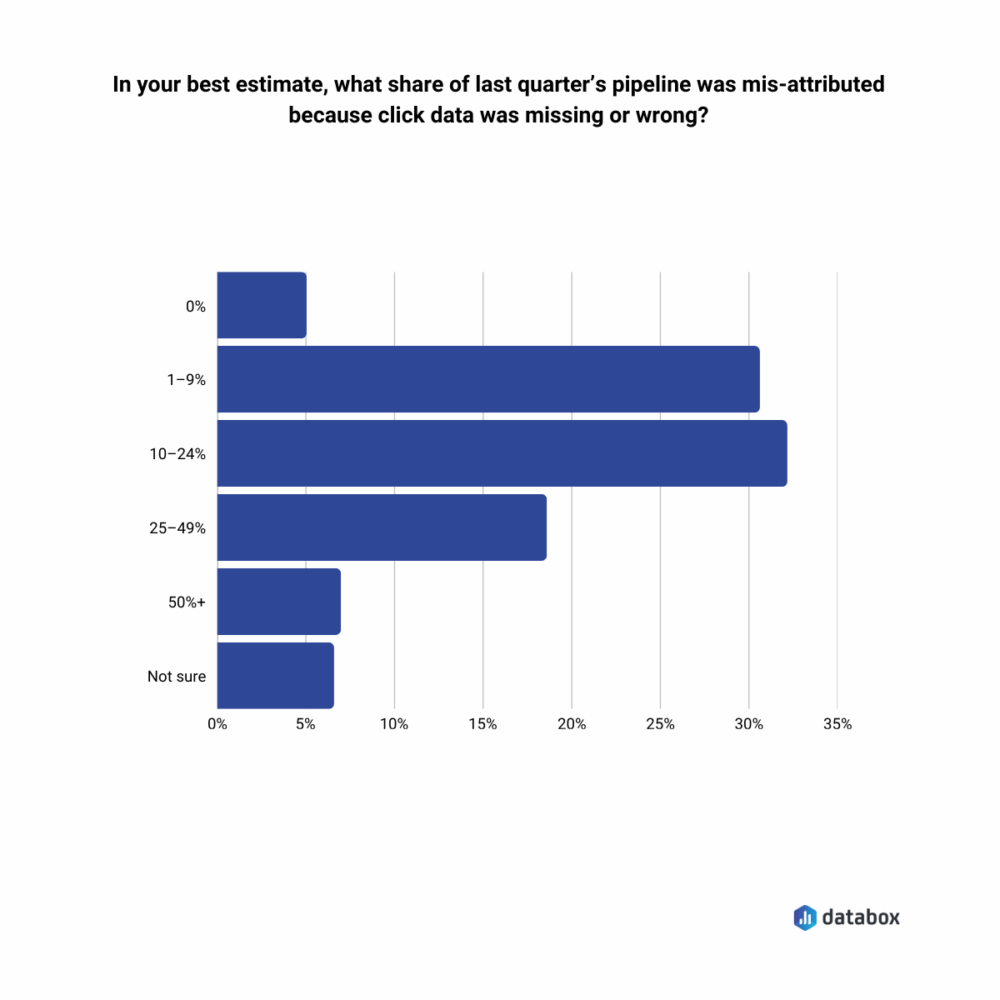
The gap between running paid ads and measuring them well is wider than most teams admit. In the Databox Beyond Attribution research, 51.11% of go-to-market teams estimated that 10-24% of last quarter’s pipeline was mis-attributed due to missing or wrong click data. The channels have never been more sophisticated. The reports have never been less trusted.
What cross-channel paid ads measurement actually requires
Cross-channel measurement is not a mystery. It requires three things: normalized date ranges across platforms so the numbers describe the same window, harmonized metric definitions so a “conversion” means the same thing on every row, and funnel-role context so the efficiency judgment matches what the campaign was set up to do.
The third one is where most manual reports quietly fail. A blended CPA that averages a top-of-funnel awareness campaign against a bottom-of-funnel branded search campaign is not a measurement. It is a shape. The number looks like it means something, and then someone makes a budget call on it. The manual method that pays off is the one that keeps the funnel role attached to the campaign, all the way through the report.
Step 1: Export campaign performance from each ad platform
Every ad platform gives you a campaign-level export in a similar shape. The columns are named differently, but the fields you need are the same: campaign name, spend, impressions, clicks, conversions, and conversion value.
The ad platforms worth tracking, as of mid-2026:
- Google Ads
- Meta Ads (Facebook and Instagram)
- LinkedIn Ads
- TikTok Ads
- Microsoft Advertising (Bing)
Set every export to the last 90 days. Anything shorter and you don’t have enough volume on the smaller channels to read trends. Six months is cleaner if your campaigns have seasonality worth accounting for.
In Google Ads, open Campaigns → Reports → Predefined reports → Basic → Campaign. Add columns for impression share and search impression share lost (budget) if you run search campaigns. Export as CSV.
In Meta Ads Manager, open Ads Reporting → Create Report → Campaign level. Add spend, impressions, clicks, results, cost per result, and frequency. Export as CSV.
In LinkedIn Campaign Manager, open Analyze → Performance Chart → Export. Choose campaign performance, spend, impressions, clicks, and conversions. Export as CSV.
In TikTok Ads Manager, open Reporting → Create Report → Campaign level. Add spend, impressions, clicks, conversions, and CTR. Export as CSV.
In Microsoft Advertising, open Reports → Performance → Campaign. Add spend, impressions, clicks, conversions, and impression share. Export as CSV.
Whichever mix of these you run is the mix you build the report against. A one-platform account gets a one-platform report. A five-platform account gets a five-platform report. The shape is the same either way.
Step 2: Harmonize the exports into a single working spreadsheet
Open a new spreadsheet. Create one tab per platform for the raw exports, and one master tab for the harmonized dataset. In the master tab, five columns do the work: Platform, Campaign Name, Funnel Role, Spend, and Conversions. Add Conversion Value where the campaign is set up to report it.
Copy each platform’s CSV into its per-platform tab. Then, in the master tab, pull the fields you need from each. Give every campaign a funnel role: awareness, consideration, conversion, or retargeting. The role does not come from the platform. It comes from what you set the campaign up to do. Assign it once when you first build the report. From then on, it lives in the row.
One thing worth being careful about: the platform-reported ROAS and CPA figures are not directly comparable across channels. Every platform counts conversions using its own attribution window and its own defaults. Google Ads and Microsoft Advertising use longer click windows. Meta uses a shorter one and defaults to counting view-through in some campaign types. LinkedIn’s default is different again. TikTok’s is different again. If you copy the platform-reported ROAS from every export and average them, you get a number that means nothing. Recompute ROAS and CPA in your master tab from harmonized spend and conversion columns. Trust your math, not the platform’s ratio.
That leaves you with one working dataset: every campaign on every platform, in one place, with the same metric definitions and the funnel role attached. That is what the report is built from.
Step 3: Judge each channel against its funnel role
The reason cross-channel reports fail more often than they succeed is that they get read as if every metric applies to every campaign. It doesn’t.
Awareness campaigns are scored on reach and impression frequency. If a Meta or TikTok awareness campaign is running at a frequency of 1.2 across a broad audience over 90 days, it is not reaching enough people. If it is running at a frequency of 6.8, it is burning the same eyeballs. Neither of those judgments involves CPA.
Consideration campaigns are scored on CTR, engagement, and cost per landing page view. The efficiency signal is whether people who see the ad show up to read. A 0.4% CTR on cold prospecting on LinkedIn is fine. The same CTR on branded search on Google is broken.
Conversion campaigns are scored on CPA against the target you set when you built them. If you have a $60 CPA target and the campaign is running at $75, that’s a signal. If it is running at $42, the signal is different: increase the budget, or check the conversion definition. The number by itself does not tell you which.
Retargeting is scored differently again. Frequency, CPA, and return visits. The audience is small by design. Judged on cold-audience metrics, retargeting looks broken. Judged on retargeting metrics, it is often the highest-ROI thing in the account.
In the master tab, add three columns after Funnel Role: Primary Metric, Target, and Actual. The Primary Metric is the one appropriate to the funnel role. The Target is what you set when you launched the campaign. The Actual is what the harmonized data says. The delta between Target and Actual is the report.
That is the manual method. Three steps. About one to two hours the first time. Under an hour once your spreadsheet template exists.
Two things the manual method does poorly
Worth being honest about these, because they are where the workflow starts costing more time than the report is worth.
Doing this weekly. The first pass takes an hour or two. Monthly refreshes drop to about 45 minutes once the template is stable. Weekly is where the math stops working. The point of measurement is recurrence, and a workflow you only run monthly cannot answer the “what changed last week” question your VP asks on Tuesday.
Funnel-role judgment at scale. With five campaigns each on three platforms, the judgment work is manageable. With twenty campaigns across five platforms and three funnel roles, the judgment work quietly collapses. Every cross-channel report at scale reverts to scoring everything on CPA, because CPA is the one metric that appears in every row. Awareness stops being evaluated on frequency. Retargeting stops being evaluated on return visits. The report gets uniform, and the wrong campaigns get killed.
The labor cost of doing this well is not a rounding error. In the same Databox research, 46.67% of go-to-market teams reported spending 6-15 hours per month cleaning or reconciling attribution data. For a paid media manager running weekly cadence across four or five platforms, that number is a floor, not a ceiling.
How often to run the manual report
A reasonable rhythm for the manual workflow:
- Weekly: Check spend and conversions against the prior week for every channel. Look for shifts greater than 20% on any one channel. Most weeks, nothing moves enough to warrant action.
- Monthly: Re-run the exports, refresh the harmonized master tab, re-score every campaign against its funnel-role target. Share the top three findings with leadership in a Notion doc or a Slack message. About 45 minutes once the template is built.
- Quarterly: Look at channel mix. Is the awareness spend on Meta paying off in branded search volume on Google three months later? Is the LinkedIn retargeting cohort actually converting downstream? Quarterly is where budget reallocation lives.
This is enough to stay current. It is not enough to answer an ad-hoc question from your CMO on demand.
When the manual method stops being worth the time
If you are running this weekly across four or five ad platforms, you are spending three to five hours a week on spreadsheet work that produces one report. That number grows with every campaign you launch and every platform you add. At some point, the math stops favoring manual.
That is the point of the Paid Ads Cross-Channel Performance Report Claude skill Databox shipped to the Skills Marketplace. It runs against the same platforms you have been exporting from: Google Ads, Meta, LinkedIn, TikTok Ads, and Microsoft Advertising. The difference is that it pulls the data through your Databox workspace via MCP, harmonizes it, and writes a nine-section interactive HTML report in under 90 seconds. A blended snapshot with total spend, impressions, clicks, and conversion trends. A budget spend section with a 6-month stacked chart and per-platform pacing gauges. A cross-platform efficiency table comparing every channel side by side. Per-platform breakdowns with eight standardized metric cards each. Campaign rankings with consistent columns. Audience and reach signals, including Meta frequency, Google impression share, and IS loss type. Cost vs target caps as gauge charts. One priority recommendation and a watch list.
The funnel-role judgment is not something the skill infers on the fly. On the first run, it asks for your conversion goals, CPA targets, CAC threshold, funnel role per platform, and budget. From then on, every run reads campaigns against the context you gave it. Awareness stops getting scored on CPA. Search stops getting scored on frequency. The report matches what the campaigns were built to do.
To install: download the skill from the Skills Marketplace, open Claude Desktop, and import the file from Settings → Skills, then connect Databox via the MCP connector. The setup guide ships with the download. Total setup is about five minutes.
One piece of editorial advice: if you have never built the manual version, do it once before installing the skill. The first manual pass is what teaches you which campaigns actually matter for your business, which funnel-role assignments are right, and which platforms in your mix carry which stage of the funnel. Then automate everything you would otherwise do by hand.
Frequently Asked Questions
Do I need an attribution platform to build a cross-channel paid ads report?
No. A cross-channel paid ads report is a spreadsheet exercise, not an attribution platform. Every ad platform (Google Ads, Meta, LinkedIn, TikTok, Microsoft Advertising) exports campaign performance in the same shape: campaign name, spend, impressions, clicks, conversions, and conversion value. Pull those exports, harmonize the columns in a spreadsheet, and judge each channel against its funnel role. Attribution platforms are useful when you need cross-platform deduplication or multi-touch modeling. For the blended and per-channel view your budget reviews rely on, they are not the entry point.
Why do platform-reported ROAS numbers disagree across Google, Meta, LinkedIn, TikTok, and Microsoft Advertising?
Every ad platform counts conversions using its own attribution window and its own defaults. Google Ads and Microsoft Advertising use longer click windows. Meta uses a shorter one and defaults to counting view-through in some campaign types. LinkedIn’s default is different again. TikTok’s is different again. The same conversion often gets claimed by multiple platforms inside their overlapping windows, so the platform-reported ROAS is inflated on every channel and the platform-reported CPA is deflated. Do not compare the platform-reported ratios directly, and do not average them. Recompute ROAS and CPA yourself from harmonized spend and conversion columns in your master tab.
Which ad platforms is the skill built for?
Google Ads, Meta Ads (Facebook and Instagram), LinkedIn Ads, TikTok Ads, and Microsoft Advertising (Bing). The skill reads whichever platforms you have connected in Databox and scopes the report to your mix. If you only run on two platforms, the report is scoped to those two. If you run on all five, every section scales to include all of them.
What is the minimum data window for a meaningful cross-channel baseline?
Ninety days is the practical floor. Anything shorter and you do not have enough volume on the smaller channels to read trend. Six months is cleaner if you have it, especially for accounts with seasonality.
What if I only spend on one or two ad platforms right now?
The skill still works. It reads whichever platforms you have connected in Databox and scopes the report accordingly. Every section scales to the number of platforms in your mix. A one-platform report is legitimately smaller than a five-platform report, not padded to look bigger.