


")
Table of contents
Want to know what separates good marketing agencies from exceptional ones? It is how they analyze and communicate marketing performance.
This is easier said than done. Between two big challenges like cleaning up messy data and the inability to connect and analyze across applications and platforms, it is no wonder why many agencies default to delivering just “so-so reports.”
This doesn’t have to be the case.
In this post, we’re sharing the most common marketing performance challenges that agencies face as well as report templates you can use to solve them.
- Best Tools for Analyzing and Presenting Marketing Strategy Performance
- 5 Challenges Agencies Face When It Comes to Showing Marketing Performance
- Marketing Performance Reporting Templates
- Analyze Marketing Performance in Databox

Best Tools for Analyzing and Presenting Marketing Strategy Performance
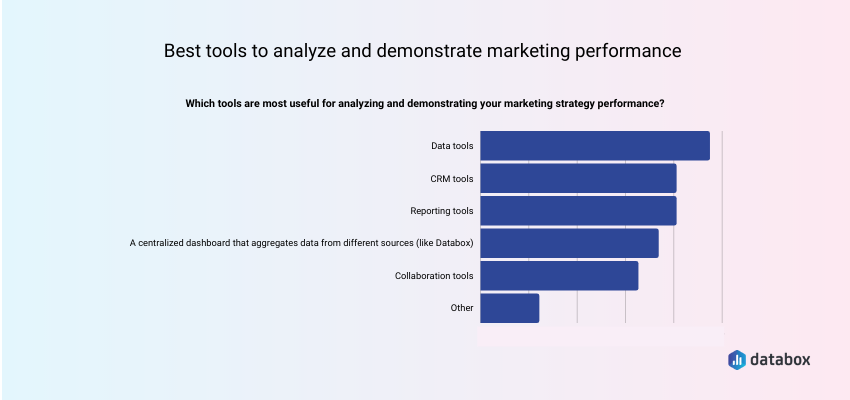
While you can analyze marketing performance manually through spreadsheets alone, that’s going to make your job a lot harder than it needs to be. That’s one of the reasons why all 38 marketers we surveyed said they use various tools to help with analyzing marketing performance.
The most popular tools that these folks were using are data tools, followed by CRM, reporting, and centralized dashboard tools (like Databox).
5 Challenges Agencies Face When It Comes to Showing Marketing Performance
From messy data to the inability to analyze across various platforms and specific buyer stages, there are many challenges that marketing agencies face when creating marketing performance reports.

Let’s take a closer look:
- Gathering and analyzing data from multiple platforms
- Getting accurate data for paid social advertising campaigns
- Collecting too much data
- Aligning your agency’s results with the business’s goals
- Setting clear expectations around results
1. Gathering and analyzing data from multiple platforms
One of the biggest challenges is simply being able to gather data across all of the tools you are using. There are challenges in both accessing the data and getting it in a format where it is easy to compare apples to apples.
“Multichannel marketing strategies are a necessity for most businesses in today’s world, but it’s also undeniable that they make data collection, analysis, and demonstration far more difficult,” says Roy Morejon of Enventys Partners.
“When demonstrating marketing performance to clients, gathering data from every single channel and preparing it in a digestible way poses a huge challenge. Agencies need to be able to express progress, strategy, and next steps to clients in a concise but meaningful way, so an inability to connect data across platforms can be crippling.
The solution lies in software and technology and ensuring that marketing and IT teams have a strong, communicative partnership. Implementing the correct reporting software can make complex cross-channel data collection far easier – modern agencies simply can’t rely on manual analytics for best results.”
Matt Mazur of Preceden agrees, “One big challenge many SaaS businesses face is setting up business intelligence reporting that combines data from multiple sources. For example, at Preceden we use a cloud Postgres database for application data, Google Analytics and Mixpanel for analytics, Stripe and PayPal for payments, and Google Ads for advertising. To analyze marketing performance effectively we need to combine data from all these sources.
We have a fairly complicated setup to address this: we use Stitch to centralize the data in a data warehouse, dbt to clean it up, and Mode Analytics to set up reporting. Tools like Databox make reporting much simpler by taking care of all this for you in one extremely powerful tool.”
PRO TIP: How Well Are Your Marketing KPIs Performing?
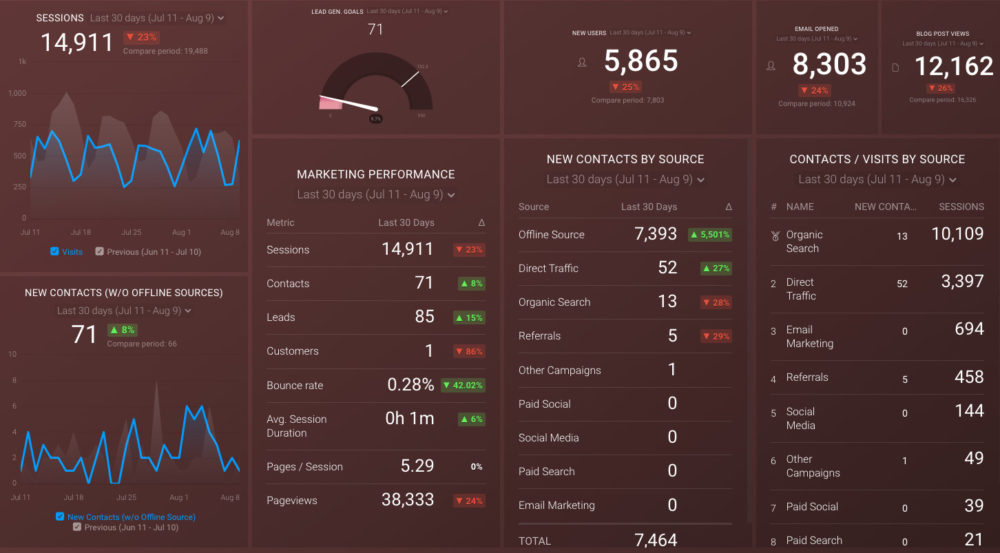
Like most marketers and marketing managers, you want to know how your efforts are translating into results each month. How is your website performing? How well are you converting traffic into leads and customers? Which marketing channels are performing best? How does organic search compare to paid campaigns and to previous months? You might have to scramble to put all of this together in a single report, but now you can have it all at your fingertips in a single Databox dashboard.
Our Monthly Marketing Performance Dashboard includes data from Google Analytics 4 and HubSpot Marketing with key performance metrics like:
- Website sessions, new users, and new leads. Basic engagement data from your website. How much traffic? How many new visitors? How many lead conversions?
- Lead generation vs goal. Did you reach your goal for lead conversion for the month, quarter, or year? If not, by how much did you miss?
- Overall marketing performance. A summary list of the main KPIs for your website: sessions, contacts, leads, customers, bounce rate, avg. session duration, pages/session, and pageviews.
- Email response. Overall, how effective were your email campaigns, measured by email opens?
- Blog post traffic. How much traffic did your blog attract during a certain period?
- New contacts by source. Which sources drove the highest number of new contacts
- Visits and contacts by source. How did your sources compare by both sessions and new contacts in a certain period of time?
Now you can benefit from the experience of our Google Analytics and HubSpot Marketing experts, who have put together a plug-and-play Databox template that contains all the essential metrics for monitoring and analyzing your website traffic and its sources, lead generation, and more. It’s simple to implement and start using as a standalone dashboard or in marketing reports!
You can easily set it up in just a few clicks – no coding required.
To set up the dashboard, follow these 3 simple steps:
Step 1: Get the template
Step 2: Connect your HubSpot and Google Analytics 4 accounts with Databox.
Step 3: Watch your dashboard populate in seconds.
2. Getting accurate data for paid social advertising campaigns
With recent privacy updates, getting accurate attribution data is more challenging than it was even a year ago.
“Since the iOS14 update and the war between Facebook and Apple about data and privacy, it has been quite a challenge to accurately track the performance of Facebook/Instagram advertising campaigns,” says Jonathan Aufray of Growth Hackers. “We found a solution by setting attribution channels with Google Analytics as well as using a tool like Hyros for our e-commerce customers. This way, we could measure more efficiently how the marketing campaigns performed and which channels brought the most leads, users, sales, ROAS, and ROI.”
Related: Here’s what we have learned about the most important trends related to advertising on Facebook including placements, targeting, ad creative, and much more after surveying 320 companies globally.
3. Collecting too much data
On the flip side, it is possible to spend so much time amassing data that you don’t have time to analyze it properly, try to throw all of it into a cluttered report making it impossible to draw meaningful conclusions, or get stuck in analysis paralysis.
“In our case, the biggest challenge in managing marketing analytics is collecting too much data, resulting in an inability to navigate through it and draw meaningful conclusions,” says Natalia Brzezińska of PhotoAid. “Unfortunately, it’s not true that the more data you collect, the more you will learn from it. The key is the proper selection. Collecting too much information keeps you from turning data into actionable insight and makes you lose focus on your KPIs. What helped us was carefully analyzing our goals and determining the path to achieve them. It gave us an idea of what data we should be collecting. We first focused on the goals to be achieved and then decided what data we needed to collect.”
Gary Taylor of Book Your Data adds, “The biggest challenge that we faced in demonstrating marketing performance would be the bombardment of data. Initially, we thought that the more data we collected, the greater the chances to be visible to our target audience.
However, in reality, things were much different and we weren’t able to turn this data into actionable insights. The information available was often unnecessary or not even relevant to the topic. Our company overcame this challenge by understanding the goal we wish to achieve through data gathering. It allowed us to gather minimal but quality data that could be used by our marketing department. Through this strategy, we were able to gauge our target audience’s interest and how we can leverage it for an increased profit margin.”
The other problem that can happen when you collect too much data is that you spend all of your time hoarding the easiest data that you can find. And, you wind up with a bunch of vanity metrics that might look pretty going up and to the right on a chart but they don’t tie back to meaningful business goals.
Related: How to Analyze Data: 30+ Experts on Making Sense of Your Performance
For instance, Dustin Porreca of Elevate Demand says, “As a marketer, you’re tasked with proving the value of your efforts to those in charge. And as the years go by, that becomes an increasingly difficult task. The range of data and options available to you means that it’s harder than ever to isolate which efforts are actually driving results.
Our agency used to go wrong in two places:
Too much data & jargon in reports
When you have too much technical data & jargon in reports clients feel blindsided. They don’t know the technicalities of your work, all they want is results. They want to know the problem, what it affects, how to fix it, and the deadline. That’s it.
Sure, you can see that traffic to clients’ sites is increasing and sales are going up with a bunch of graphs. But what does all that mean in terms of easy-to-read tangible results? It was a problem we had to fix. I was sitting in my chair staring at my computer screen. It was full of massive graphs and technical romance. “If we keep this up our clients are going to hate us,” I said. They were sick of receiving massive reports that didn’t show a clear path to results.
So we made a change, we formed a framework where we used everyday language and explained things in a way that our clients would understand for all of our reports. The result? Very happy clients. They were relieved, and from that point on we realized we had to speak their language, not ours.
Tracking vanity metrics in isolation
Clients don’t need a number-fabricating factory – so ditch the vanity metrics. Tracking organic traffic, site rankings, time on site, new users, etc, in isolation is a BAD idea.
So traffic jumped +80%, what’s that even mean? Did your clients make more money from it? Were there more demo requests? Higher email opt-ins?
Still, in 2022, agency after agency are throwing these green plus signs in reports like they’re revolutionizing a business with more visitors. These metrics look fancy on paper but really don’t help clients reach their business goals, & that’s why we all do what we do. To make people more money.
After some time we realized that these metrics mean nothing standing alone. So we started pairing them up with reporting software. For example, let’s say a client’s goal was to increase webinar sign-ups for a specific page.
The next time we delivered a report, it wouldn’t just be, “Look! More traffic is coming to the page!”. It would be, “We’re seeing an increase in page visits through organic, but that’s not what’s driving your registrations. It looks like referral and social channels are responsible for over 50% of webinar registrations. So we’re going to allocate more time in that area for the best results.”
Performance reporting can’t consist of these metrics in isolation. When we start to pair these up & see the impact they have together, it uncovers patterns agencies can use to drive results and impact their clients’ bottom line.”
Related: How to Improve Your Business Bottom Line By Setting Goals and Alerts in Databox
4. Aligning your agency’s results with the business’s goals
This brings us to another common challenge of making sure you are communicating clearly how your agency’s work ties back to the business’s goals.
“Demonstrating real marketing performance can be tough, particularly when it comes to showcasing results to clients,” says Ben Austin of Absolute Digital Media. “We start by asking our clients what’s most important to them, getting an understanding of what they want to see before expanding our reporting to encapsulate everything that may be of interest. To some extent, a lot of these reports are tailored to the clients’ needs.
For example, what a manager may need to report back to their Director and so on, providing the opportunity to benchmark everything we do from the very start. Reporting across the agency differs too with our SEO, PPC, and DPR teams using Google Data Studio in different ways to showcase monthly results, completed activities, and upcoming tasks.”
Freddie Hart of Frhart2 Enterprises LLC adds, “I think the main challenge was sometimes helping the client understand the metrics for their goals. For example, someone selling e-commerce’s goal would be conversions. A person who sells consulting may hear the same thing and think that conversions are their goals, but for them, our task is generating leads. If you sit down and have that conversation with radical candor with the client.”
Admittedly, this is easier for PPC and paid social agencies as well as any BOFU activities. Aligning your results to key business goals can be more challenging for extreme TOFU activities like PR and link-building.
For example, Rad Paluszak of Husky Hamster says, “Being mainly a link building agency, we have two main challenges when it comes to demonstrating marketing performance. Both of them stem from us working only on a small part of a more elaborate marketing strategy.
First of all, we need to create the link strategy goals that are translatable (both ways) to the client goals. The main issue here comes from the fact that there’s no direct alignment between what clients need (ROI) and how link delivery is measured (quantity and quality).
The two disconnected sets of goals don’t directly create a cause-and-effect sequence. To put it into perspective, just the fact that you got 10 high-quality links might mean a lot for your website, or it might just be a tiny grain of sand that didn’t move the needle at all.
So, to solve it, we always communicate with our clients’ marketing or business development teams to ensure that the link-building strategy we work towards is aligned with their business goals.
Sometimes it means our strategy will be targeting specific keywords or pages. Other times, it could be helping to drive traffic through additional exposure.
What’s important, the approach to this problem has to be bespoke.
The other issue we have is the product of different ways or tools we use for reporting, combined with the characteristic of links. In link building, we usually report to clients at certain, agreed-upon, points in time. The report consists of the links we provided in the given timeframe and their quality metrics.
On its own, it seems like something that is almost out-of-context. So, in order to add context to it, we combine it with the business results the campaign is driving for the client (as described above).
But, there’s a catch – links don’t drive the results instantaneously. The link-building effects are usually delayed by at least a few weeks, up to a month. So, we cannot report on the results right away – it’s like sitting on a time bomb!
What we do is, first and foremost, educate the client about this phenomenon, so they know what’s coming. Secondly, we create our first month’s report to be a benchmark of the current situation. The actual business-impact reporting comes from the 2nd month onwards when we can, finally, make a comparison to the benchmark. What helps is reporting tools, like Databox, where we can compare different data points (benchmark vs current state) in one place.”
Related: 36 Agencies on How to Set Goals for Clients (When the Client Doesn’t Have Any)
5. Setting clear expectations around results
While this might seem to be a marketing performance challenge, it is actually a communication breakdown between the agency and the client.
“Communicating the value of SEO,” says Niles Koenigsberg of Real FiG Advertising + Marketing. “Many clients expect near-instant results from our marketing efforts, and the same expectations carry over into SEO. Although we explain the process thoroughly, some clients can struggle to see the value of our SEO efforts and whether or not we’re making progress in their organic rankings.
To overcome this challenge, we always include a detailed section in our client reports that outlines changes in our organic rankings on a rolling quarterly basis. This way, we can highlight the keywords and phrases that we’ve seen significant improvement for in the past month and quarter. As such, we are being transparent about changes to our rankings each month and the client gets a clear understanding of our SEO gains.”
While the process that Niles shared works, one way that you can avoid these awkward conversations and add-ons to your reports moving forward is to have these conversations during the sales process before you start working together. This way, the expectations around results are clear on both sides.
Marketing Performance Reporting Templates
Once you know what you need to track and analyze, the fastest and most effective way to present this information to clients is by creating marketing performance report templates.
In fact, 81.58% of our respondents have reporting templates for marketing performance while only 15.79% build the report for each client from scratch, every time.

There is no need to build a client report from scratch when there are so many reporting tools and pre-built templates that can make your job easier.
In fact, here are six of our marketing performance dashboard templates that you can download and use for free.
- Marketing Performance Overview Dashboard
- Paid Marketing Overview Performance Dashboard
- Social Media Performance Dashboard
- Blog Performance Tracking Dashboard
- Email Marketing Performance Dashboard
- Video Marketing Performance Dashboard
1. Marketing Performance Overview Dashboard
This marketing performance overview dashboard works well if you want to share how much traffic is turning into leads and how many leads are turning into MQLs and SQLs.

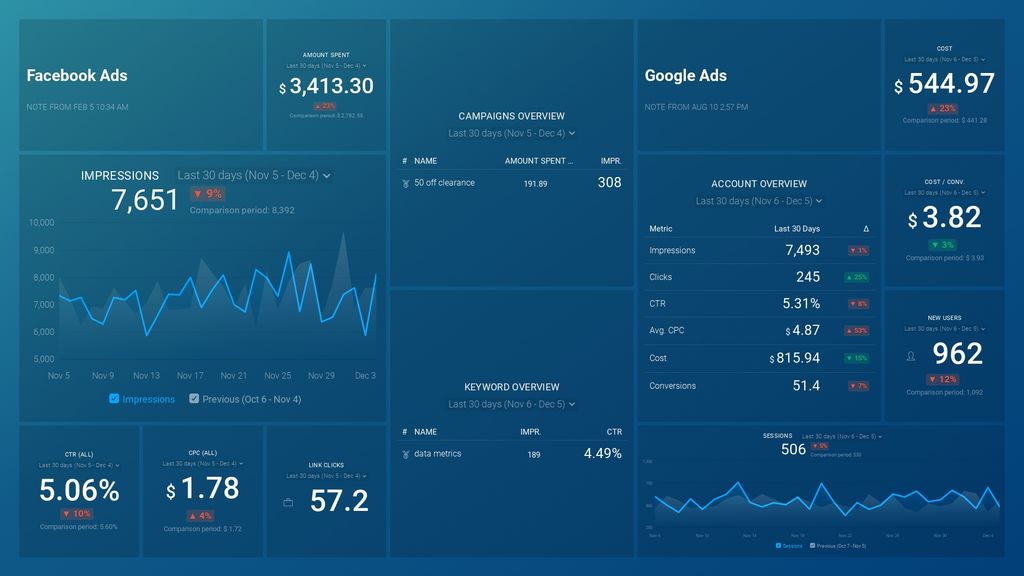
2. Paid Marketing Overview Performance Dashboard
PPC and paid social advertising agencies might want to use this Facebook Ads and Google Ads Paid Marketing Overview Dashboard. This displays the overall performance and ROI of your campaigns.
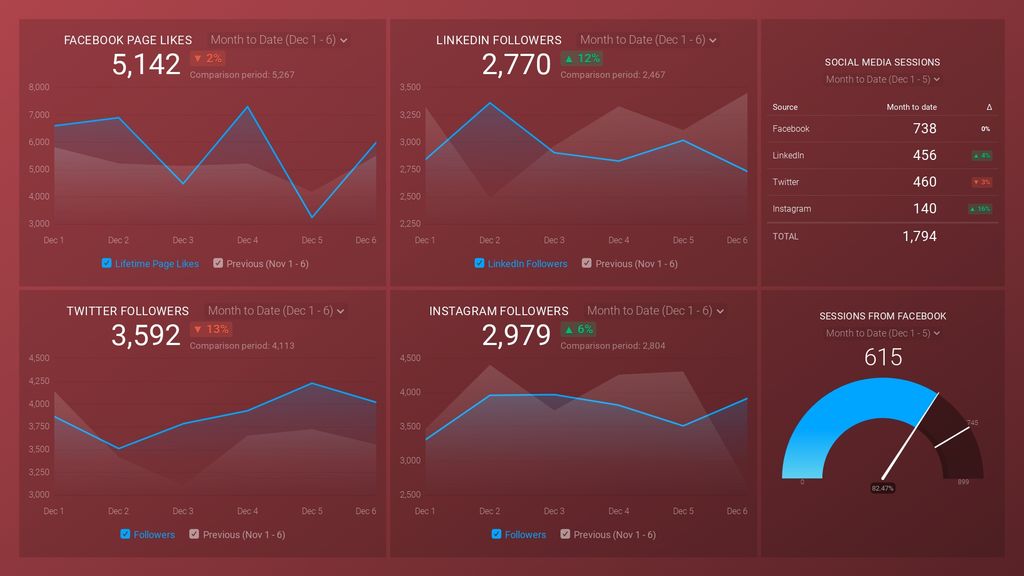
3. Social Media Performance Dashboard
Social media agencies may find this social media performance dashboard useful for displaying TOFU social media metrics, like new followers or sessions from specific social media channels.
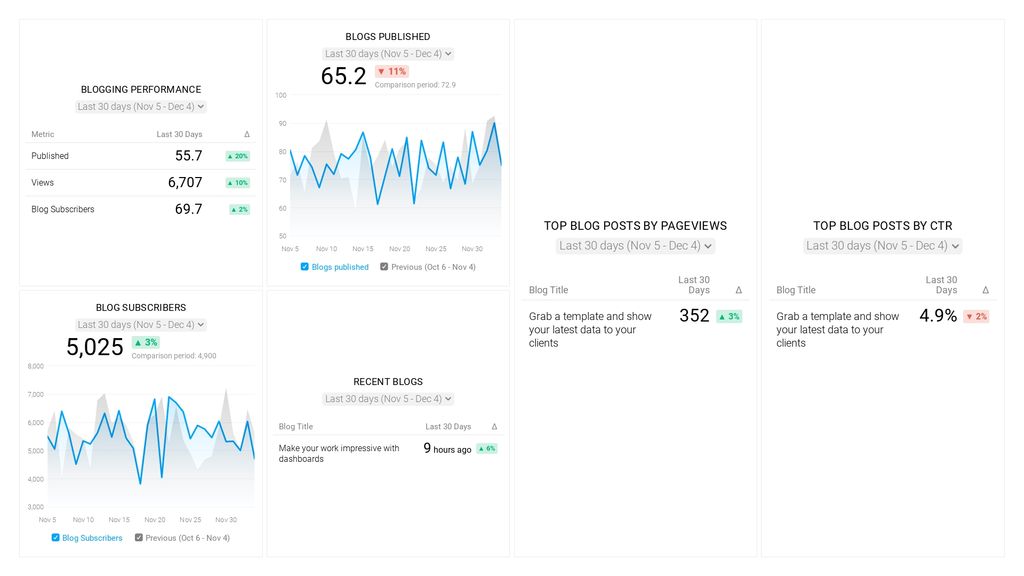
4. Blog Performance Tracking Dashboard
Content marketing agencies should bookmark this blog performance dashboard, so that you can quickly share the highest performing blog content with clients.
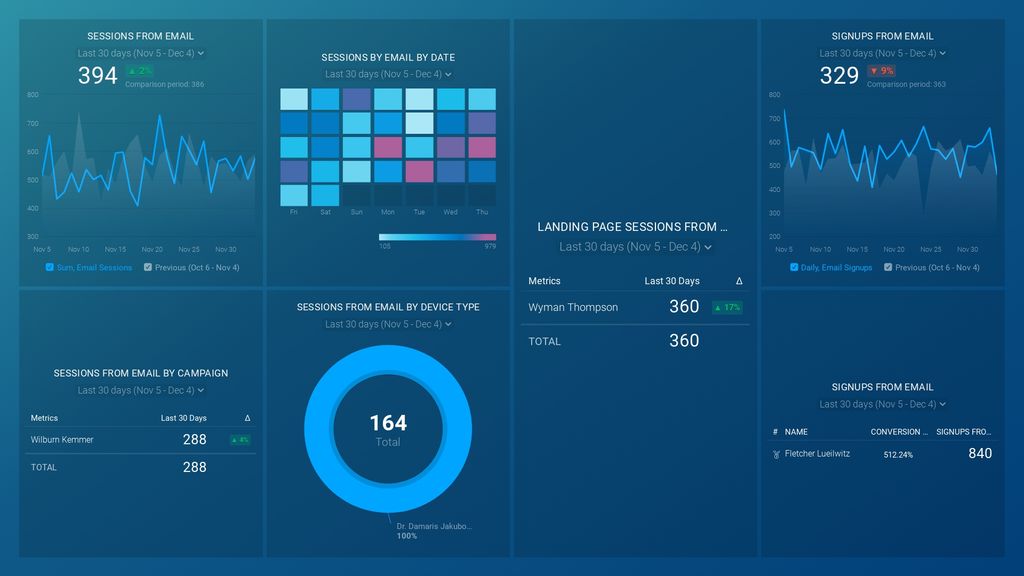
5. Email Marketing Performance Dashboard
Email marketing agencies can use this email marketing performance dashboard to analyze the effectiveness of various email campaigns and one-off emails.
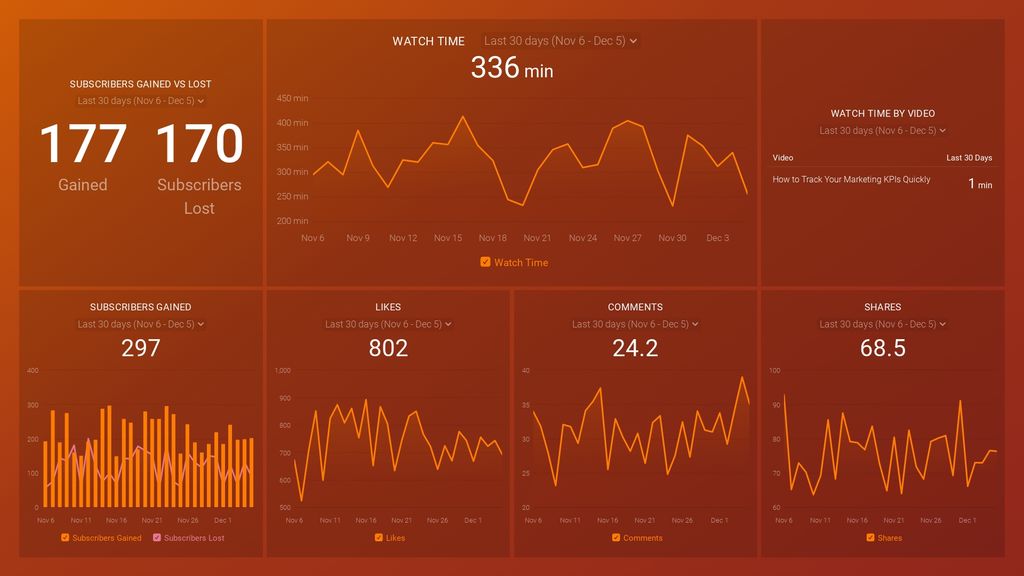
6. Video Marketing Performance Dashboard
Youtube agencies can use this video marketing performance dashboard to keep an eye on key metrics like subscriber count, likes, comments, watch time, and shares.
Analyze Marketing Performance in Databox
You don’t need to reinvent the wheel every time for every marketing performance report. It is not only wildly inefficient, but it is taking away time that you could be spending getting more results for your clients.
That’s why you should create marketing performance templates instead. You spend the time creating a template once, and you can use it over and over again. And, you can even reuse it across all of your agencies’ clients.
The best way you can use a dashboard software like Databox is to create these dashboard templates across all of your agency’s accounts.
Ready to give Databox a try? Sign up for a free trial here.


