Table of contents
A manual walkthrough, and the Claude skill that does it for you.
TL;DR
- You don’t need a dedicated AEO platform. Your GA4 referral traffic and your Search Console query footprint already capture most of the signal a paid AI visibility tool would surface. The work is in joining them.
- Three steps build the manual baseline. Filter GA4 referral traffic by the major AI engine domains, export your top GSC queries by impressions, and cross-reference the two in a spreadsheet to find your gap queries.
- The hardest manual step is the cross-reference. Identifying queries where you rank in traditional search but receive no AI referrals is where the highest-leverage content opportunities surface, and it’s the work that doesn’t scale past monthly without automation.
- Cadence matters more than precision. Weekly volume checks, monthly full refreshes, quarterly competitor prompts run by hand.
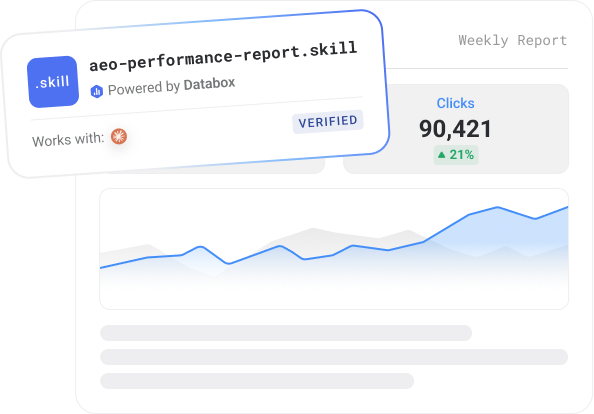
- The AEO Report Claude skill automates the join. The same GA4 and Search Console data, joined in about 30 seconds, returned as a six-section report inside a Claude conversation.
Every AEO guide tells you that you need a dedicated AI visibility platform. You don’t. Your GA4 and your Search Console already have most of the signal. Here’s how to pull it manually, and here’s the skill that does it for you when manual stops being worth the time.
The procedure is three steps in tools you’re already using. Filter GA4 referral traffic by the major AI engine domains. Export your top Search Console queries by impressions. Cross-reference the two in a spreadsheet to find your gap queries, the queries you rank for in traditional search that send you no AI referral traffic. Those gap queries are the highest-leverage content opportunities a marketing director can take to the next sprint.
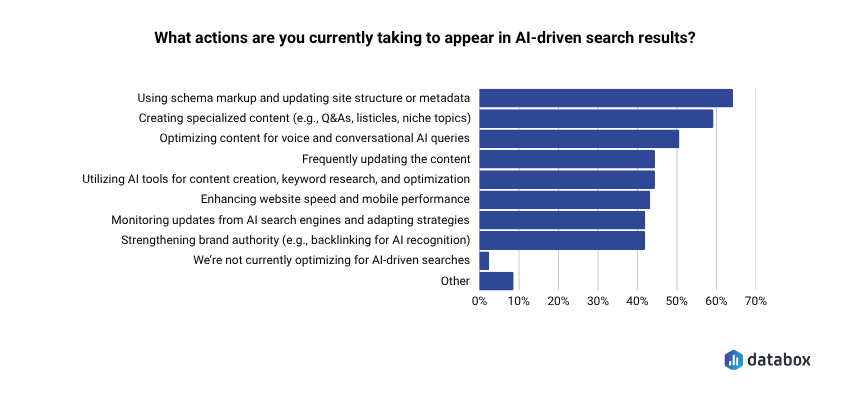
The push to optimize for AI search is well ahead of the push to measure it. In the Databox SEO and Generative AI research, 64.20% of SEO and content marketers reported updating site structure or metadata with schema markup to improve AI-driven search visibility, and 59.26% reported creating specialized content for AI-generated overviews. Most of those teams have no recurring report telling them whether any of it worked. The signal is in their stack already. The work is in joining it.
You don’t need a dedicated AEO platform. Your GA4 referral traffic and your Search Console query footprint already capture most of the signal a paid AI visibility tool would surface. The work is in joining them.
- Three steps build the manual baseline. Filter GA4 referral traffic by the major AI engine domains, export your top GSC queries by impressions, and cross-reference the two in a spreadsheet to find your gap queries.
- The hardest manual step is the cross-reference. Identifying queries where you rank in traditional search but receive no AI referrals is where the highest-leverage content opportunities surface, and it’s the work that doesn’t scale past monthly without automation.
- Cadence matters more than precision. Weekly volume checks, monthly full refreshes, quarterly competitor prompts run by hand.
- The AEO Report Claude skill automates the join. The same GA4 and Search Console data, joined in about 30 seconds, returned as a six-section report inside a Claude conversation.
What AI search visibility actually means in this context
AI search visibility is the combination of two things: how often your domain shows up as a cited source inside AI-generated answers, and how often that citation translates into a session on your site. The first lives in your Search Console query footprint. The second lives in your GA4 referral traffic.
You can build a baseline of both in about an hour. Everything below is the procedure.
Step 1: Pull AI referral traffic out of GA4
Most major AI engines now show up as referrers in GA4 when a user clicks through from an AI-generated answer. Coverage isn’t perfect. Some assistants strip the referrer, especially on mobile, and some users land via copied URLs that lose the referrer entirely. Enough comes through to read direction and rough volume.
The domains worth tracking, as of mid-2026:
- chatgpt.com (and chat.openai.com for older traffic)
- claude.ai
- perplexity.ai
- gemini.google.com
- copilot.microsoft.com
- grok.com
- chat.deepseek.com
- chat.mistral.ai (and mistral.ai for Le Chat)
- manus.im
To pull the traffic into a single view:
- Open GA4. Go to Reports → Acquisition → Traffic acquisition.
- Change the primary dimension to Session source / medium.
- Add a filter on Session source using the regex match condition. Paste: chatgpt\.com|chat\.openai\.com|claude\.ai|perplexity\.ai|gemini\.google\.com|copilot\.microsoft\.com|grok\.com|deepseek|mistral|manus.
- Set your date range to the last 90 days. This gives you enough volume to see which engines actually send you traffic and which ones don’t.
That’s your AI referral snapshot. You now know which engines cite your content often enough to drive sessions, which engines don’t, and roughly how that volume is trending. For most B2B sites, ChatGPT and Perplexity dominate. Gemini and Copilot are usually thinner, and the long tail (Grok, DeepSeek, Le Chat) varies wildly by industry.
If you want this view permanently, build it as a custom channel group. Go to Admin → Data display → Channel groups → Create new channel group → Add channel → “AI engines”, using the same regex. From that point on, you can pivot any GA4 report by the AI engines channel.
One thing to flag: AI referral traffic in GA4 only counts users who clicked through from the AI answer. It misses citations that informed a user but never sent a click. That’s a structural limitation of the data. The next step partly fills the gap.
Step 2: Use Search Console to find your AI Overview footprint
AI Overviews and other AI-generated SERP features pull from your traditional search footprint. The queries you already rank for in Google are the queries most likely to feed an AI Overview that cites you. Search Console is where this surfaces.
Two views matter.
The Search appearance filter. In Search Console, go to Performance → Search results, then add a filter for Search appearance. Where available, this exposes which queries returned AI Overviews on your top-ranking pages. Coverage is still rolling out, so the filter may show partial data depending on your verticals.
The impression-to-click gap. Sort your Performance report by Impressions, descending. Look for queries with high impressions and unusually low CTR relative to your average position. The crocodile effect is the widening gap between rising search impressions and falling clicks. It signals that an AI Overview is delivering the answer above your blue link, and the click never reaches your site. Search Console is where you can see it forming for specific query categories.
Export your top 100 queries by impressions for the last 90 days. Note position, impressions, clicks, and CTR. This is the input for Step 3.
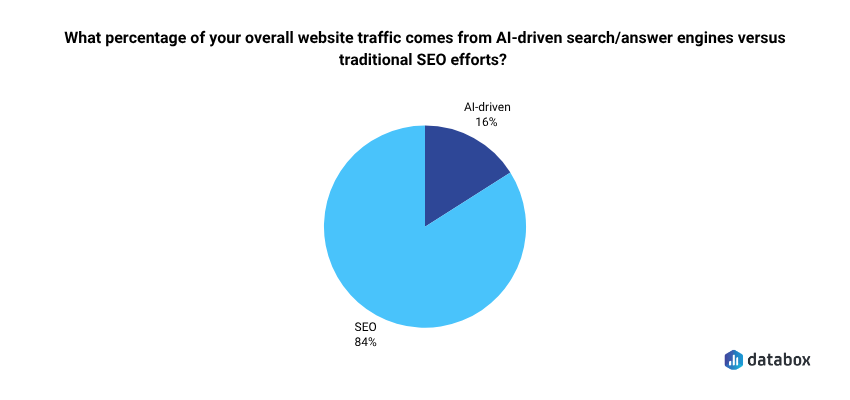
For context on scale: in the Databox SEO and Generative AI survey, marketers reported that 84% of overall website traffic still comes from traditional SEO efforts, with the remainder attributed to AI-driven search and answer engines. The channel is still small relative to traditional search, but it’s growing fast enough that most teams can no longer answer their CMO when asked about it.
Step 3: Cross-reference GA4 and Search Console to find your gap queries
The actual report is the join. GA4 tells you which AI engines send you traffic and which landing pages they land on. Search Console tells you which queries you rank for and how well they convert to clicks. The intersection is where the insight lives.
Open a spreadsheet. Build three columns:
- Top 50 queries from Search Console, sorted by impressions, last 90 days.
- Top landing pages from GA4 AI referral traffic, same date range, filtered to the AI engines you set up in Step 1.
- Match status: for each GSC query, mark whether the page that ranks for it appears in your AI referral landing pages.
The interesting rows are the mismatches. Three patterns to look for.
A query where you rank high in GSC and receive AI referral traffic on the same landing page is a query where AI engines are already citing you. Keep that page fresh.
A gap query is a query you rank for in traditional Google search but that sends you no AI referral traffic on the matching landing page. Your content ranks in traditional search but isn’t being cited in the AI answer for that topic. Someone else is. This is the highest-leverage row in the spreadsheet because it tells you exactly where to focus content updates, schema additions, or entity-disambiguation work.
A query with no traditional ranking but unexpected AI referral traffic on a landing page tells you AI engines are discovering content you didn’t optimize for traditional search. Worth knowing, because it changes what you’d publish next.
This three-way reconciliation is the report. For a 50-query baseline, it takes one to two hours the first time. Doing it monthly takes about 30 minutes once your spreadsheet template exists. Doing it weekly is where the math stops working for most teams.
Two things the manual method does poorly
Worth being honest about these, because they’re where the manual workflow starts costing more time than the report is worth.
Doing this weekly. The GA4 plus GSC join takes one to two hours the first time you build the spreadsheet. Monthly refreshes drop to about 30 minutes. Weekly is where the math stops working. The point of measurement is recurrence, and a workflow you only run quarterly isn’t a measurement system. It’s an audit.
Period-over-period deltas across engines. GA4 will show you a week-over-week delta on AI referral volume in aggregate, but breaking that out to nine engines, each with its own trend line, requires more spreadsheet work than most teams sustain. The number that matters in a leadership review is the delta, not the snapshot. Without it, you’re showing a still photo of a moving channel.
One limitation worth naming clearly: direct competitor citation tracking isn’t something either method does well. GA4 and Search Console see only your own data, and a structured AEO report that reads the same sources sees the same data. To find out which specific competitors are being cited in AI answers for the queries you care about, you have to run the prompts yourself. Open ChatGPT, Claude, Perplexity, Gemini, Copilot, and the rest. Type each query. Record what they return. For a 20-query competitive set across nine engines, that’s 180 manual prompts. Doable once. Painful weekly. Both the manual method and the skill can infer competitor displacement from low-CTR-on-high-impression queries. Neither can observe the citation directly.
How often to run the manual report
A reasonable rhythm for the manual workflow:
- Weekly: Check GA4 AI referral volume against the prior week. Look for shifts greater than 25% on any one engine. Most weeks, nothing moves enough to warrant action.
- Monthly: Re-run the GSC export, refresh the spreadsheet, identify any new gap queries. Share the top three findings with leadership in a Notion doc or a Slack message. About 30 minutes once the template is built.
- Quarterly: Run the competitor citation check on your top 20 priority queries. Use the output to inform editorial planning for the next quarter.
This is enough to stay current. It is not enough to feel comfortable in a board meeting if someone asks for a structured AEO report on demand.
When the manual method stops being worth the time
If you’re running this weekly, you’re spending two to three hours a month on spreadsheet reconciliation. That number grows with every engine you add and every competitor you start monitoring. At some point the math stops favoring manual.
That’s the point of the AEO Report Claude skill Databox shipped to the Skills Marketplace. It runs against the same two data sources you’ve been using, your GA4 referral traffic and your Google Search Console footprint. The difference is that it pulls them through your Databox workspace via MCP, joins them, and writes the six-section report into a Claude conversation: AI referral traffic by engine with period-over-period deltas, a topic coverage map, a gap analysis on high-impression queries with zero AI referral contribution, competitor displacement signals, a content opportunity list ranked by AI citation potential, and one prioritized action. About 30 seconds per run, every time you invoke it.
To install: download the skill from the Skills Marketplace, open Claude Desktop and import the file from Settings → Skills, then connect Databox via the MCP connector. The setup guide ships with the download. Total setup is about five minutes.
Get the AEO Report Skill
 A Claude skill that cross-references your Google Search Console footprint with AI referral traffic signals across all major AI engines to map where your brand is visible in AI-generated answers and where it isn’t.
One piece of editorial advice: if you’ve never built the manual version, do it once before installing the skill. The first manual pass is what teaches you which queries actually matter for your business, which gap rows are worth acting on, and which engines you can ignore because they don’t send your audience any traffic. Then automate everything you’d otherwise do by hand.
Frequently Asked Questions
Do I need a paid Databox plan to do the manual version of this?
No. The manual method uses GA4 and Search Console, both of which are free. You don’t need a Databox account at all for the spreadsheet workflow. A Databox account is only relevant if you decide to install the AEO Report skill, which reads GA4 and GSC through your Databox workspace via MCP.
Why doesn’t all my AI referral traffic show up in GA4?
Three reasons: Some AI engines strip the referrer when a user clicks through, especially on mobile browsers. Some users copy the URL rather than clicking the link, which drops referrer data entirely. And some AI clients open links in app-internal browsers that don’t pass referrer headers. Expect your GA4 numbers to be a directional floor, not a complete count.
How accurate is the Search Console “Search appearance” filter for AI Overviews?
Coverage is still rolling out and varies by query category, language, and country. For some verticals, the filter shows meaningful data. For others, it’s still sparse. Use the impression-to-CTR gap analysis as your primary signal until coverage stabilizes, and treat the Search appearance filter as a supporting view.
Can I do the manual cross-reference in Looker Studio instead of a spreadsheet?
Yes, and for teams already running Looker Studio on top of GA4 and Search Console it’s worth setting up once. The trade-off is that Looker Studio takes two to four hours to configure properly the first time, versus about an hour for the spreadsheet version. If you’re testing whether AEO measurement is going to be a recurring workflow, start in a spreadsheet. If you already know it will be, build it in Looker Studio.
What’s the minimum data window for a meaningful first AEO baseline?
Ninety days of GA4 referral data is the practical floor. Anything shorter and you don’t have enough volume on the smaller engines to read trend. For Search Console, 90 days is also a reasonable starting point, though six months gives you a cleaner view of seasonality and the impression-to-click gap. Run your first full report on a 90-day window, then extend to 180 days once you have a few months of monthly snapshots to compare against.