


")
Table of contents
An agency-friendly tool cuts reporting time per client without turning every dashboard question into a support ticket.
An Account Director sits down two hours before a monthly client call, sees the same pattern again, and opens PowerPoint. The dashboard exists, but the client never “gets it” without a guided tour, so the agency rewrites the story every month to prevent confusion and churn.
A dashboard your client can’t read independently is a service ticket waiting to happen. An agency that fixes that pattern protects margin, reduces last-minute scramble work, and looks more credible in every review.
Self-service analytics tools fail agencies when every new client forces a rebuild and a new support queue
Self-service breaks for agencies in two predictable ways.
First failure mode: every new client becomes a mini-implementation. A Head of Client Services sees reporting hours spike when a new account signs, then approves more non-billable time to get “the same dashboard” rebuilt for a different ad account, CRM, and ecommerce stack.
Second failure mode: dashboards that require interpretation turn into ongoing support. A client asks why paid social CPL rose last month, the Account Director cannot point to a visible breakdown inside the dashboard, and the agency absorbs another round of custom analysis plus a new slide deck for the follow-up call.
Agency self-service means clients can answer routine questions inside the dashboard without contacting your team, while your team can onboard each new client without rebuilding the system from scratch. An agency owner can tie that definition to a number, specifically weekly non-billable reporting hours, then decide to standardize dashboards and permissions before adding headcount.
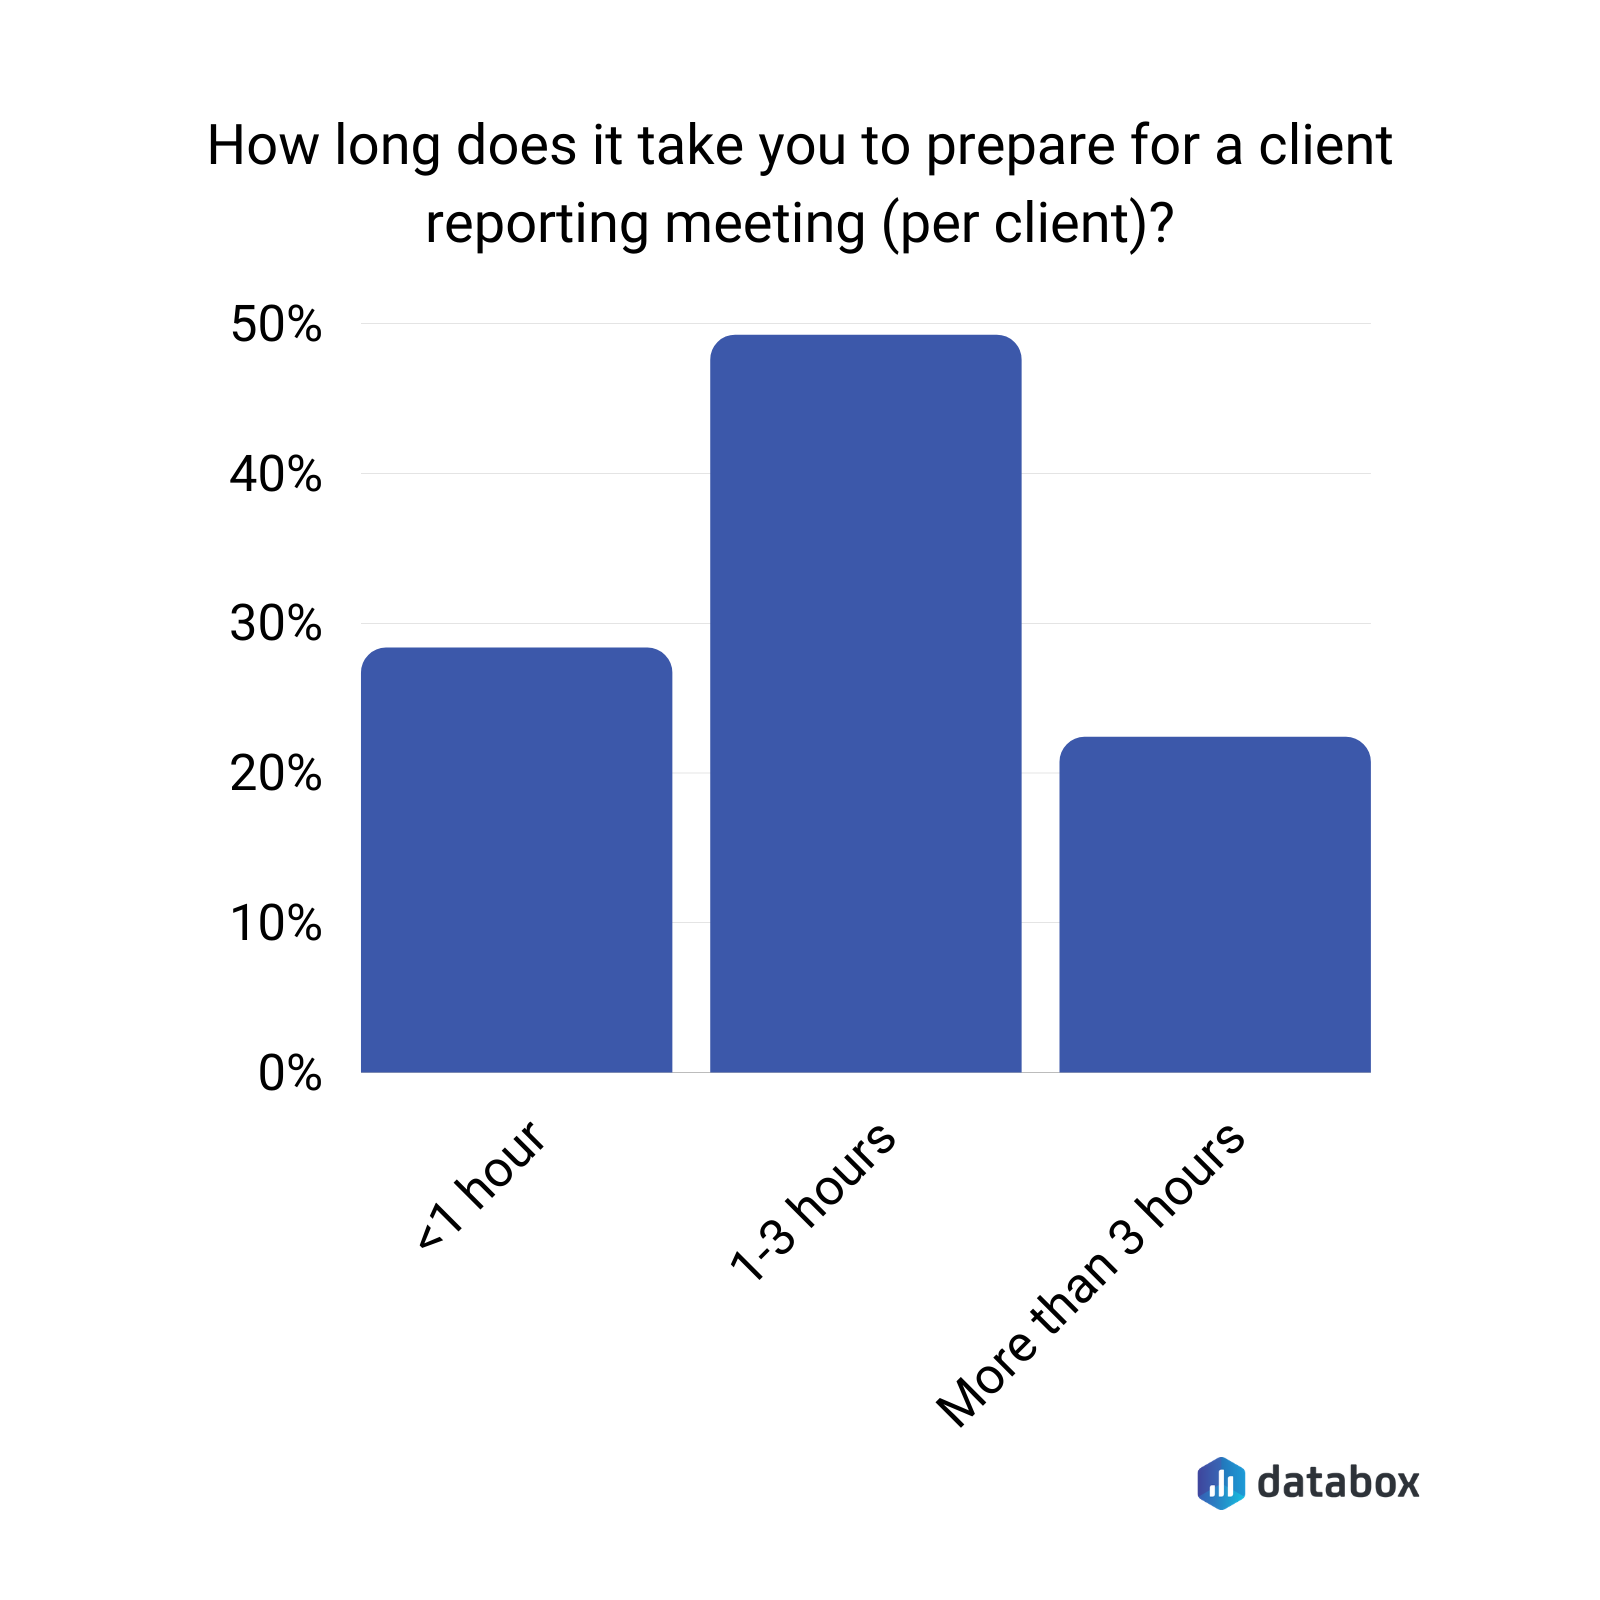
According to Databox research on the biggest mistakes in client reporting meetings, 49% of agency teams spend 1–3 hours preparing for a single client reporting meeting — per client, per month. For an agency managing 15 clients, that preparation time alone consumes 15–45 hours before any report is written or sent. titive disadvantage. By the time the analyst queue clears, the decision window has often already closed.
Agency-grade evaluation criteria reduce the decision to five make-or-break questions
Plenty of tools claim self-service. Agencies need a narrower test that maps to margin and client retention.
Multi-client management
Multi-client management means one agency login runs separate client workspaces with repeatable templates. An Agency Owner watches gross margin drop when each new client requires duplicating dashboards, reconnecting sources, and redoing permissions, then decides to standardize a “client workspace” pattern that new accounts slot into rather than rebuild from.
White-labeling
White-labeling means the client sees your brand, not the vendor’s, across dashboards, scheduled reports, and email sends. A Founder notices clients treat reports as less credible when a competing vendor’s logo dominates the interface, then decides to shift reporting into a fully branded experience that reinforces the agency’s relationship, not the tool’s.
Client-facing usability
Client-facing usability means a non-technical stakeholder can navigate, filter, and interpret without training. An Account Director sees the same “wait, what am I looking at?” moment in client calls, then chooses tooling that keeps navigation obvious and metric context visible next to every chart.
AI reporting assistance
AI reporting assistance means the tool can produce narrative summaries and answer natural-language questions without an analyst writing a custom explainer every month. A Director of Client Services tracks time-per-client on monthly reporting, then adopts AI summaries to cut repeat commentary work while keeping the numbers consistent.
AI reporting only helps agencies when it explains trusted metrics rather than computing new ones on the fly. A Paid Media Lead can ask what drove ROAS changes last week and get a clear answer when the tool’s analytics engine handles the calculation and the AI handles the explanation — not the other way around.
Setup and integration time per new client
Setup time covers source connection, permissions, and a baseline dashboard. An Operations Lead sees onboarding hours stack up across five concurrent account launches, then prioritizes tools with fast native integrations and templates that carry over without rebuilding logic each time.
The best option is the one that scales onboarding and client comprehension at the same time
Each tool below is assessed against the five agency criteria. Adjectives are not the test — what the tool lets an account team do, and what it makes them rebuild, is.
| Tool | Multi-client management | White-labeling | Client-facing usability | AI reporting assistance | Setup time per new client | Best for |
| Databox | Centralized agency account; isolated client workspaces; templates you can use across accounts; Client Performance view for all clients on one screen | Paid add-on; agency or per-client branding; custom domain; branded scheduled emails and login screens | Mobile app; office TV streaming; real-time bookmarked URL; Annotations let account teams add context clients read directly on the dashboard; Scheduled Snapshots keep clients oriented between calls | Genie (natural-language querying on governed metrics); AI summaries on Growth and Premium plans; MCP for external AI tools | Fast; 130+ native integrations; clone-and-reassign onboarding; guided and quick-start onboarding options available | Agencies reducing per-client commentary time and client Q&A after dashboards go live |
| AgencyAnalytics | Built for multi-client from the ground up; per-client workspaces; single-view account switching | Basic on Freelancer; full white-label from Agency plan ($239/month); custom domain and branded email sends | Strong; designed for non-technical clients | AI summaries and Ask AI; narrative insights on existing data | Fast; 80+ integrations; purpose-built for agency onboarding | Agencies whose primary bottleneck is onboarding new clients fast at a predictable per-client cost |
| Google Looker Studio | No native multi-client workspace structure; manual template reuse | Basic branding on free tier; Google watermarks remain; full branding requires workarounds | Good for Google-stack clients; degrades with multi-source complexity | None native; requires third-party tools | Fast for Google sources; non-Google sources need paid connectors ($20–$350/platform/month) | Small agencies running Google-only stacks who need basic client dashboards at no subscription cost |
| Power BI | Separate workspaces possible; requires manual structuring; no guided agency workflow | Not a native feature; requires custom embedding work | Variable; depends on report builder skill; steep for non-technical clients without guidance | Quick Insights, Key Influencers, Anomaly Detection; built for internal teams | Moderate; strong for Microsoft stacks; non-Microsoft sources add complexity | Agencies already inside Microsoft environments whose clients run on Azure, SharePoint, or Dynamics |
| Tableau | No native agency multi-client management; each client tends to require custom build | Possible via embedding; requires custom development | High visualization flexibility; complexity reflects build skill; not designed for client self-serve | Tableau Pulse and natural language features; designed for internal analysts | Slow per client; Creator licenses at $70/user/month; analyst involvement typically required | High-touch accounts requiring bespoke visualization where the agency has dedicated analyst support |
Databox
Databox gives agencies a centralized account that manages separate client accounts as isolated workspaces. An Agency Owner can onboard a new client by using a saved template, reassigning data sources, and setting permissions in a single session. Every client’s unique data auto-populates into the cloned template — the agency builds the reporting structure once and replicates it rather than rebuilding per client.
The Client Performance view puts all clients’ KPIs and goals on one screen, so a Head of Client Services can see which accounts are trending below target before the client notices and sends the first email about it.
White-labeling is available as a paid add-on covering custom domains, login screens, scheduled email reports, and dashboards. While white-labeling applies at the account level, dashboard-level branding—logos, background colors, and visual colors—can be customized per client. Most agencies add their own logo and customize the main dashboard cover in the client’s brand. The “Powered by Databox” logo can be removed from Databoards on paid plans above Agency Professional without the full white-label add-on.
Client-facing access goes beyond a shared link. Clients can view dashboards on their mobile phone via a public shareable URL, on an office wall TV via a streaming URL that updates in real time (set up by the agency), or through a bookmarked URL that always reflects current data. Note that clients on non-reseller accounts cannot log in directly—they access dashboards through shareable links rather than the app. An Account Director who wants a client oriented before the monthly call can send the streaming URL a week early. The client arrives already tracking the numbers rather than seeing them for the first time in the room.
Databoards can be looped together into a streaming presentation with a URL that updates dynamically. The agency prepares the presentation once and the data stays current every time the client opens it — no PowerPoint rebuilds before calls.
Annotations let account teams add observations directly to Databoards. A strategist who spots a CPL spike can annotate the chart with context — campaign change, budget shift, seasonality — so the client reads the explanation inside the dashboard rather than in a follow-up email.
Scheduled Snapshots automate the send. Databoards go out daily, weekly, or monthly at a specified time, so clients receive regular performance updates without the account team manually assembling and sending each one. Alerts notify the agency and the client when a metric crosses a threshold, which means the agency catches the ROAS drop or spend pace issue before it becomes the opening topic of the next call.
Genie supports natural-language questions against connected metrics, so an Account Director can ask “what drove CPL up last week?” and get an answer tied to the same data the client dashboard shows. AI summaries are available on Growth and Premium plans. MCP connects Databox metrics into external AI tools the team already uses — Claude, n8n, ChatGPT — while keeping computation inside Databox’s analytics layer rather than the language model.
Databox offers a 14-day free trial on the agency pricing page. A Solutions Partner Program supports agencies that want to position analytics as a billable service, including co-marketing, a partner directory listing, and agency certifications.
AgencyAnalytics
AgencyAnalytics is built for marketing agencies specifically, and multi-client management is its clearest strength. Each client gets its own workspace, and the platform is designed around the assumption that an agency manages many of them simultaneously. An Account Director can switch between client accounts from a single dashboard view without logging in and out.
White-labeling is available on all plans at a basic level, with full white-label capabilities including custom domains and branded email sends starting on the Agency plan at $239 per month. Agencies that want to apply separate branding per client can do so on select plans. The Freelancer plan at $79 per month includes basic branding but locks full white-label features behind higher tiers.
Pricing scales per client. The base Agency plan covers 10 clients at $239 per month, with additional clients billed at $20 per client per month beyond the included count. An agency managing 20 clients on the Agency plan pays roughly $439 per month. That per-client cost structure works well for smaller rosters and becomes a meaningful line item as the client base grows.
AI summaries and the Ask AI feature are available to surface narrative insights and answer questions about client performance. The platform covers 80+ integrations and includes SEO tools, rank tracking, and audits alongside standard PPC and social reporting.
The clearest trade-off versus Databox sits in the client experience layer. AgencyAnalytics has no equivalent to Scheduled Snapshots that auto-send to clients, no Annotations for in-dashboard context, no streaming TV URL for office display, and no natural-language querying against governed metrics. The AI helps explain existing dashboards — it does not reduce the volume of questions clients send between reporting cycles.
Google Looker Studio
Looker Studio removes the cost barrier entirely, which makes it a reasonable starting point for agencies or clients who run primarily on Google’s marketing stack. An Account Director can connect GA4, Google Ads, and Search Console, build a template dashboard, and share it with a client the same day.
Basic white-labeling is available on the free tier: agencies can add their logo, match brand colors, and remove some Google branding from shared reports. Google watermarks and privacy policy links remain in certain views, and scheduled email reports cannot be fully branded on the free version. Looker Studio Pro at $9 per user per month adds organizational ownership, better permissions management, and up to 200 scheduled report deliveries.
The agency cost at scale is less visible in the subscription line and more visible in time and connector fees. Non-Google sources require third-party connectors that typically run $20 to $350 per platform per month. At 15 or more clients using varied stacks, connector costs and maintenance time stack up. An Operations Lead who benchmarks total cost of ownership, including connector fees and hours spent troubleshooting source breaks, often finds the “free” label misleading past a certain client volume.
Looker Studio has no native AI narrative or natural-language querying. There are no automated sends, no threshold alerts, no in-dashboard annotations, and no client TV streaming. Client-facing usability is good for Google-native dashboards and requires more customization work for multi-source views.
Power BI
Power BI fits agencies that already operate inside Microsoft environments, specifically those where clients use Azure, SharePoint, or Dynamics, and where the agency’s own team has familiarity with DAX and Power Query. An analyst can build sophisticated calculated fields and model complex data relationships faster than in most alternatives.
White-labeling is not a native feature. Power BI was built for internal analytics, and client-facing branding options are limited without custom embedding work. An Agency Owner who needs branded, shareable dashboards will typically need to invest in embedded analytics or a wrapper tool, which adds both cost and technical overhead.
Multi-client management requires deliberate workspace structuring. Power BI supports separate workspaces and row-level security, but setting those up consistently across clients is not a guided, templated process. Pro licenses are $14 per user per month as of April 2025.
Client-facing usability tends to reflect the skill of whoever built the report. A non-technical client navigating a Power BI dashboard built by an analyst can struggle with navigation and filter logic. An Account Director should test whether a client can answer a routine question — channel spend versus conversions last month — without a walkthrough before committing.
Tableau
Tableau gives agencies that need advanced visualization flexibility and have the team to support it a strong option for complex, bespoke client work. An analyst can build interactive dashboards with a level of visual customization that other tools in this comparison do not match.
The agency cost sits in per-client repeatability. Tableau Creator licenses run $70 per user per month, and complex implementations tend to require analyst involvement for each new client’s data model. An Agency Owner treating Tableau as the primary reporting tool for all clients will find the onboarding hours, the per-user cost, and the maintenance work combine into a margin pressure that scales with client count rather than against it.
White-labeling for client-facing delivery is possible but requires embedding or additional customization. Tableau was not designed as a client reporting platform, and agencies typically use it for high-touch accounts where visualization complexity justifies the overhead.
AI capabilities have expanded through Tableau Pulse and natural language features, but these are designed for internal analytics teams rather than reducing the time an account team spends explaining performance to a client.
Conclusion
A clean selection process: run a trial with one real client, rebuild last month’s reporting inside the tool using the same sources, and stress-test one metric dispute — “what counts as a lead?” or “which revenue number is authoritative?” — then count how many minutes it takes to resolve it without spreadsheet work.
A tool earns “best” when it reduces non-billable reporting hours per client without increasing client support requests. An Account Director can track reporting hours for the month, count follow-up questions after dashboards go out, then decide which tool actually creates client self-service rather than just claiming it.
The decision comes down to where your agency bleeds time. If the bottleneck sits in the hours your team spends each month explaining what the numbers mean, answering client questions the dashboard should have answered, and writing commentary that says the same thing twelve different ways for twelve different clients, that is where Databox separates from the field. Scheduled Snapshots eliminate the manual send. Annotations put the context inside the dashboard rather than in a follow-up email. The streaming TV URL and mobile access mean clients arrive at reporting calls already oriented rather than seeing the data for the first time in the room. Genie handles the question the client would have emailed about. Data Story handles the narrative your strategist would have spent two hours writing. An agency that has already solved the onboarding problem but still finds reporting expanding with headcount rather than shrinking with it is the agency this feature set was built for.
“With real-time access to performance, our team is able to identify trends and make adjustments quickly, our clients are more engaged in the performance discussion, can see the value we’re creating, and buy in to our data-driven recommendations. Databox also saves us hours reporting every month.”
Frequently Asked Questions
How do I know if a self-service analytics tool will actually reduce non-billable reporting time?
Test it with one real client before committing. Connect the top sources, rebuild last month’s deliverables, and count how many steps required specialist help. If the agency still needs an analyst to fix joins, write commentary, or reconcile numbers across platforms, the tool shifted work rather than removed it. The right benchmark is non-billable reporting hours per client in month one of the trial versus month two.
Which of these tools is built specifically for agencies rather than internal teams?
AgencyAnalytics is the only tool in this comparison built exclusively for agencies, which shows in its multi-client workspace structure and per-client pricing. Databox serves both agencies and internal teams but offers a dedicated agency account structure, a Solutions Partner Program, and agency-specific pricing. Looker Studio, Power BI, and Tableau were built for internal analytics and require additional configuration to work in a client-facing reporting context.
At what client volume does the free Looker Studio tier stop making financial sense?
Looker Studio’s cost advantage erodes when an agency manages clients with non-Google data sources. Each non-Google platform requires a paid third-party connector running $20 to $350 per platform per month. An agency managing 15 clients across mixed stacks — Google Ads, Meta, HubSpot, and a CRM — will spend more on connectors alone than on a purpose-built agency reporting tool, before accounting for the time spent maintaining those connections.
Can a non-technical client self-serve on any of these tools without training?
Realistically, only on tools where client-facing usability was a design priority. Databox and AgencyAnalytics both optimize for non-technical client access. Databox goes further with mobile access, office TV streaming, in-dashboard Annotations, and Scheduled Snapshots that keep clients oriented between calls. Looker Studio works well for clients familiar with Google products. Power BI and Tableau client-facing usability depends heavily on how the report was built — a well-built dashboard can be navigable, a poorly built one requires a walkthrough regardless of the tool.
What is the real cost difference between AgencyAnalytics and Databox for a 20-client agency?
AgencyAnalytics on the Agency plan covers 10 clients at $239 per month, with additional clients at $20 per month each. At 20 clients that is approximately $439 per month. Databox agency pricing depends on the plan tier and number of data sources. The meaningful comparison is not subscription cost alone — it is subscription cost plus connector fees plus time spent on per-client setup and ongoing maintenance. An agency should run both trials against the same client dataset and measure total time to ship a baseline dashboard before comparing price tags.
How should an agency evaluate AI reporting features before buying?
Ask one question: does the AI answer questions by querying your actual metrics, or does it summarise dashboards someone already built? The first reduces the client emails that arrive between reporting cycles. The second reduces reading time. Databox’s Genie queries governed metrics in plain language and returns answers tied to the same data the client dashboard shows. AgencyAnalytics AI helps explain existing dashboard data. Looker Studio, Power BI, and Tableau do not offer equivalent client-facing conversational querying without additional tooling.
Does Databox send automated reports to clients, or does the agency still need to do that manually?
/Databox sends automated reports through Scheduled Snapshots — Databoards go out daily, weekly, or monthly at a specified time without manual intervention. Alerts fire automatically when a metric crosses a threshold, so the agency surfaces the ROAS drop or spend pacing issue before the client notices it independently. Both features are available on paid plans and reduce the per-client reporting overhead that scales with client count.


