


Table of contents
It’s no secret that we live in a data-driven world, and that businesses of all shapes and sizes are trying to use data to measure and inform their strategy.
However, what remains somewhat of a mystery to most is how to successfully gather, manipulate, and analyze the data that results in true full funnel reporting and helps drive decisions in an efficient, accurate, and quick manner.
But, it’s not really a mystery anymore. With new services and technology, it’s possible for every business to achieve “reporting nirvana” with less effort and expense than ever before.
Just follow these four simple steps:

1. Focus on Key Metrics That Matter For Your Business
The biggest mistake that executives and sales leaders make is to try to report on everything. With so much data available these days, business leaders often try to consume everything. But, not every metrics is as important as the next. Looking at everything leads to wasted time and effort.
Instead, focus first on what is most important for your company’s marketing and sales success when using your executive dashboard software.
High level numbers might include lead and deal volume, pipeline or forecast size, sales figures, or cost-per and profit-per metrics. Remember, if everything is important, then nothing is! Here’s an example of a high level report we often customize for each of our clients:
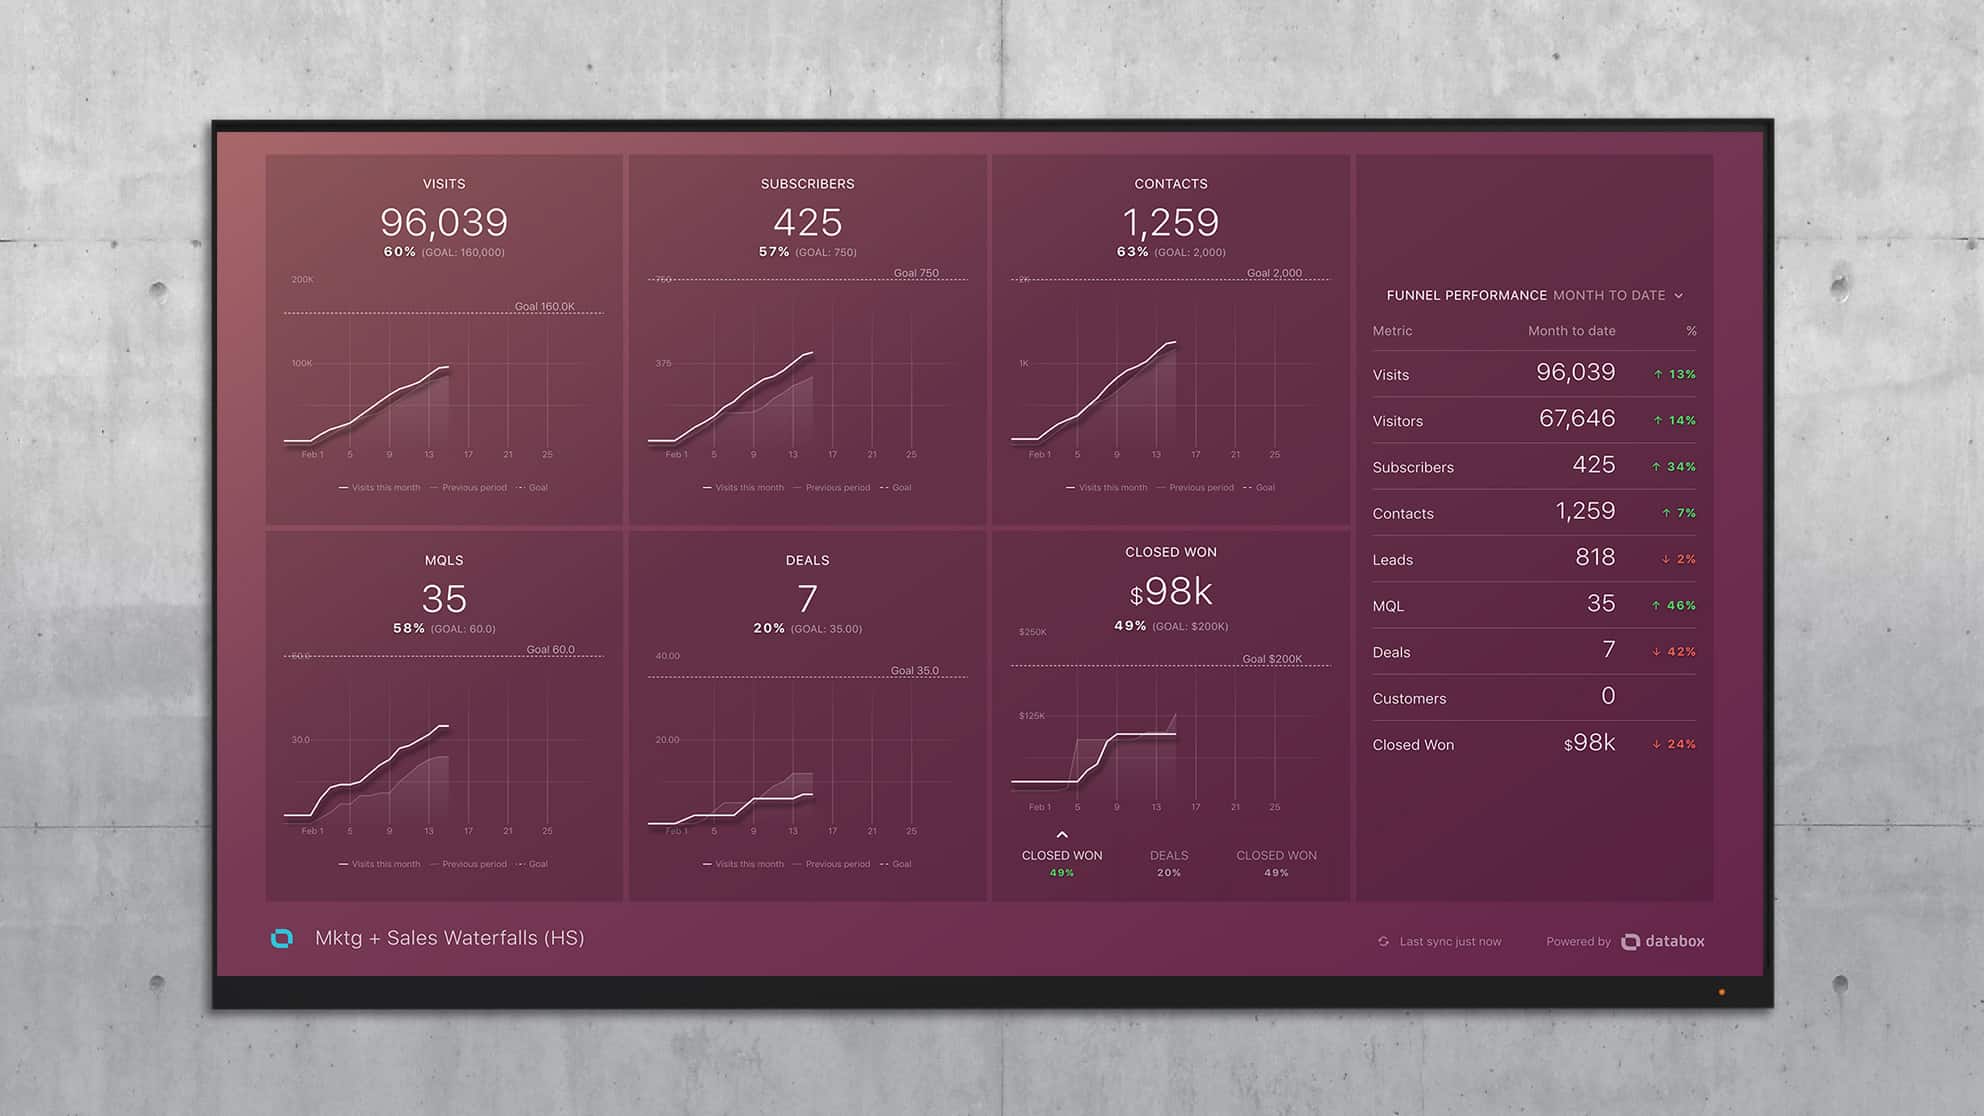
Busy executives should determine what metrics are most important for their business and then monitor them religiously.
2. Pull Data from Multiple Sources and Aggregate It Into One Place
Once you determine what your organization’s key metrics are, it’s time to figure out how to gather, manipulate, and analyze them in the simplest manner possible. To do this, you will need to pull data from a variety of sales and marketing data sources such as Google Analytics, HubSpot, Mixpanel, Salesforce, Facebook Ads, Google Sheets, and many others, into one centralized sales and marketing dashboard.
Combining multiple data sources in one report will help track key metrics more efficiently, removing the hassle of exporting data into spreadsheets, using lookups and pivots, and forcing data into a somewhat understandable chart or graph.
Multi-source aggregation is even more valuable when you can seamlessly conduct calculations across the different sources. Using a reporting platform, like Databox, you can easily create calculations across multiple different data sources. For example, if one of your key metrics is Cost Per Lead, you can automatically calculate it using spend data from AdWords and lead data from your CRM. Below is an example of simple visit to lead conversion rate calculation, built inside Databox.
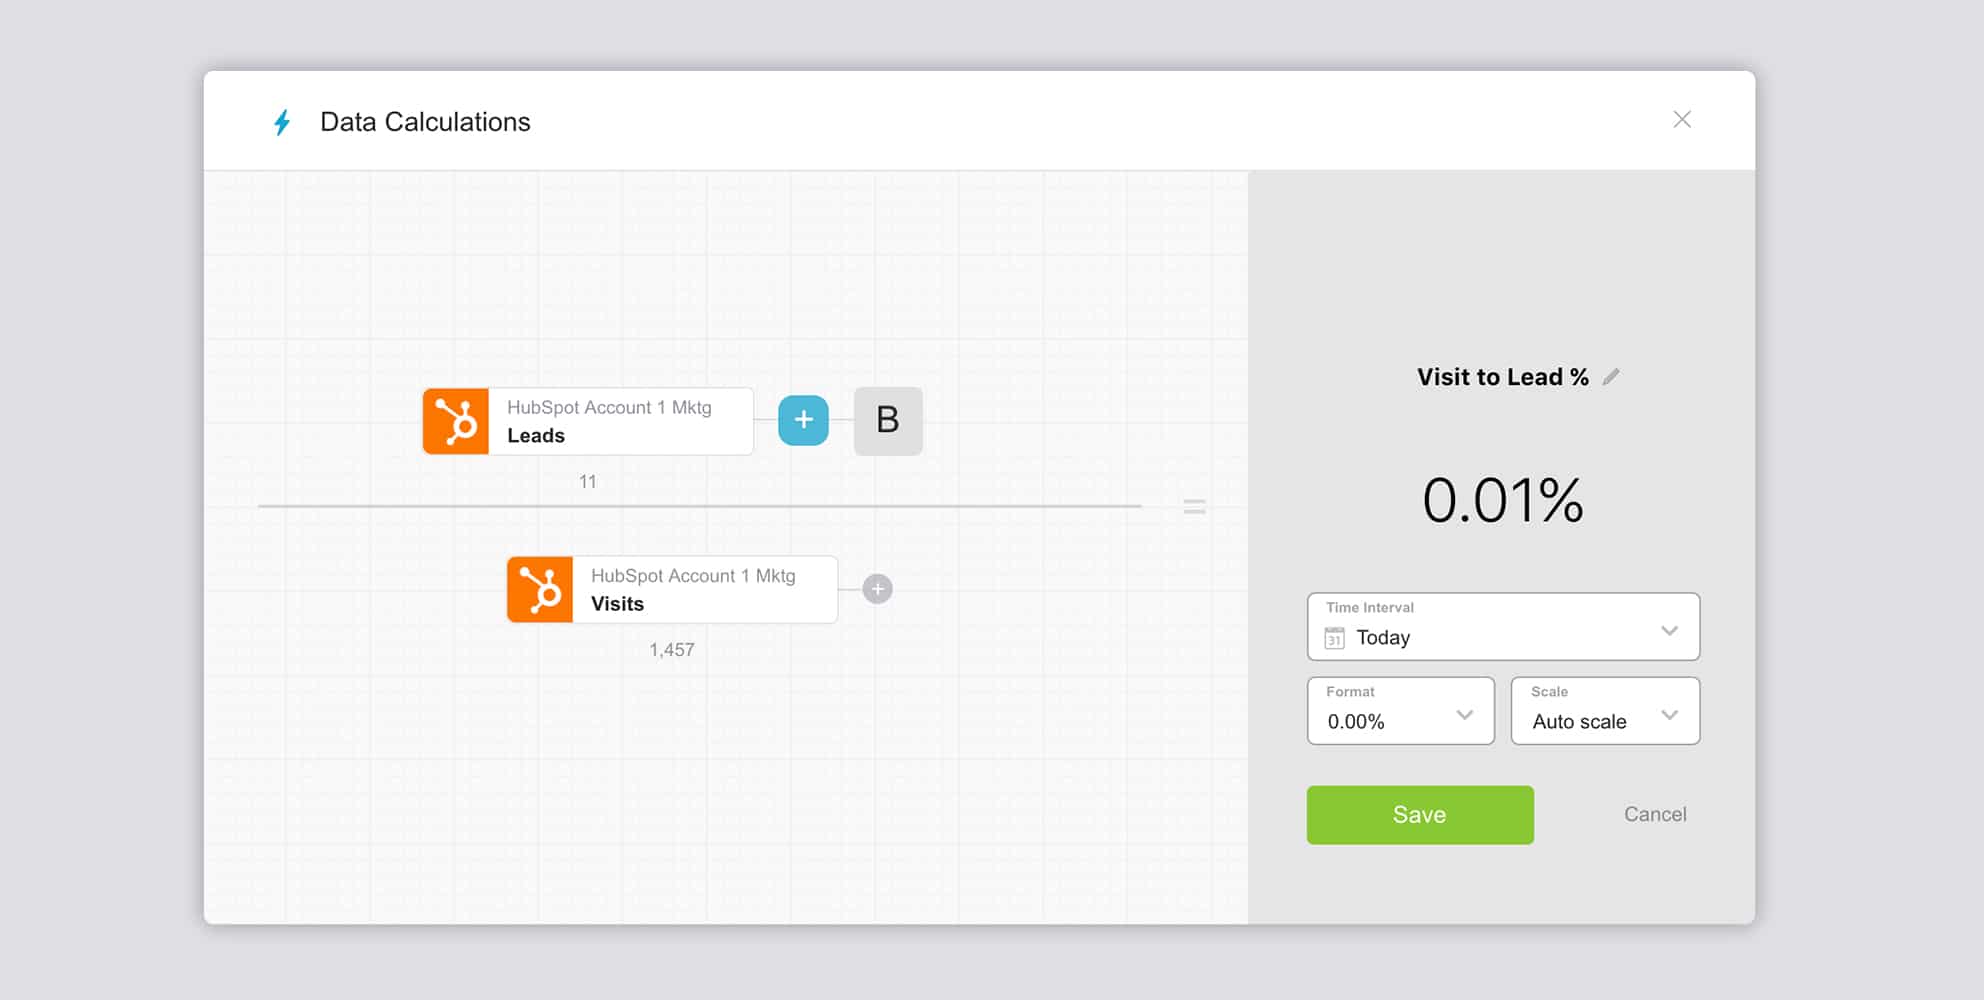
Editors note: Calculations are a beta feature.
3. Make Your Data Available to All Stakeholders
If identifying key metrics and combining multiple data sources on your in your sales dashboard software are the core steps in the creation of full funnel reporting, then proper distribution is the key for success of the reporting process.
Distribution starts with making it available to your stakeholders. This could include directors, employees, and in FullFunnel’s case, our customers too.
However, creating a data-driven culture requires transparency that most organizations lack. Often, business leaders keep core data close to their chests, keeping stakeholders in the dark about what’s really happening. This is often problematic as “you can’t manage a secret,” and without transparency into key metrics, you are in fact creating management barriers.
To build transparency, consider building a real-time distribution plan of key metrics to key stakeholders. Distribution can include the following:
- Sales funnel dashboards displayed on TVs throughout the office
- Daily email notifications
- Slack channels that push (or allow users to pull) key datapoints
- Daily push notifications to mobile phones
At FullFunnel, we take takes advantage of two key Databox features to provide transparency to both internal and external stakeholders. The FullFunnel offices are equipped with TVs that loop Datawalls with our clients’ performance data displayed for the entire team to see. This leads to extra scrutiny from multiple team members. This enables us to identify trends and spot issues and opportunities, ultimately driving collaboration in the pursuit of improved client results.
PRO TIP: How to Keep Track of Your Sales Team’s Performance
Sales happen every day, and if you have an active sales team, they’re busy setting up appointments, making calls, creating and nurturing deals, and closing them to generate new revenue. It’s your job to monitor their performance and work with your team to improve it. To do that, you need up-to-the-minute information at your fingertips, including:
- What’s our average deal size?
- How many open, closed, and lost deals have we seen this month?
- How much revenue can we expect to close from new deals created?
- What’s our current progress towards our sales goals?
Now you can benefit from the experience of our sales experts, who have put together a great Databox template showing all the most important KPIs for your sales team’s performance. It’s simple to implement and start using as a standalone dashboard or in sales reports!

You can easily set it up in just a few clicks – no coding required.
To set up this Sales Manager KPIs Dashboard, follow these 3 simple steps:
Step 1: Get the template
Step 2: Connect your HubSpot account with Databox.
Step 3: Watch your dashboard populate in seconds.
Editor’s note: Did you know that any Databox dashboard can be displayed on your smart TV? Broadcast your TV Dashboards for free now.
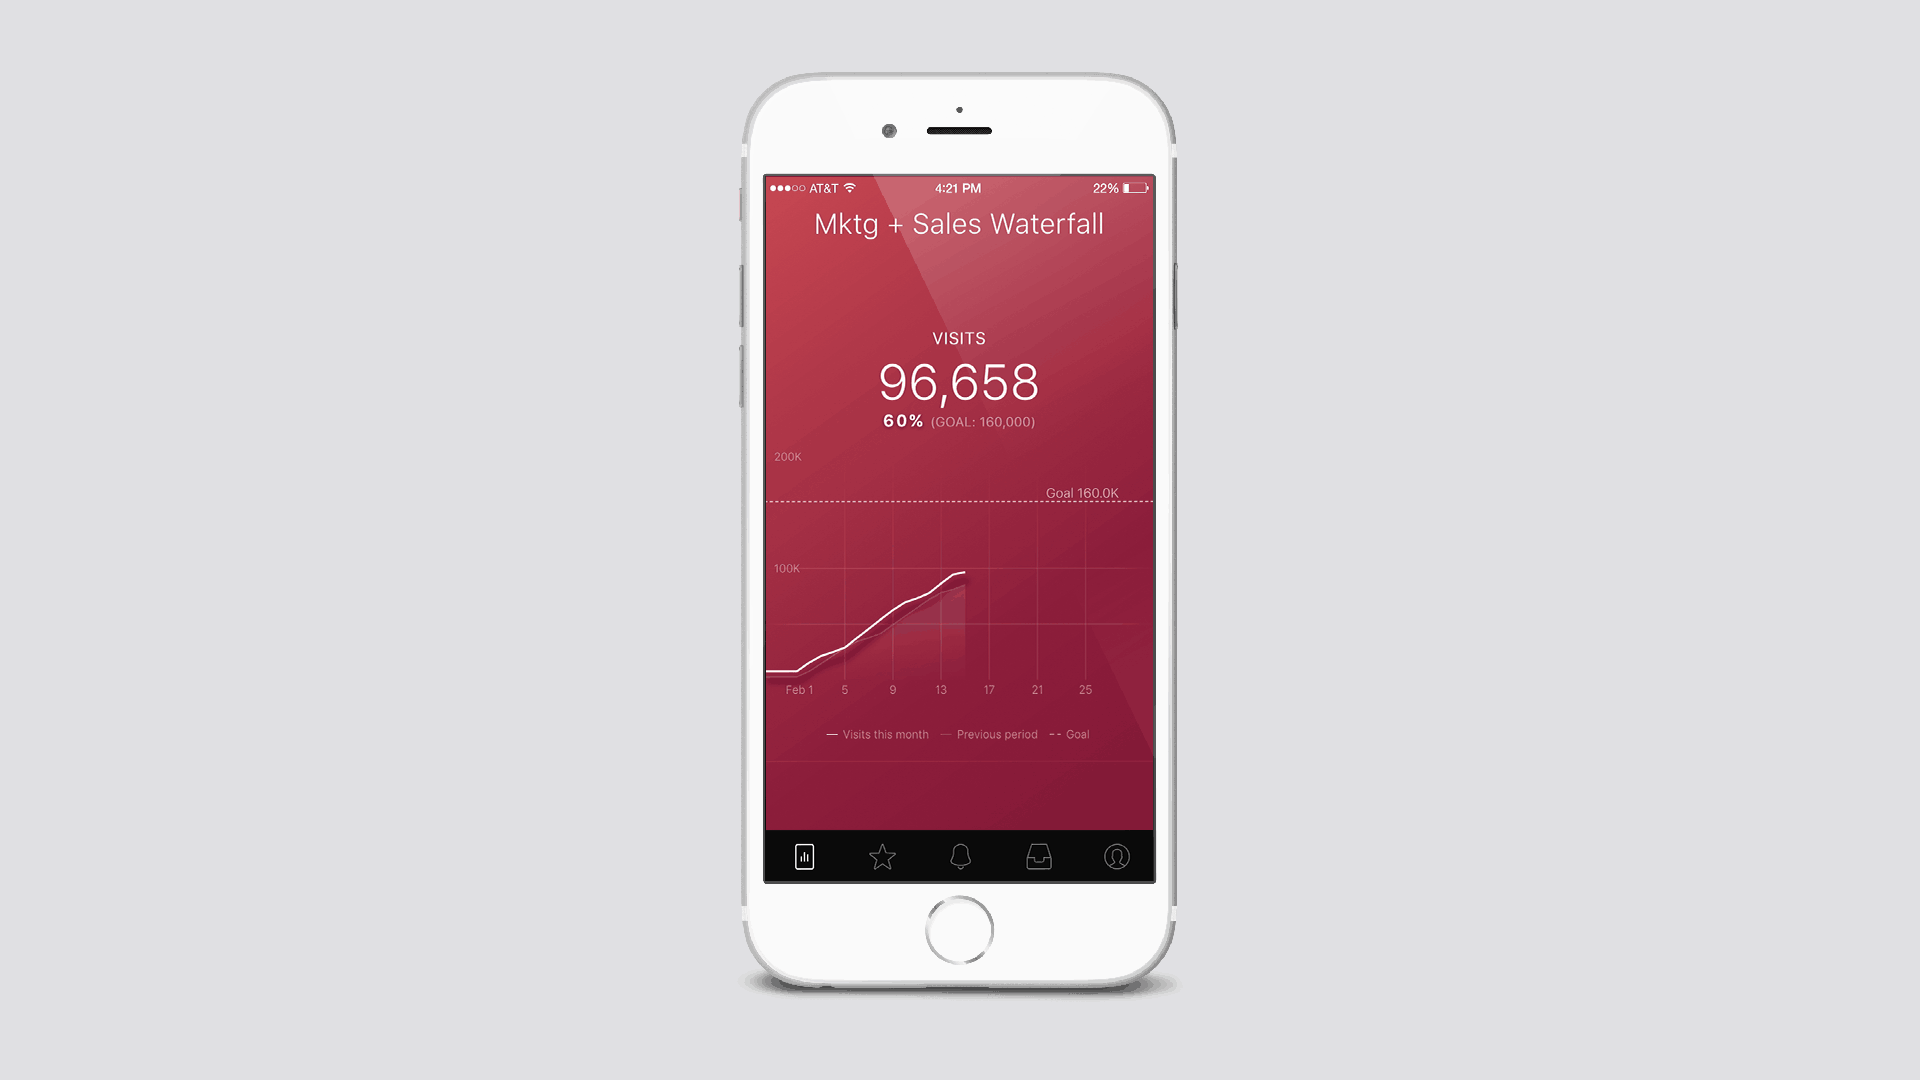
For our external stakeholders (ie our clients), we recommend they download the Databox mobile app so they can receive daily updates on their mobile phone. The custom Datacards that we build for them are quick to view and easy to understand, but show them they’re getting an ROI and achieving their goals. Alerts we set up notify them proactively about issues we’re seeing and successes we should celebrate together. This transparency ensures that we are always on the same page as our clients and helps to drive efficiency in our meetings. It also eliminates a lot of manual work most agencies do, allowing us to put that time towards driving better results.
4. Customize Your Reports to Match the Needs of Your Business
Most companies of a certain size hire an analyst to implement a process like I’ve described above. Analysts constantly monitor, organize, and analyze data in real-time using tools like sales dashboards. Analysts allow organizations to make data-backed decisions at all stages of the sales funnel. They help determine the impact of marketing campaigns, educate sales staff on using data to time and initiate sales conversations and report progress to goals. They are worth their weight in future revenue.
But, for businesses who can’t afford to hire a full time analyst, achieving “reporting nirvana” has been difficult. Don’t fret, though, if you don’t have an army of data scientists. With the right tools and a bit of outside help, you can get real-time, full-funnel reporting too.
Every business is a bit different, though. And therefore, requires a bit of customization. Just don’t start from scratch. Don’t make it up as you go along. Instead, consider hiring a company that has done it a few times. Any good sales and marketing firm will have report templates to get you started and will know when to customize your reports too. They’ll be able to assess your processes and systems as well as your reporting. They’ll be able advise you on best practices given your business, industry, sales structure, go-to-market model as well as other things that make you unique. If this is a priority for you, don’t hesitate to ask for our help.
Full Funnel Reporting Leads to Better Results
At FullFunnel, we’re big believers in full funnel reporting. It’s kinda in our name.
Based on our combined decades of experience helping companies with both their sales and marketing, we believe the full funnel approach is the only way to do sales or marketing. We know it works. Take, for example, how Bullet Solutions increased sales qualified leads by 200% in just two months or how an aligned sales and marketing strategy helped Klick Push land clients like Live Nation, Zappos and AT&T.
Whatever you do, don’t wait to get started. You can’t improve what you aren’t measuring.
Identify the data that’s important for your business, pull it into your executive dashboard, make it available to all stakeholders and customize it to your needs as time goes on.


