


Table of contents
We get it, you’re busy.
Sometimes, that means you miss things.
Sometimes, the solution to our problems is right in front of us, but due to our fast-paced lives, everyday stress, and overall busy schedules, we miss it.
Luckily, we have some time and resources to help, specifically when it comes to mastering Databox.
That’s why we decided to make up a list of Databox’s 10 “hidden gems” that you might have missed in your journey to get your data connected and visualized correctly.
These are features that allow you to make your performance data more accessible and insightful so you and your team can focus on what matters most.
So, let’s dive into Databox’s secret treasure chest.
1. Stream Dashboards on Your Smart TV
Want to motivate your team and make sure they’re always up-to-date on their progress? Make performance more accessible to your team by making it more visible.
Sharing your performance data with everyone has never been easier, with Databox’s Stream to TV feature.
It enables you to ensure everyone on your team is always aware of how performance is trending.
And the best part? It’s done in seconds.
How Can I Start Streaming?
Start by opening the browser on your Smart TV and visit tv.databox.com. There, you’ll receive a short 4-digit code.
Next, navigate to the Databoards page in your Databox account on your computer, click on the Share icon on your selected Databoard and type the 4-digit code in the Stream to TV folder.
And just like that, you’re sharing your dashboards with everyone in the office, or just keeping that data in sight in your home office, while you’re busy rocking your performance.
Here’s a quick walk-through of how it works.
2. Create Reports Once & Use Them Anytime with Account Templates
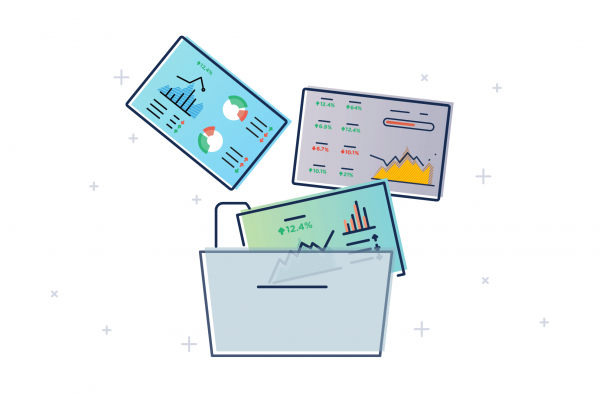
How many reports do you need to prepare every month? How many of those are repetitive or just similar to one another?
Imagine you only had to create reports once and could easily replicate them anytime and even across multiple client accounts (as many as you needed).
Design your own templates, complete with the data sources, metrics and visualizations that you need, that are 100% customizable at the same time.
Use them whenever you need them and create as many as you’d like – they don’t count toward the Databoard limit of your current plan.
How Do I Create & Use My Account Templates?
To get started, navigate to Databoards in your Account. You can either create a “New databoard” or “Edit” an existing one, in order to save it as a template. Save your databoard as a template by clicking “Save as Template” at the top of the dashboard.
Another way to create a template is by hovering over the databoard on your databoards page, clicking “More” and choosing the “Save as Template” option.
You can also create a template by navigating to “Account Templates” and clicking on the “Create a Template” button. Just choose one of your pre-made databoards that your would like to save as a template.
Once you mark/save your databoard as a template, it will automatically become available in “Account templates” in your account and each of your clients’ accounts (if you’re on an agency plan).
You can make changes to the template without affecting the original databoard that you created.
Here’s a quick walk-through of how it works.
3. Share Only Your Data, Not Editing Access

When it comes to data, it’s important that it’s clear and easy to understand. And while some people on your team need access to your performance data, not everyone needs to create their own reports or even edit what you’ve built.
To avoid that extra noise in your account and make sure everything stays organized, you can add “view-only” users to your Databox account.
That way you can share your performance without allowing them to add or make any changes.
How Do I Add Viewers to My Account?
To add a view-only user to your Databox account, navigate to “User Management” in your account and click the “New User” button.
Type in the person’s name, email, and select the “Viewer” role. They’ll receive an email notification that they’ve been added.
After that, you can select the specific Databoards a view-only user has access to.
To edit access to a specific Databoard, hover over the Databoard, click on the “More” button and “User access”. Here, you can select which Users have access to the Databoard.
Here’s a quick walk-through of how it works.
4. Share Important Performance Updates via Slack Messages
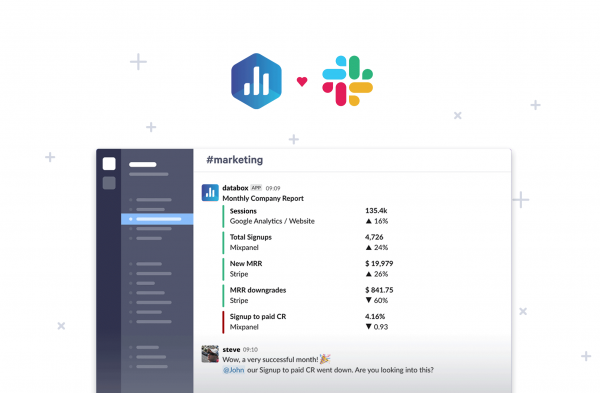
Imagine eliminating Slack messages asking for about performance updates on campaigns and projects altogether and never again having to worry about manually keeping your entire team in the loop and on top of the data.
With Databox, that’s easily achievable.
Automate daily, weekly, monthly or quarterly Scorecards and Scheduled Snapshots to any public Slack channel.
While you’re at it, you can add the Alerts to be sent there too.
This Databox feature ensures your entire team is aware of all the key metrics that are driving your business, while also having more eyes on the data, increasing your chances of spotting any important trends.
How Do I Automate My Notifications in Slack?
Whether you would like to send a Scorecard, Snapshot, or Alert to Slack, the process is more or less the same.
Navigate to “Notifications” and once you create the desired notification, choose the Slack channels you’d like it to be sent to in its delivery options.
Every Notification that you automate in Slack is also visible under Notifications on your Slack landing Page in Databox.
Here, you’ll find all the Scheduled Snapshots, Scorecards, and Alerts scheduled in Slack, and can also edit them or create new ones from scratch, by clicking on “New Slack Notification” button on the upper right screen corner.
Here’s a walk-through of how it works with Scorecards and Alerts…
And here’s how it works with Scheduled Snapshots.
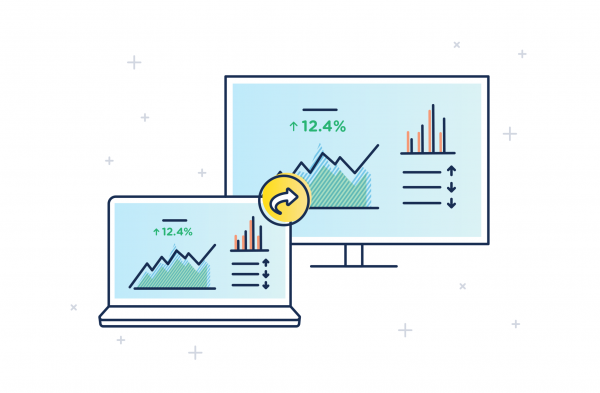
5. Present Live Views of ALL Your Data
It’s hard to imagine having all of the data you need to run your business on just one dashboard.
Well, with Databox, that’s easily achievable, too. By using looped databoards you can string together a series of databoards to visualize all the data you find important to present.
These looped databoards can replace the presentation slides on your meetings, and with the option to set a time interval, you can keep your whole team in the loop as they automatically scroll through data streaming on your office TV.
How Can I Loop Databoards?
With just a couple of clicks, you’re able to show everyone your full performance.
Simply navigate to “Databoards”, and hover over the dashboard you’d like to be first in the loop.
There you click on the “Share” button and under “Looped Databoards” click on “Add Databoards” and select which dashboards you’d like to include.
At the bottom, set a time interval in which you’d like your dashboard to be looped.
Click on Additional Settings if you’d like to firther secure your Databoard(s) with a password or set limitations.
Then just copy the link and share it with your colleagues, management, clients, etc.
6. Connect & Track Even More Data With 3rd Party Automations
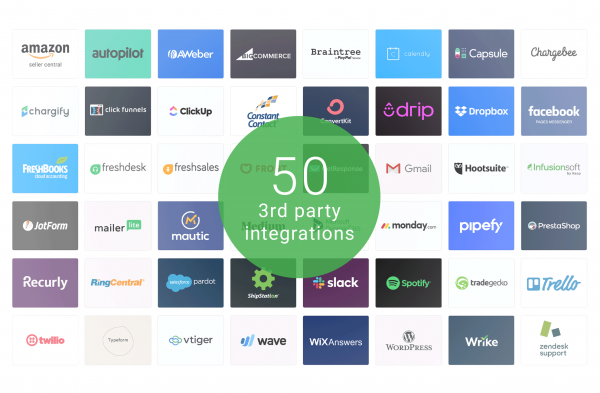
While we already have 100+ native integrations that you can connect with Databox, we also wanted you to have the option to connect data from any other tool you might be using.
Here’s where Zapier and Integromat come into play.
While they’re both native Databox integrations, they also open the door to so much more, as their universal data connectors bridge the gap between Databox and hundreds of other products.
We built out 250+ Zapier & Integromat automations that allow you to pull data from a bunch of tools, that we don’t (yet) integrate with.
How Can I Connect my Data Through Zapier or Integromat?
If you prefer to use Zapier, you can navigate to Zapier templates and search for the integration you’d like to use. You can also read more on how to use Zapier with Databox here.
Or, if you’d like to use Integromat, navigate to the built out Integromat-Databox automations. Read more about how to use Integromat with Databox here.
No matter whether you plan to use Zapier or Integromat, you can use already created templates and customize them based on your needs.
7. Use Query Builder to Explore & Build More Metrics
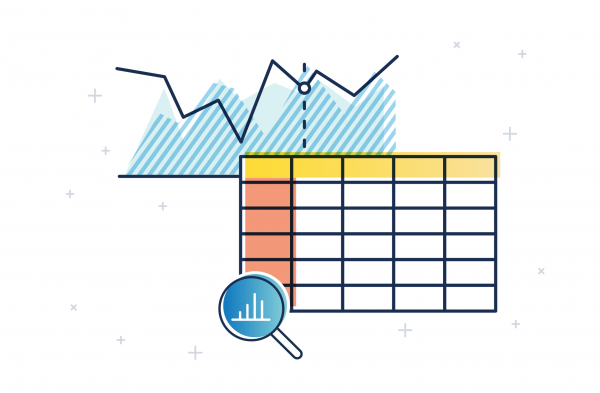
3000+ basic metrics sounds a lot. But it’s still not enough.
Even though we wen’t through a number of different scenarios when building them, we still couldn’t cover all your needs. But with Query Builder, we’ve come pretty close.
Query Builder is an advanced functionality built within the Databox app, that helps you pull in custom object and unique metrics.
Need to report on specific blogs? Or access custom HubSpot properties? Or to create a dashboard containing custom conversions from Facebook ads?
Query Builder has got you covered.
Hard to use? No. Maximum flexibility and minimum effort? Yes. And the best part? No coding required.
How Do I Build Custom Metrics?
Navigate to “Metrics” in you Databox account and then click on “Query Builder”.
In the upper right screen corner click on the “New Custom Metric” button and start building your custom metrics.
Select the “Data Source” and add metrics and dimensions to it. You can preview the data to see the results before adding the metric to the databoard, to make sure everything in your custom metric is working correctly.
Once you click “Save”, you can add the metric to an existing or a completely new dashboard.
You can also add and create the custom metric directly in the dashboard. Open the selected Databoard or create a new one.
Drag and drop a blank Datablock onto the Databoard from the Metric Library and then select the appropriate Data Source in the righthand property manager.
Make sure that the Data Source selected here is the same one you used when creating the custom metric.
Select the custom tab at the top of the Metric drop-down list and then select the Custom Metric name. Then all that’s left for you to do is watch how your data populates the block in a matter of seconds.
8. Calculate Important KPIs From Different Data Sources
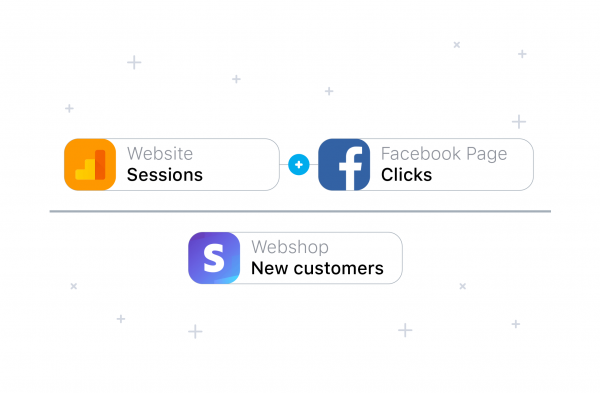
Do you use multiple payment providers? Or different systems for tracking website engagement? Need to calculate conversion rates?
With Data Calculations you can aggregate metrics from multiple data sources, calculate different ratios, ROI and other financial metrics, track then over time and more.
You can put your spreadsheets aside and use Databox’s Data calculations to add, subtract, divide and even multiply your data from any data source you need.
Data Calculations help you draw correlations between different aspects of your business and get a complete picture of your sales, marketing and overall business performance.
How Can I Calculate My KPIs?
Navigate to “Metrics” and then to “Data Calculations”.
Name your Calculated Metric and then click on the variable “A” to open the first metric selection window. Add the Data Source and the metric or set a fixed value.
Click on the blue + to add, subtract, multiply or divide the “B” variable. Then click on the B variable to add data for it, again either select the Data Source and the metric or set a fixed value.
Simply repeat the steps with every value until your calculation is complete. Click “Save” and add the metrics to an existing or to a new Databoard.
As with Custom Metrics, you can add Calculated metrics directly to the dashboard when you’re creating it.
Drag and drop a blank Databoard Datablock onto the Databoards from the Metric library and then select the same Data Source or one of the Data Sources you used in the Data Calculation in the righthand property manager.
Select calculated tab at the top of the Metric drop-down list and then select the Custom Metric name. Watch as you data populates the block.
9. Home, Sweet Home Screen
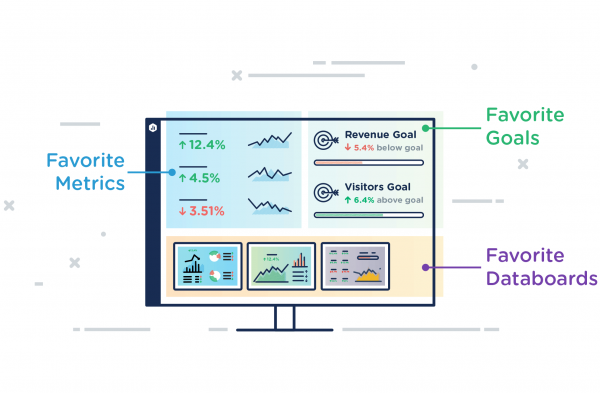
Home screen is the first thing you see when you sign in to Databox. And when used properly, it can serve as an instant signpost to which data you should prioritize and check first without having to open up any dashboards, looking into goals or checking specific metrics.
Since it’s completely customizable, it’s up to you what your Home Screen will show.
Working in Sales? View your deals created, closed and closed amount upon logging in.
Are you a marketer? Check your traffic and leads as soon as you open up Databox.
Alongside your favorite metrics and goals, your favorite databoards are just a click away – accessible on your Home Screen.
How Can I Customize My Home Screen?
Under “Metrics and Goals” you’ll find a button where you can add a favorite item. By clicking on it, a pop-up window appears where you can either select any of the metrics available or goals created.
You can also navigate to the metric screen or metric library and add favorite a metric there. It will be automatically added to the Home Screen. The process is the same with navigating to the Goals and Dashboards and choosing them as favorites.
10. No More Searching For Performance Updates

Have full visibility with regular notifications, identify your trends quicker and make performance data a part of your routine.
By setting up notifications to be automatically sent to you every day, week, month or quarter you make sure you and your team are always up to date and can identify all the wins and losses as they happen, prioritize your work and make adjustments when they matter most.
Don’t wait until the end of the month to know how your performance is trending. Get notified regularly.
Set up Scorecards to stay updated on your most important KPIs.
Schedule Snapshots to show all the correlations in your data on your dashboards. Make sure your performance is on track with Alerts.
All the notifications can be sent directly to you, either via email, mobile push notifications, insights stream or Slack. Stay updated wherever and whenever.
How Do I Automate My Notifications
Navigate to “Notifications” and select which type of notifications you’d like to receive. Select the metrics you’d like to include in each one and to whom and when it should be sent.
You can read more about how to set each of the notifications here. Then all that’s left for you to do is to stay on top of your data.
So, we opened our treasure chest and shared with you 10 Databox hidden gems. But we don’t plan to stop here. Do you have any improvement ideas or feature requests? By checking out our interactive product roadmap you can request, upvote, or simply stay upated on all our product updates.
Ready to start using all of the features in your Databox account? Sign in and start exploring.
New to Databox? Create your free account to get started.


