


Table of contents
A startup KPI dashboard is an excellent way to see all essential metrics grouped on one screen.
Not only does this allow you to get a quick overview of your business’s health, but it also means you can study the data easily to identify areas for improvement.
However, creating one too many dashboards can easily dilute your focus. In fact, it can quickly lead to missing important data points. So what are some examples of dashboards you need for measuring key startup KPIs?
To answer that, we talked to 40 respondents and put together a proven list of 7 startup KPI dashboards. Here’s what you’ll learn today:
- What Is a Startup KPI Dashboard?
- Most Important KPIs and Metrics to Include in a Startup KPI Dashboard
- 7 Startup KPI Dashboard Examples That Are Core to Healthy Business Growth

Let’s get started.
What Is a Startup KPI Dashboard?
A startup KPI dashboard is a dashboard that showcases a startup’s efficiency and growth metrics in real-time.
The metrics that the dashboard displays are unique to each startup’s growth stage and business objectives as you’ll learn in the next section.
Irrespective of the metrics though, a startup KPI dashboard is uber important for tracking performance.
“Keeping a KPI dashboard to check the progress is essential for companies like us,” agrees Rajat Chauhan from Ace Infoway Pvt. Ltd. “It helps us maintain the growth cycles and processes up-to-date and guide us on how a startup is performing against the pre-defined key performance indicators (KPIs).”
“It is a fast, easy, and centralized solution to check and track the growth metrics of any startup. It helps our teams to understand which area to focus on and keep them aligned with different departments i.e. our marketing team can parallell work with development teams, and sometimes both the work can carry out simultaneously, and successfully.”
Chauhan explains, “For us at Ace Infoway, the KPI dashboard is the ultimate centralized tool to track different teams and tasks and keep them aligned together. It helps us save a lot of time, money, and resources.”
In fact, all startups that we talked about are using dashboards. About 40% are using specialized dashboard software (like Databox) and 60% are using several dashboard reporting tools.

Of these startups, almost 70% we surveyed are in the growth stage. About 20% are in the early stage and shy of 10% are in the late stage.
In terms of the startup vertical, about half of the startups we surveyed identified themselves as small business startups. A bit over 20% are scalable startups with the remaining 10% identifying themselves as agencies or consultants working with startups.

Most Important KPIs and Metrics to Include in a Startup KPI Dashboard
65.5% of startups surveyed consider KPIs very important for success.

When asked about the most important metrics a startup should include in their KPI dashboard, our respondents mentioned more than 50 different metrics in total.
This means the selection of metrics depends on more factors than just the startup stage and type of startup — the business startups are in and what they’re trying to achieve.
That said, the most mentioned metrics were CAC, CLV, Traffic, Conversion rate, Burn rate, and Active users.

Zaheer Dodhia from Logo Design, a scaleable startup in the Growth stage also notes, “In my experience, the most important KPIs for a startup owner is user interest vs. conversion.”
“So, if you have signups, it’s a good sign during early stages. [But] how many of these are converting as you grow is important for the survival and growth of your company. At later stages, you are looking at orders vs dollar amount, product vs product variant, and finally how your company is performing against competitors. All this information need to be available on the dashboards you opt for.”
PRO TIP: Need Help Building a Custom Dashboard?
Not sure which metrics to track or dashboards to build? Have old reports you want to recreate in Databox? Share your dashboard needs with one of Databox’s product experts and we’ll build you a customized dashboard for free.
Here is an example of what your dashboard can look like… (just imagine your data populating here)

And here’s another one…

We get it. You may not have the time to build out the perfect dashboard before your next meeting.
Luckily, we do.
Connect with someone on our team, share the metrics or areas that you need to track, and we’ll build your dashboards for you in just 24 hours.
Learn more about our free dashboard setup here, reach out for assistance via email or chat, or book a call.
7 Startup KPI Dashboard Examples That Are Core to Healthy Business Growth
Now for the KPI dashboard for startups that are must-haves:
- CEO Dashboard
- Operations Dashboard
- Marketing Dashboard
- Sales Dashboard
- Customer Success Dashboard
- Customer Satisfaction Dashboard
- Early-Stage SaaS Dashboard
Dive in.
1. CEO Dashboard
A CEO dashboard is a dashboard tailored for the CEO and other executives to give them a holistic view of overall business performance.
The dashboard aims to show its reader all the metrics that are useful to them. These include metrics that help executives understand how well marketing, as well as sales, are doing in real-time.
However, the specific metrics you add will vary according to your business objectives. “Metrics you include in your startup’s KPIs always depend on your specific business and what you’re trying to achieve,” agrees Jane Evseeva from Class Manager a scaleable startup in the Growth stage. “Therefore, the metrics you choose to track should be aligned with your company’s overall goals and objectives.”
“For example, in the early stages of our startup, our goals were to grow quickly, so we focused on metrics like CAC and LTV,” Evseeva observes. “Right now our goal is targeted at achieving profitability, so the gross margin is currently our top priority.”
Generally, the following metrics are usually present on the startup metrics dashboard for CEOs:
- Monthly recurring revenue (MRR)
- Revenue per customer
- Total number of customers
- Gross MRR churn rate
- Annual recurring revenue (ARR)
For Class Manager though, Evseeva shares the CEO dashboard features the following metrics:
- “Firstly, we track some financial metrics, such as revenue, burn rate, and cash on hand.
- Secondly, we pay attention to user growth and engagement numbers.
- Finally, we keep an eye on key performance indicators for our specific industry.
Here are a few examples of each:
Financial Metrics: Revenue, Burn rate, Cash on hand, and Number of new users per month/week/day, Retention rate (percentage of users who come back after their first visit).”
“Some common metrics that are best perceived by decision-makers in our startup include gross margin, customer acquisition costs (CAC), retention rates, churn rates, and lifetime value (LTV),” Evseeva adds.
Wondering how a CEO KPI dashboard looks in practice. Check out an example from Databox that is predominantly used by SaaS businesses. This MRR and churn dashboard helps you monitor your churn rate and track your MRR growth in real-time. It also enables you to see how many customers you have at any given point in time.

Related: Executive Reporting: Management Reporting Best Practices & Report Examples
2. Operations Dashboard
An operations dashboard is another KPI dashboard for startups. It features metrics that help monitor and manage short-term operations.
Such types of startup dashboards are helpful for tracking and optimizing ongoing operations. A high-level operations dashboard also reveals a business’s health. In fact, the data can help you understand areas to optimize operations.
Some key metrics to include in an operations dashboard are:
- Operating cash flow
- Headcount by department
- Revenue and budget including departmental spend
- Operating cash flow
- Headcount by department
- Revenue and budget including departmental spend
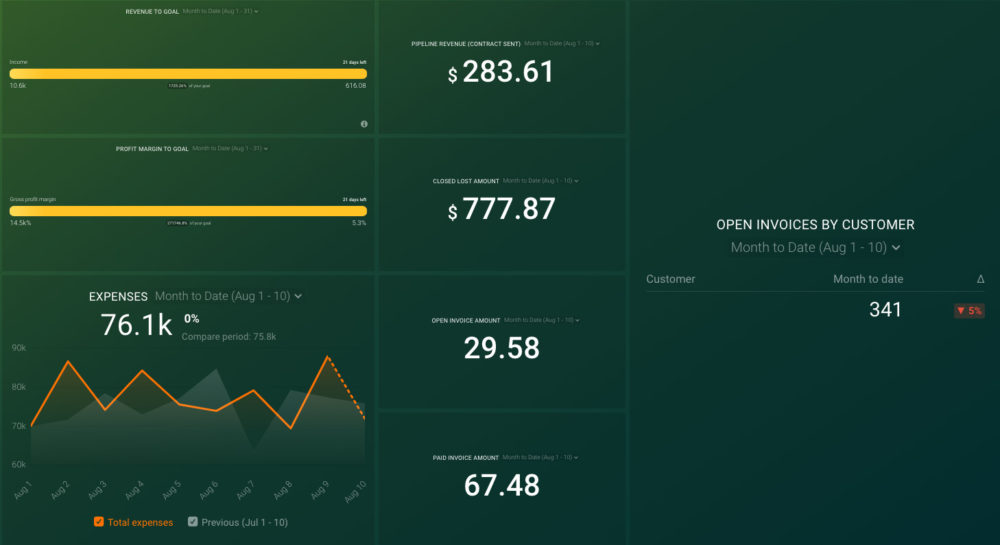
Here is an example of an operational dashboard built in Databox. This Dashboard to keep high-level tabs on your overall financial health and quickly identify issues that might impact your business’s cash flow and turnover.
3. Marketing Dashboard
As its name suggests, a marketing dashboard is a startup KPI dashboard that displays information relevant to the marketing team.
Essentially, there is lots to track depending on the running marketing campaigns and objectives. Hence, top-level marketing dashboard help by collating key metrics for a birds-eye view of how well your marketing is doing.
You can also create campaign-specific marketing dashboards to track performance. Important KPIs to add here are:
- Marketing qualified leads (MQLs)
- Return on as spend (ROAS)
- Marketing spend
- Goal completions
- Goal conversion rate
But again, the metrics you track will depend on your company.
For instance, for Spacelift, a small business startup in the Growth stage, Mariusz Michalowski writes, “Some important KPIs we track are sources of the visitors, bounce rates, search rankings as well as domain authority. Each of them offers insight on an important aspect of the business allowing us to make changes, fix things up and gain perspective.”
Shane Liuw of First Page Digital, an agency working with startups, however, highlights, “I would say that if you aren’t sitting on a mountain of venture capital cash, ROI has to be your most important marketing KPI.
You must understand that every dollar you spend generates X amount of revenue. Furthermore, you should examine your ROI for various channels to ensure that your money is spent first in the channels with the highest return.”
Says Liuw, “Funds will be limited, so you must ensure that every dollar spent is accounted for and yields a return. If it isn’t, it’s better to spend it somewhere else.”
Here is an example of a marketing dashboard from Databox. This dashboard helps you track key user acquisition metrics, such as visits to leads conversion rate, traffic from email vs. blogs, etc.

4. Sales Dashboard
Like the marketing dashboard, a sales dashboard caters to a startup’s sales team. Its job? To give you an overview of results-based metrics that help you track your sales performance.
Key startup sales KPIs to add to this dashboard are:
- Sales target
- Average days to close
- Lead conversion rate
- New accounts
- Average contract value (ACV)
- Closed-won deals
Sharing their experience with a sales dashboard, Margo Ovsiienko from InvoiceOcean, a small business startup in the Growth stage says, “We are working on growing a SaaS startup, so tracking SaaS-specific metrics is key for us to keep track of progress.”
“Most businesses are still defining their KPIs around a sales funnel. We are looking at it through the prism of a sales loop — we don’t stop tracking a number of new subscription purchases, but also have a few metrics around recurring sales and churn,” Ovsiienko continues.
After all, “What’s the point of tracking new sales if your sales is a leaky bucket and churn is rampant?” points out Ovsiienko.
Here is an example of a sales dashboard from Databox. With this Sales Overview dashboard, you’ll get a comprehensive look at your team performance KPIs, your sales pipeline, team leaderboard, and progress towards your monthly goals

5. Customer Success Dashboard
A customer success dashboard for your startup gives you a complete breakdown of how well your business/product is catering to its customers.
Keep in mind that satisfied customers are essential for growing your recurring revenue, which makes the case for tracking their satisfaction.
In short, this type of startup KPI dashboard gives you answers to questions like how well you did in the previous month, how much you made in recurring revenue, which customers churned, and how much is the amount value of churned customers.
To this end, add the following metrics to your customer success dashboard:
- Customer churn
- Total customers
- Annual recurring revenue
- Customer upsells
- Customer lifetime value
- Customer health score
- Customer retention cost
The key here, however, is to “not focus on vanity metrics that make you look good but add little value,” advises Jacob Udodov from Bordio, a small business startup in the early stage.
It’s why Udodov shares, “I think the key metrics that should be used are:
- Customer acquisition cost. It has to be under control so that the business has its costs covered but also has enough resources to acquire many new clients quickly to support growth.
- Customer retention rate. It shows the percentage of clients that stay with the company after a specified period of time. This metric can indicate success or highlight potential issues.”
Here is an example of a customer success dashboard from Databox. This Intercom dashboard helps you evaluate your overall Help Desk performance and the efficiency of individual customer service agents.

6. Customer Satisfaction Dashboard
This KPI dashboard for startups is useful for service teams, helping them monitor and analyze metrics related to customer service.
Keep in mind, that a good product or reasonable pricing is never enough for customers. If anything, they’d pay more for a good experience.
Meaning: while your product or pricing may win over customers, a key tactic to retain them is by offering excellent service. This is why using a customer satisfaction dashboard to analyze performance and look for opportunities to improve your customer service is important.
As a means to this end, add the following KPIs to this dashboard:
- Customer retention rate (CRR)
- First-contact resolution rate
- First-call resolution rate
- Ticket volume
- Average reply time
- Average resolution time
Here is an example of a customer satisfaction dashboard from Databox. This dashboard combines sources from Intercom and Stripe to show the correlation between your customer service performance and churn rate — which can also be used to evaluate customer satisfaction.

7. Early-Stage SaaS Dashboard
An early-stage startup dashboard features KPIs that are super important for the survival and growth of an early-stage SaaS startup.
In fact, its focus lies on getting the team to concentrate on what’s valuable to the business, early on.
At FindByPlate, a small business startup in the Growth stage, for example, this dashboard is a highly valued one.
Eduarda DePaula comments, “The dashboard that decision-makers have widely appreciated at our company is the Early-stage SaaS dashboard. As the name suggests, this dashboard has been specifically designed for startups currently in the early stages.
The focus is on KPIs and metrics that are most useful in the early stages of a SaaS company. Through this dashboard, decision-makers can easily take a bird’s eye view of the company and the result of its past efforts. We focus on metrics like activation rate and MRR.”
Some key metrics to track on this dashboard are:
- Monthly unique leads
- Visitor-to-lead ratio
- Lead to customer ratio
- Cost per lead
- Customer acquisition cost
Don’t forget, the exact metrics depend on your startup and its leading business objectives.
And what does this look like in practice? Here is another example of a SaaS dashboard that can be used to track performance in its early stage, in terms of revenue. This Profitwell dashboard tracks all the incoming sources of revenue for your SaaS business, as well as different churn metrics.

Monitor Your Startup’s Growth and Keep Your Stakeholders Updated with Databox
To recap, collecting, monitoring, and sharing live performance using data dashboards is key for excellent business growth and performance.
It’s important to remember though, putting together just about any dashboard won’t help. Make sure you identify the metrics that are most important to your startup, then build an easy-to-read startup KPI dashboard.
It’s only when you’re going to be selective of your startup KPIs that you’ll be able to focus on what’s important — optimizing those metrics to improve performance as needed too.
Ready to design your startup KPI dashboard? Start with gathering all your important metrics and their sources. Then, plug the data into Databox and it’ll create a fully customizable, visually engaging dashboard for you.
It’s as simple as that. So go on, sign up for a free trial today and improve your startup’s performance using beautiful dashboards.


