


Table of contents
Are there weak spots in your sales pipeline? What was your average deal value in the last quarter? Or the average sales cycle length?
Monitoring relevant sales metrics is critical for timely reactions and quick fixes when you detect an issue in your sales cycle or identify an opportunity to boost your numbers. However, the only way to see the whole picture and gain important insight into your performance is to create reports.
Salesforce provides several types of reports that can help you understand how well your sales pipeline is performing and present company performance summaries and marketing and sales overviews in a digestible and streamlined format.
This guide will walk you through sales reports every sales professional should know about and show you how to use them in the most efficient way possible to drive business growth.
Let’s dive in.
- What is a Salesforce Report?
- What is a Report Type in Salesforce?
- Salesforce Report Types
- How to Create a Standard Report in Salesforce
- Salesforce Report Examples
- Make Better Salesforce Reports with Databox
What Is a Salesforce Report?
A Salesforce report is a list of filtered data meeting a specific criteria that give you information about a question you want to answer. You can organize this data in different ways to answer various questions and display them in several ways, with one goal: to make it skimmable and easy to understand without spending hours on the report.
The purpose of having such data and being able to interpret it is to make data-driven decisions about your business: how to develop your product, what new products you may need to introduce, how to enhance communication with your customers and leads, and more.
Reports allow you to easily identify the common ground between two or more sets of data and base your future business activities on it.
Related: 10 Essential Metrics to Include in Your Salesforce Dashboard
What Is a Report Type in Salesforce?
Report types in Salesforce are practically templates: you choose one type or another based on what kind of data you want to see. The report type defines which records and fields will be displayed in your report, based on how the primary object is related to other objects.
There are several predefined report types you can use in Salesforce. You can’t edit them, but you can create your own custom report type to suit your needs entirely.
Let’s break down the predefined report types:
- Objects
- Object Relationships
- Fields included in Results
- Fields Checked by Default
- Field Display Names (Report Column Headers)
Objects
Objects are the essential element of every Salesforce report. They are digital tables (and are called so in many other sales management systems). The purpose of these tables is to store relevant data and info about a company, give it a structure, and help users manage the data.
If you have used another sales management software before, you may find object fields and records similar to database columns and rows.
There are several types of Objects:
- Standard: It’s all in the name–these are primary structures, standard business objects such as campaign, opportunity, leade, account, contact, etc. are included in Salesforce.
- Custom: These aren’t provided by Salesforce–you create them to store any data that’s specific to your business.
When you create a report, you can select different Objects to display. The Primary Object is the most important data in it, included in the report’s name, too. You can choose up to three other objects to include in the report with the primary one.
Object Relationships
When you select the desired objects, it’s time to determine the relationships between these objects. Object relationships are specific field types that determine how two or more objects are going to interact one with another.
For example, say your main primary object is Account. You create a new Account object when you’ve talked to someone from the company for which you created the account. If you have that person’s contact information, it’ll be found under Related in Account, because there is a relationship between Account and Contact objects.
You can create custom relationship fields on an object to create new relationships between objects and enable other users to see related data in the report.
Fields Included in Results
After you choose the desired objects and the relationships between them, you should decide what fields you want to include in the report.
The Field Layout Properties screen displays the layout and enables you to manage the fields that will be available to you through the report, where you can filter them for a specific output. Salesforce automatically creates sections in the layout based on the objects you have chosen, but you can edit them as necessary: create new ones or move fields from one to another.
Fields Checked by Default
Salesforce lets you check specific fields that you want to include in every report automatically.
You will see that some fields in the layout already have check marks by default, but you can select more to add to this list. Once you’ve checked all the desired fields by double-clicking on the field’s names, and checking the box under Checked by Default, you can complete your report creation and save it.
Field Display Names (Report Column Headers)
Say you have a really long field name–for example, Number of Purchases in Last N days. Such lengthy names would take up too much space in your report, while some other fields don’t have names that are clear enough to enable users to understand them without a context.
That’s why Salesforce lets you create a display name (think of it as a nickname!) for your field so it’s more compact in the report and understandable to others who may not be aware of the context. For instance, replacing “number of” with a # works perfectly.
Note that adding a new custom field doesn’t mean it will automatically appear in your report types. This option isn’t available for now, so you need to add the new field manually to Report Types and to the actual report.
Standard Salesforce Report Types
There are standard and custom reports in Salesforce. Since custom reports depend on each salesperson’s needs and goals, we’ll only discuss the standard reports. There are four types:
Tabular Reports
To run scheduled reports in Salesforce, you can start with tabular reports, which are the basic type of reports that display the desired data in rows and closely resemble Excel spreadsheets. If your goal is to simply list your data without grouping it or doing any calculations, or you want to export the report, this type is the most suitable one. Users often create Tabular reports to list all contacts, for example.
If you want to do more complex things with your data, like manipulate it or use calculations, you should use another type of report, such as Matrix or Summary.
Summary Reports
Typical reports that most people use in Salesforce are Summary reports. They display groups of data and you can choose how you’re going to make these groups.
For instance, you can group the opportunities by Account Name and then calculate the total value for each group, as well as find minimums or maximums for them. You can also organize the data by year or quarter, depending on what you need.
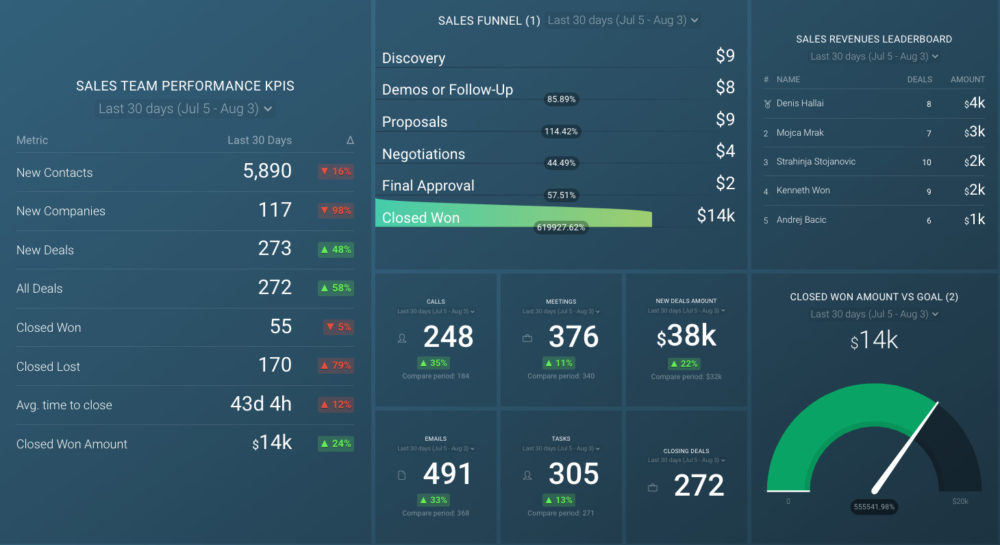
PRO TIP: Monitor Your Sales Team’s Performance in One Dashboard
Smart Sales Managers know that to achieve your monthly and quarterly goals, you have to monitor your team’s sales performance on a daily, weekly, and monthly basis. To do that, you need an actionable dashboard that summarizes both team and individual sales rep metrics and allows you to:
- Understand the current sales pipeline.
- Track sales rep performance.
- Compare team results to revenue goals.
If you use the HubSpot CRM, you can benefit from the experience of our sales experts, who have put together a plug-and-play Databox template showing some of the most important metrics for monitoring your sales team performance. It’s simple to implement and start using as a standalone dashboard or in sales reports!
You can easily set it up in just a few clicks – no coding required.
To set up the dashboard, follow these 3 simple steps:
Step 1: Get the template
Step 2: Connect your HubSpot account with Databox.
Step 3: Watch your dashboard populate in seconds.
Matrix Reports
In Matrix reports, things get a tad more complicated, since you can group data by row and by column and see different totals in the report. They are particularly useful when you want to see totals for two categories that aren’t related.
For example, you can use summary reports to see totals by accounts, but if you want to see totals for a specific product and different dates, Matrix reports are the way to do that. They’re helpful when you have too much elaborate data to show in the report.
Joined Reports
Joined reports are useful when you want to compare the data from two individual reports.
In this report, you can create up to five separate blocks to display related data only, and these blocks behave like separate reports: you can use unique filters and formulas to sort and display the data in different views. For example, if you want to compare the number of opportunities for two accounts.
How to Create a Standard Report in Salesforce
Standard Salesforce reports are easy to create, and you can keep them in your dashboard so you can quickly access them in the future whenever you need them again.
Follow the instructions below to create a standard report.
- Open your Salesforce account and choose the New Report option in the Reports tab.
- Click on Property and then Create to start the process in Salesforce Report Builder.
- In this step, you need to select the elements you want to see in the report: Properties, Fields, and Filters.
- Opt for the desired report type.
- Save the report to a folder and select Run report to finish creating it.
That’s all!
Salesforce Report Examples
Databox provides you with several dashboards so you can effortlessly track your leads, sales, and relevant Salesforce KPIs and metrics. Here are a few templates you can download for free.
- Salesforce Expected Value of Sales Pipeline Dashboard
- Salesforce Leads Dashboard
- Salesforce Leads Overview Dashboard
Salesforce (Expected Value of Sales Pipeline) Dashboard
The Salesforce Expected Value of Sales Pipeline dashboard template allows you to visualize your whole sales pipeline and highlights the sales closed in the current quarter. Moreover, you can also see the expected value of the opportunities that will likely close by the end of the quarter.
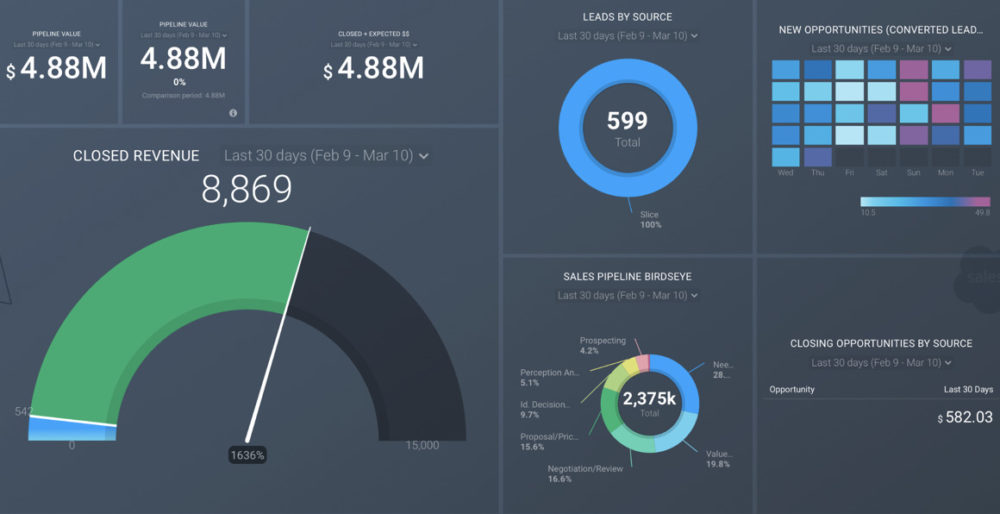
The metrics included in this dashboard are:
- Closed and pending leads
- Converted leads
- Opportunities >51% chance leads source
- Expected revenue
- New leads by lead source
- Open opportunities amount by stage name
- Opportunities won revenue
This dashboard helps you answer important questions, such as where most of your leads come from, or what the total value of all deals in your sales pipeline is.
Salesforce Leads Dashboard
By using this Salesforce Leads dashboard template you can get a detailed overview of all your leads in Salesforce, which facilitates tracking your sales. You can see what channels generate the most leads, how many leads are generated from all your marketing sources, what stage your leads are in, and more.
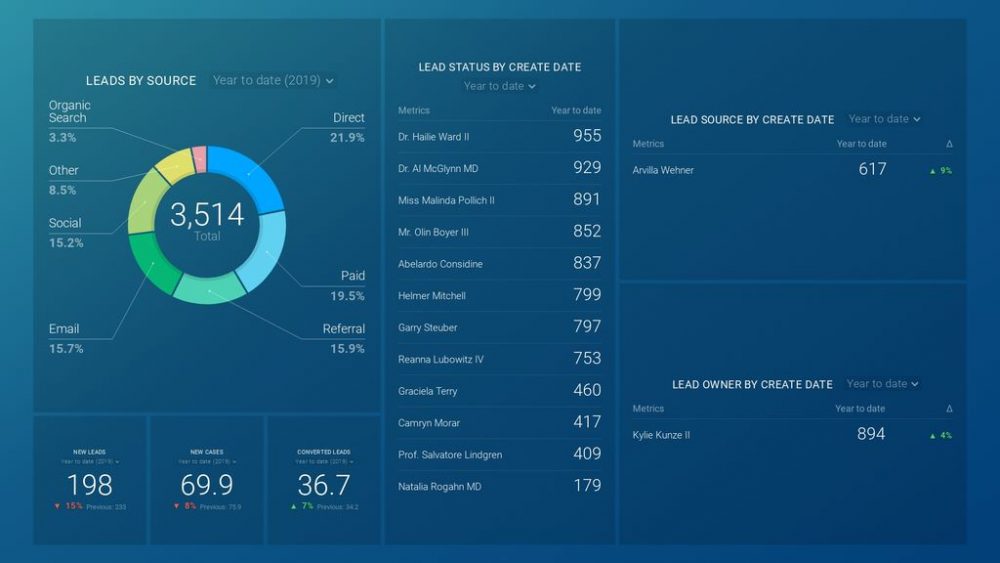
The metrics available in this template are:
- Converted leads
- Lead source by create date
- Lead status by create date
- Lead owner by create date
- New cases
- New leads
- New leads by lead source
If you opt for using Databox deep integration with Salesforce, you will be able to track even more: closed and won opportunities, sales cycle, win/loss rate, deal type, and more.
Salesforce Leads Overview Dashboard
The Salesforce Leads Overview dashboard template lets you view all your leads in Salesforce and enables tracking your sales progress. Here, you can use the Query Builder tool to create advanced Salesforce reports.
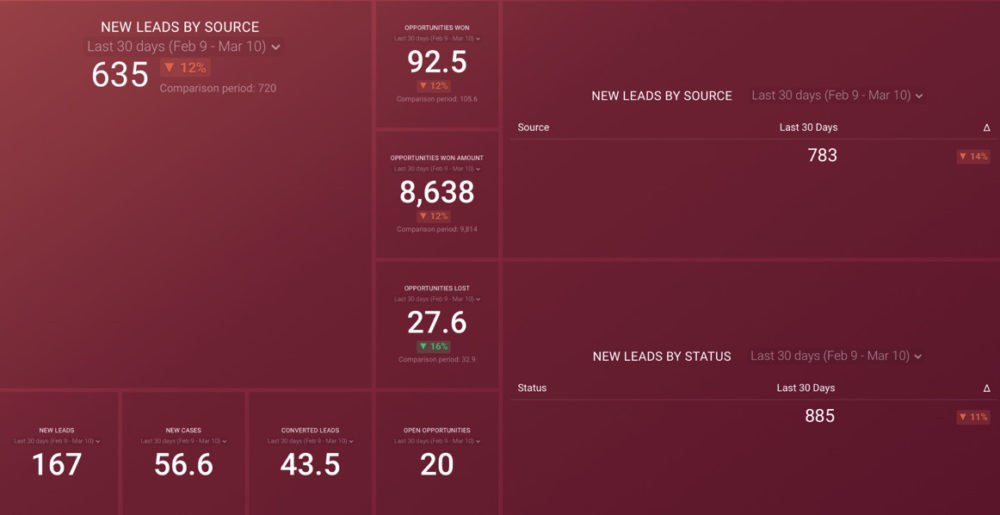
The key metrics you can track in this dashboard are:
- Leads by source
- Lead status
- Lead source
- Lead owner
- Converted leads
- New leads
- New cases
This streamlined overview of all your leads helps you answer some critical questions, such as where your leads are coming from or who owns them. And if you use our one-click integration with Salesforce, you can pull even more relevant data to complete your report.

Make Better Salesforce Reports with Databox
Salesforce reports allow you to list, group, and relate your data so you can understand the performance of your sales pipeline.
Now, imagine taking these reports to another level. You have a customized, streamlined overview of your pipeline’s performance and you can answer crucial questions at a glance. You can quickly identify your team’s strengths and seize opportunities to close more deals and boost revenue. You can effortlessly pinpoint weak spots of your pipeline and analyze the data to understand the causes, so you can fix them.
No, this isn’t some perfect, unachievable scenario. It’s possible with Databox.
Databox dashboard templates save your time and energy by offering predefined dashboards and reports that include all the relevant metrics you need to track your leads, identify where they come from, and learn what stages of your pipeline they’re in. Our deep, one-click integration allow you to pull the data from various sources and make the most out of your tracking, so you don’t lose track of your leads, opportunities, and revenue.
We trust you don’t want to miss the opportunity to build a customized dashboard and streamline your lead tracking in Salesforce. Sign up for our free trial today and see Databox in action!


