


Table of contents
Email is a vital part of nearly every marketer’s strategy.
Fifty-nine percent of respondents to the just-released 2018 edition of Campaign Monitor’s Email Marketing Industry Report said that email marketing continues to generate the most ROI for their organization.
And in our study of the most-tracked metrics from thousands of HubSpot users, several email marketing metrics showed up on that list too.
So, if email is so critical, what email marketing metrics are marketers monitoring in order to maximize their return?
To figure that out, we dug through our data to identify the email marketing metrics that Mailchimp users track most in Databox by calculating the number of times each metric is included in a users’ dashboard. (Since MailChimp is primarily an email marketing tool, we figured that all ten metrics would be email marketing metrics and that our MailChimp data would be most indicative of what email marketers are measuring today.)
In this post, we’ll look at each of these metrics, share some observations about why they are popular and suggest how you should visualize them in your email marketing dashboard.
Top 10 MailChimp KPIs
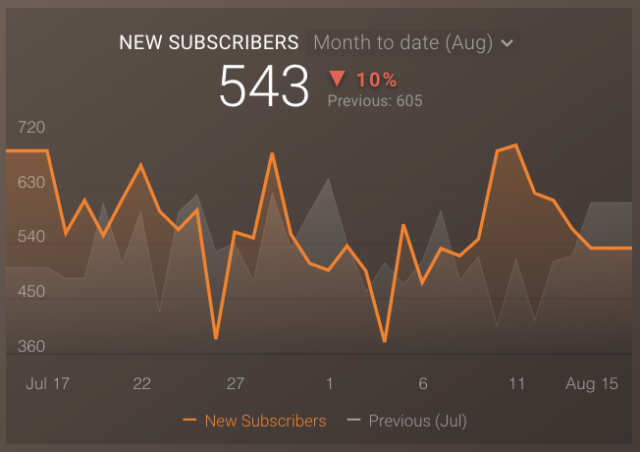
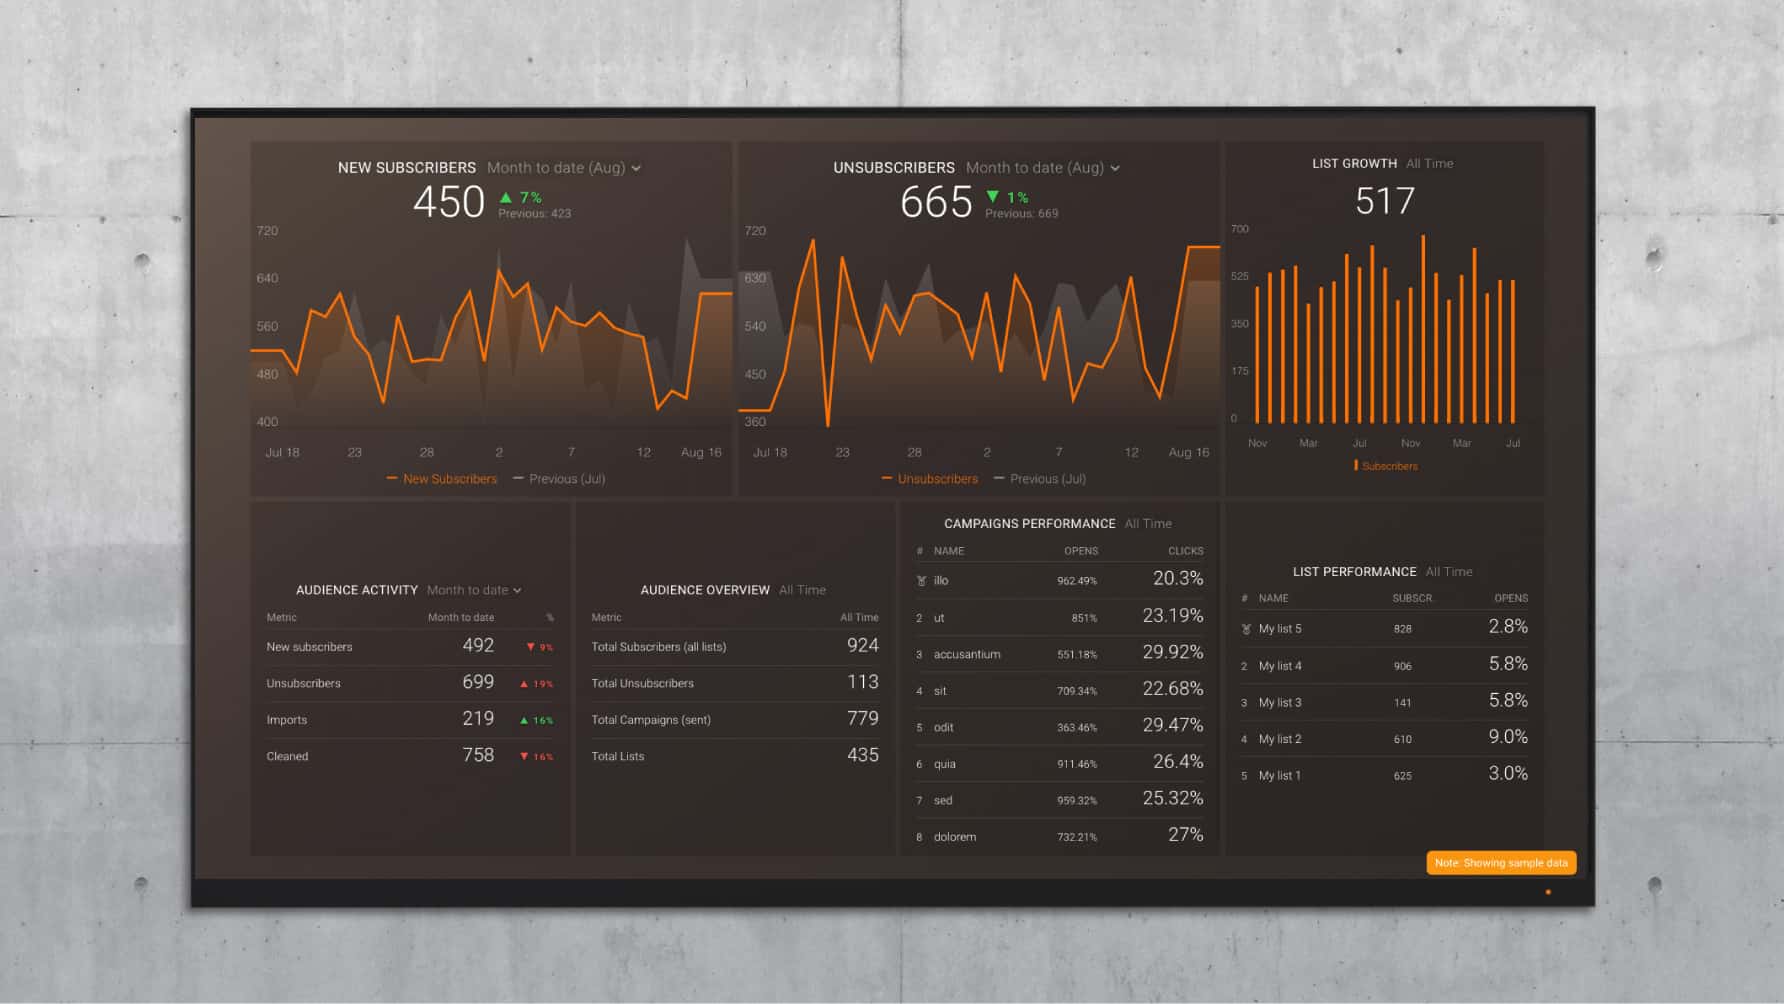
1. New Subscribers
The value of new subscribers depends on a variety of factors, including industry, type of list, and engagement. But nearly all marketers value new subscribers to some degree, and it leads the Top 10.
Recommended Datablock: Line chart with comparisons turned on
2. Total Subscribers
Monitoring total subscribers reveals the health of your lists. Are you losing subscribers without replacing them, maintaining subscriber numbers, or growing your lists? Marketers are tracking this metric to find out.
Recommended Datablock: Number with “all time” date range

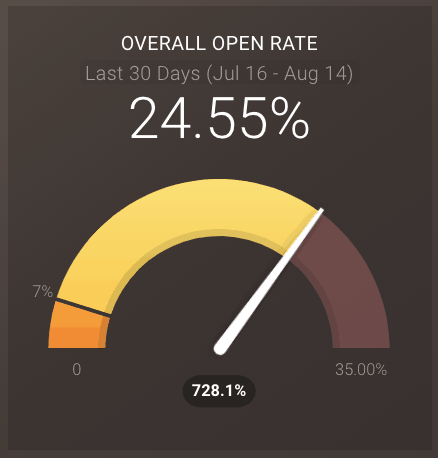
3. All Campaigns Open Rate
Knowing the open rate for individual campaigns is important, but it’s also insightful to know how your email marketing is performing overall. Marketers want to know if they’re consistently getting strong open rates.
Recommended Datablock: Gauge with Goals turned on
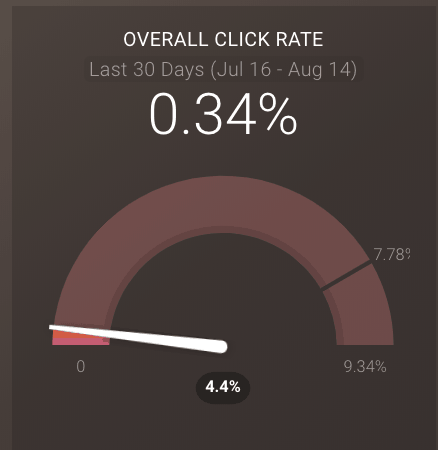
4. All Campaigns Click Rate
Similar to the All Campaigns Open Rate metric, the All Campaigns Click Rate metric tells you how consistent your click rates are across campaigns. While individual campaign click rates tell you how specific content is performing, overall click rate gives you a broader perspective if you’re sending multiple messages in a given time frame.
Recommended Datablock: Gauge with Goals turned on
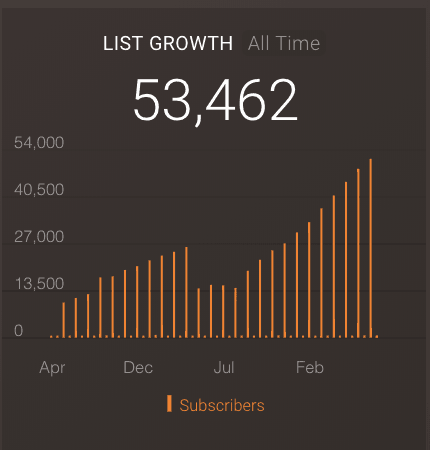
5. Lists Growth
Lists growth is an important indicator of the health of your lists. Marketers want to see list growth stats so they know which lists to focus on.
Recommended Datablock: Bar chart with “All Time” date range
6. Total Unsubscribes
Unsubscribes are, unfortunately, just a part of the email marketer’s life. Subscribers may leave for a variety of reasons, and it’s better for your sender reputation score if unengaged subscribers unsubscribe rather than repeatedly delete your emails without opening them. But marketers are monitoring unsubscribes since high unsubscribe rates indicate a problem.
Recommended Datablock: Number with comparisons turned on

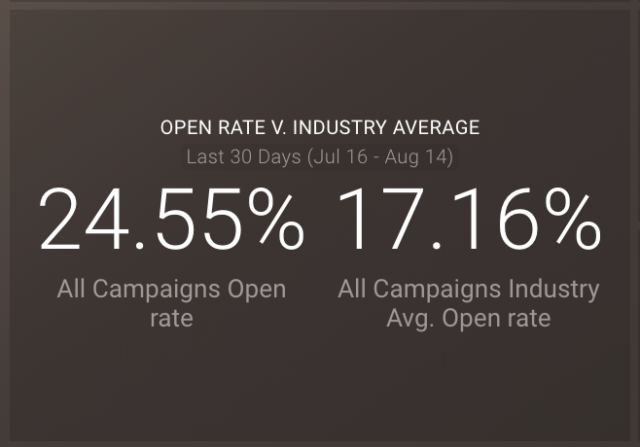
7. All Campaigns Industry Average Open Rate
Open rate by industry average is a revealing stat. Tracking how your email marketing performs vs. others can tell you whether you’re better or worse than your peers.
Recommended Datablock: Compare Datablock
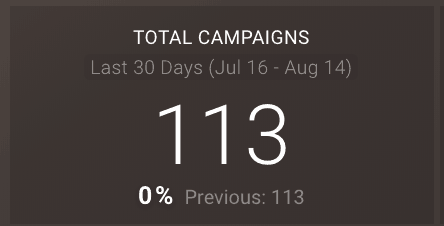
8. Total Campaigns
MailChimp goes beyond email to allow you to share emails, ads, and other messages with your subscribers. Each message is considered a “campaign.” Tracking this metric lets you see how all of your campaigns (those of all types) are doing.
Recommended Datablock: Number with comparisons turned “on”
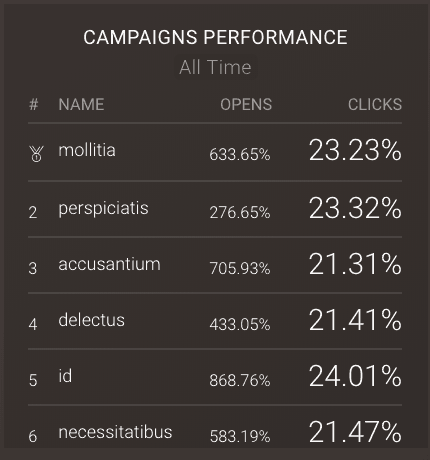
9. Click Rates by Campaign
Click rates by campaign tells you how well each campaign’s content and CTAs resonate with your audience. If a particular campaign’s click rate is exceptionally high or low, the results warrant a deep dive into why.
Recommended Datablock: Leaderboard with open rates included
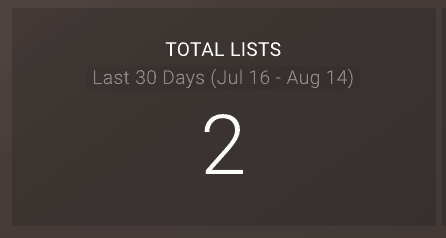
10. Total Lists
It’s helpful to know how many total lists you have and what those lists are. It’s a good idea to keep your lists in view so none of them escape your attention.
Recommended Datablock: Number
Optimize Your Email Marketing ROI
Are these metrics similar to the ones you’re tracking? If not, you should get started. By monitoring these ten metrics, you’ll be able to optimize your list growth, your email engagement and your email segmentation efforts — 3 key processes every email marketer should master.
But, they also aren’t the only things you should optimize. Over the last few months, we’ve collected 100s of suggestions from marketers on how to improve your email marketing results.
Here’s a list of suggestions when you’re ready to take it to the next level:
- When Should You Send HTML vs Plain Text Emails?
- Optimize the Frequency of Your Email Marketing Campaigns
- When is the Best Time to Send Email Marketing Campaigns?
- How to use Send-Time Personalization to Reduce Unsubscribes, Improve Deliverability, Opens and Clicks
- How to Write Engaging Email Subject Lines
- How to Write Email Copy that Converts
- Proven Strategies for Improving Your Email Click-Through Rate
- 4 Reasons Your Email Marketing is Underperforming
- 6 Often-Overlooked Email Marketing KPIs You Should Be Monitoring
- 6 Companies Getting Amazing ROI from their Email Marketing Efforts
PRO TIP: Track Your Email Marketing Performance with Ease
Unsure what’s working in your email marketing strategy and what doesn’t? Feeling overwhelmed by data scattered across multiple platforms and reports?
Get a clear and centralized view of your campaign performance with our free email marketing dashboard templates – pre-built with essential metrics and KPIs from the most popular email marketing platforms, all in one place. See what’s working (and what’s not) with your email marketing, optimize campaigns, and maximize your return on investment.
Monitor engagement: Keep tabs on essential metrics such as open rates, click rates, and subscriber growth. Learn how your audience interacts with your emails and optimize your strategies accordingly.
Optimize campaigns: Identify your top-performing campaigns and landing pages with templates such as the Mailchimp Campaign Performance and HubSpot Marketing Performance dashboards. Analyze user activity, conversion rates, and campaign ROI to drive better results.
Understand traffic sources: Dive deep into your traffic data with the Website Acquisition Overview template from Google Analytics 4. Monitor where your users are coming from, their behavior on your site, and how it all ties back to your email campaigns.
Improve deliverability: Track your email delivery rates, open rates, and click rates to ensure your messages are reaching your audience and performing well.

You can easily set it up in just a few clicks – no coding required.
To set up a dashboard, follow these 3 simple steps:
Step 1: Choose a fitting template
Step 2: Connect your data
Step 3: Watch your dashboard populate in seconds
Make Tracking Easier With Datablocks, Templates and Scorecards
If you want to dig deeper into your data, Datablocks can help. As a Databox user, you can create custom dashboard reports from Datablocks. These Datablocks are customizable and resizable so you can quickly visualize your data. Check out how they work in the video below.
Or if you want to quickly view all these metrics in our custom dashboard software, you can start with one of our already-assembled Databoard templates. You can set up a Databoard with your MailChimp metrics with this free template:
Need a quick performance update on your most important MailChimp KPIs? Set Databox Scorecards and receive alerts on your KPIs through email, mobile push notification, and/or Slack.


