Table of contents
In mid-2017, IMPACT, a Diamond HubSpot Partner based in Wallingford, CT, found itself grappling with two common questions that concern most digital marketing agencies.
“What if we do excellent work for our clients, but they still do not appreciate it?”
AND
“What if we do excellent work for our clients, but we focus in the wrong areas?”
Founded in 2009, IMPACT earned HubSpot Diamond Partner status in 2015 after just 6 years in existence. They must be doing SOMETHING right. They like to see their clients as “partners” so both sides stay accountable for revenue growth during the relationship. And yes, plenty of other agencies like to say that clients are actually “partners” as well.
But IMPACT wanted to go further. They found that despite their best efforts, some clients would lose track of the value they provide, and after 6 months, an executive from the C-suite would ask, “What have you guys done for us lately?”.
IMPACT felt they needed to tell a more cohesive story around why they were providing specific marketing activities for each client. They always centered their activities around growing the client’s revenue in some measurable way, but sometimes, that story would get lost along the way.
In May 2017, they learned about DigitalMarketer.com’s “Value Journey Canvas”, which tracks the buyer’s journey in a slightly different way than HubSpot’s traditional approach to inbound marketing. They decided to use this Value Journey Canvas as a framework to help partners understand where they were falling short, and why IMPACT chose to run specific campaigns.

Here’s the problem: they did not have the technology to support this transition. They use internal teams called ‘pods’, composed of 3-4 strategists and one senior strategist. These pods did not have the flexibility to monitor client metrics with their traditional Google Sheets-based scorecard. They only had time to fully review metrics once a month.

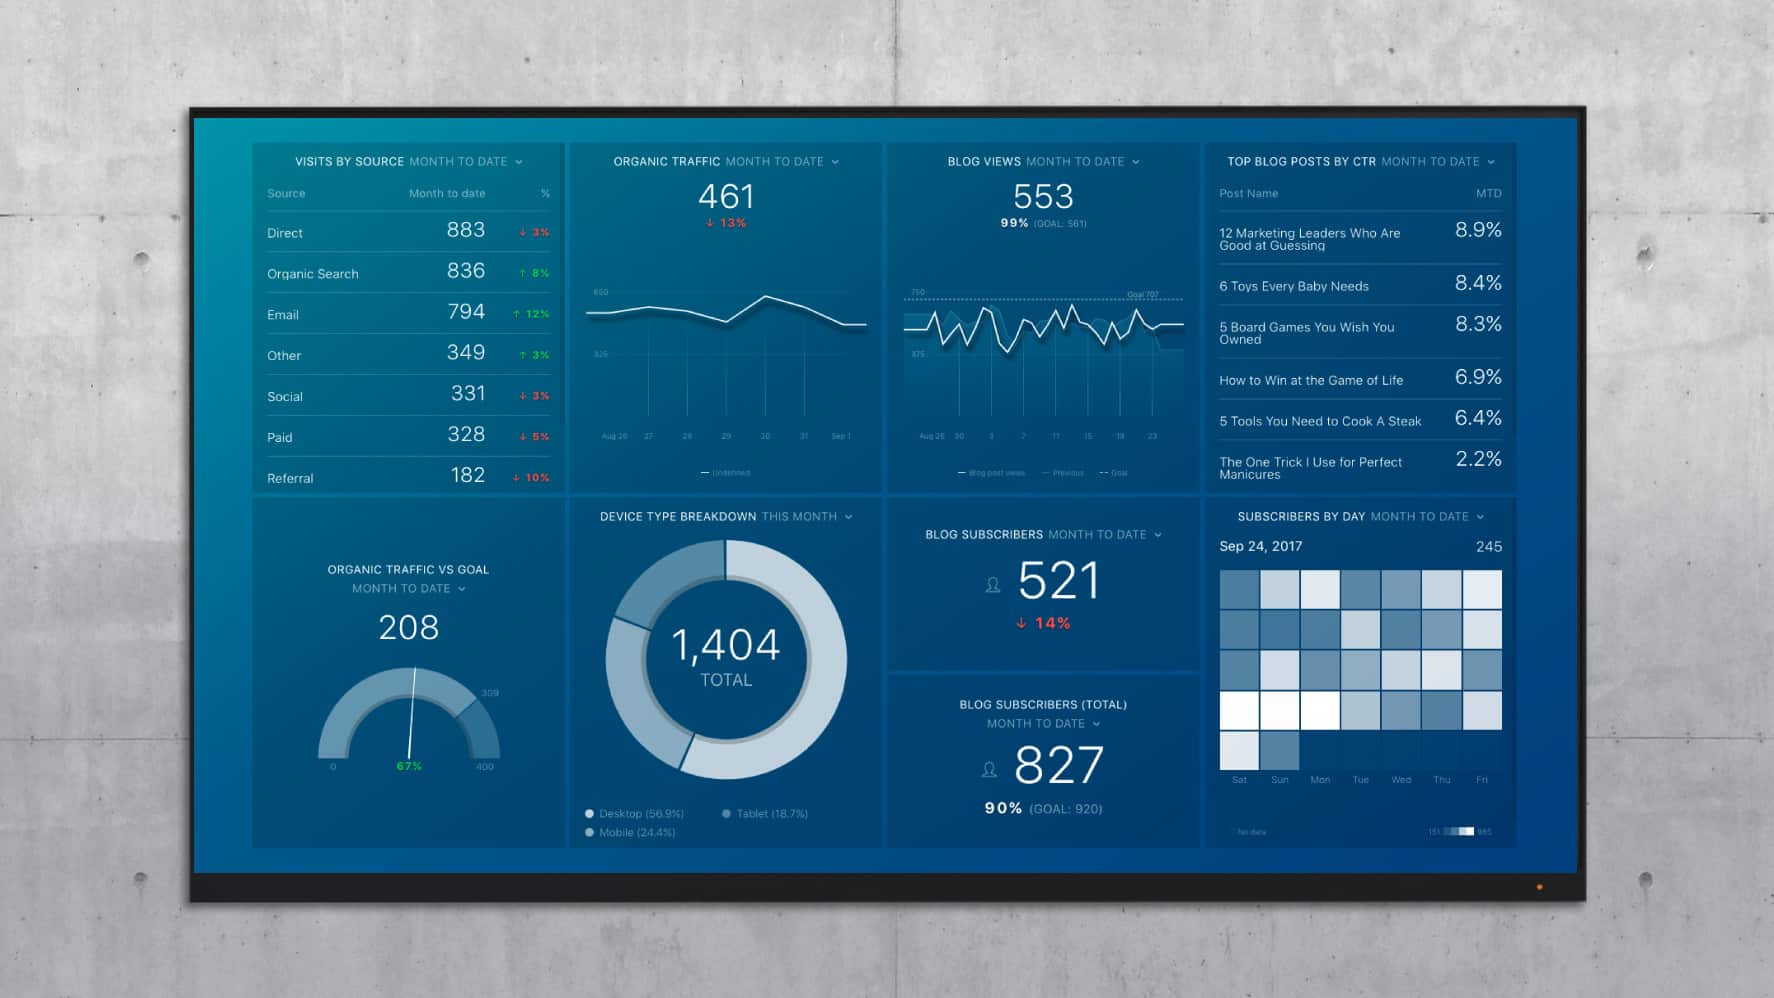
An example of their old scorecard
So, IMPACT joined the Databox Partner Program to track marketing data in real-time with automated dashboards and empower each pod. Here are the ways they changed their internal processes to keep clients laser-focused on their own revenue growth throughout their partnership.
Video Summary
Step 1: Setup/ Building Enthusiasm
Brie Rangel, the Director of Client Services at IMPACT, led the initiative to help IMPACT strategists become better consultants for clients. Since the agency has 45 employees, she faced a larger challenge than most and a greater need for strong internal processes. She wanted to empower these strategists with the technology that would help them make rapid decisions and tell a clear story to clients when it came time for the monthly meeting.
First, she set up a committee with members from each pod within IMPACT. “If I built a template and went to our team and said, ‘Use it!’, I would not have gotten the best response,” says Brie. She polled strategists and some of their more technical employees to determine the metrics that actually mattered in the reporting process. She found that the scorecard shown above needed to be completely blown up and re-imagined.
Brie brought in Stacy Willis, a strategist from one of the pods, to advise. “We sat down and asked the following questions,” said Stacy:
- “What do our clients ask us?”
- “What do we typically tell them?”
- “What are the things that get typically miscommunicated?”
- “What are the things we want them to care about, but can’t get them to care about?”
They collected the answers, and found that they fit within three buckets from the Value Journey Canvas: Attract, Convert and Ascend. They planned one dashboard for each metric category to ensure each client would only need to follow three dashboards at most.
Then, they re-assembled the group and spent 2 hours determining the best way to present the metrics for each dashboard using Databox’s visualizations (We explain these 3 dashboards later). They only had a limited amount of space, so they needed to be pickier than before.
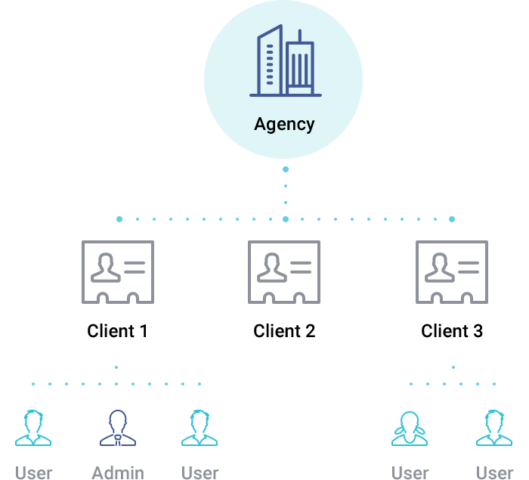
Of course, most IMPACT employees did not play a part in this process. So, Derrick Weiss, another strategist, created a 30-minute training session to teach the rest of the strategists how to use this new 3-dashboard system. After viewing the session, strategists needed to set up their clients within Databox, which can be done easily with Agency/Client accounts.
Brie did not want to be the only one that could answer questions around Databox. If she was on vacation or sick, she needed other team members to fill in. So, she made sure there was a trained member of each pod.
Step 2: The Sales Process
Since IMPACT sees its clients as partners, they focus their conversations around revenue generation early in the sales process. As talks get more serious, they bring in strategists to determine if the client’s goals are actually reasonable. IMPACT uses benchmark data to help clients determine reasonable goals. “We like using the gas gauge visualization to help clients ballpark their goals. If they tell us something like, ‘We need to triple traffic in the next three months’, we can look at current data and set expectations,” says Stacy.

When clients do not understand how well their digital marketing is performing, Brie and Stacy will use industry-specific benchmarks to give them an idea. “Sometimes, we will have a client with excellent results, and we will be very excited and ask to make them a case study. And they will say, “Oh, is this good?”. We use benchmarks to help explain those results,” says Stacy.
Step 3: Monthly Meetings
The traditional Google Sheets scorecard was hampering all of IMPACT’s efforts to become more data-driven. The time-consuming monthly data collection process caused the strategists to be a few weeks behind in their decision-making. Since they could not access data in real-time, they were forced to come to the client with plans for the following month, rather than actions they took based on the data from the previous month.
The strategists would feel the pain when they were on calls with partners. They were forced to spend time copying and pasting into the monthly scorecard, and when clients needed information outside of the scorecard, they would sift through multiple screens in HubSpot or Google Analytics until they finally found the data.
As mentioned above, IMPACT chose to roll out a three-dashboard sequence to all HubSpot clients in order to replace the scorecard. IMPACT uses a 90-day timeframe with clients and the dashboards keep the team on track to make sure they hit their monthly and quarterly goals.
“We encourage each pod to add their own Databoards on top of the standard sequence to satisfy specific partner questions. We start with three just because, as a committee, we felt these were the most universally applicable.”
 Brie Rangel
IMPACT
Here are the three Databoards they use with all HubSpot clients.
The Attract dashboard focuses on the top of the funnel. It looks at top sources of traffic and specifically zooms in on organic traffic, since that is a significant part of any inbound marketing campaign. It reviews individual blog performance based on conversion rate to determine the most successful blog topics.

The Convert dashboard investigates all types of conversions on your domain, segmented by emails, landing page and traffic source. You can identify your top sources of traffic and best landing pages. You can also make sure all your marketing efforts translate to more MQLs.

The Ascend dashboard reviews the most recent closed deals and gives a projection for deals that will close in the future. It ranks the sales members on your team. It also tracks your close rate and ensures that your sales team continues to close deals at a steady rate.
IMPACT did not stop with this sequence, however. Once data becomes readily available, clients will ask many more questions of their strategist or account manager. And, strategists can use consultative sales tactics to ensure the client understands why they chose to run certain campaigns. This sets up a longer engagement or upsell in the future.
“A lot of our strategists feel uncomfortable when the metrics aren’t just what the client wants. That can be an intimidating conversation. Our sales coach, Jack Carroll, and I led a three-hour training session on facilitating a consultative dialogue with clients.”
Brie Rangel
IMPACT
This is pivotal for the client’s satisfaction. If the strategist wants to keep the client happy and engaged with their marketing success, he or she must have the soft skills to present the data in context. For example, a strategist might see an issue with traffic and be tempted to immediately push for SEO work. The consultative selling training session helps them ask the client the right questions so that they might discover an even more pressing issue that they can solve.
To increase the internal support system even further, the team is currently running an internal competition for the best campaign to improve a specific metric for their client. The winner gets a gift card.
Step 4: Customization for Individual Clients
If clients get engaged with their marketing data, they will usually ask for some custom report or process. IMPACT has seen a variety of situations across their clientele so far.
For example, one client is in charge of marketing a mobile app, so they asked to see Mixpanel download data alongside HubSpot data. Databox connects with over 50 digital services, and one of them is Mixpanel. So, IMPACT created a custom funnel that ended in app downloads rather than opportunities and sales.
Clients will occasionally approach Stacey and ask, “If you are generating leads, why am I not making more sales?” Stacey will use the Ascend dashboard to show them the leaks in the handoff from marketing to the client’s sales team. Since the Databoards have live access URLs, the client can share the dashboard internally and ask questions to discover what is going wrong.
Some clients have asked IMPACT for updates more frequently than once a month. In the past, they didn’t have a viable solution. Now, they either share access via the live URL or schedule snapshots, which are daily or weekly automated emails that show the status of the dashboard at that point in time. This makes it easy for IMPACT’s point of contact share reports with their boss and peers in the C-suite. This is great news for IMPACT because it means the client is invested in their own success and takes their partnership seriously.
How Your Agency Can Get Started
Plenty of agencies use automated reporting to save time and money. IMPACT has gone one step further, though. They use automated dashboards to generate more revenue for their clients.
The difference is significant. Almost any agency can roll out dashboards and replace their manual reporting process. But IMPACT has committed to training their entire client services team on data-driven decision-making. This helps them make the leap from cost savings to revenue generation for both themselves and their clients.
Databox encourages all members of the Partner Program to share the best practices they have used to drive better ROI for clients. You can join for free and immediately set up your automated dashboards. We also have an exclusive Slack community and co-marketing programs for Partner Program members.
All Partner Program members get support from our Customer Success team. If you would like to get a grasp on what happens during this process, check out this comprehensive post from our CEO Pete Caputa on the DoInbound blog.