Table of contents
TL;DR
- AI hallucinations in analytics are dangerous because a fabricated metric looks identical to a real one — there is no visual cue that anything is wrong.
- Three hidden threats account for almost every case: fabricated metrics, bad input data the AI silently inherits, and wrong metric definitions applied without flag.
- Each threat is preventable, but only if you know what to ask. Seven questions separate AI tools that retrieve verified answers from AI tools that generate plausible ones.
- Databox AI is built around these seven questions — grounded in your connected data, with traceable outputs, confidence flags, and a governed metric library.
- AI works only on top of clean, connected, consistently defined data. Skip the foundation and you scale your inconsistency across the company.
Introduction
A VP of Marketing presents an AI-generated performance review on a Monday morning. The CAC numbers are clean. The trend lines are directional. The exec summary recommends a $200K budget reallocation from paid search to organic content. The CFO nods. The budget shift is approved before lunch.
Two weeks later, an analyst spot-checks one figure against the source system. The number doesn’t exist anywhere in the connected data. The AI generated it from a pattern it learned during training, presented it with the same formatting as every verified number around it, and no one caught it because there was nothing to catch — visually.
This is what AI hallucination looks like inside analytics. Not obvious nonsense. Plausible numbers, formatted identically to real ones, sitting next to verified figures that do exist. Three threats account for almost every case. None of them are visible at first glance. All three can be prevented — if you know what to ask the AI tool or the vendor selling it.
A hallucination you can spot is a bug. A hallucination you can’t is a liability.
What Counts as a Hallucination When AI Analyzes Data
An AI hallucination is content generated by an AI system that is factually incorrect but presented with full confidence. The model isn’t lying, as it has no concept of truth. It produces the most statistically plausible next token in a sequence. When that sequence describes a number your business tracks, the output can be a metric that doesn’t exist, attributed to a source that was never queried, formatted identically to every real number around it.
In a chatbot, a hallucinated restaurant recommendation gets caught; the user has independent context. In a dashboard, a hallucinated CAC or conversion rate doesn’t. The number 2.3x looks identical whether it came from Salesforce or from the model filling a gap. Research from Vectara measuring how often LLMs introduce unsupported information when summarizing source documents puts grounded hallucination rates in the low single digits for the strongest models and well into double digits for many others, and those rates climb on longer, enterprise-grade inputs.
The point isn’t the exact percentage. The point is that the rate is non-zero, the errors look identical to verified data, and the operational question is no longer “does this happen” but “what do we do about it.”
Threat 1: The Fabricated Metric That Looks Real
The most direct threat: the AI generates a number that has no basis in the underlying data.
This happens when the AI is asked about a metric it can’t actually retrieve. A general-purpose LLM analyzing a pasted CSV doesn’t pause when something is missing. It generates a plausible value based on what metrics like this usually look like for companies in your category. The output then sits in the report next to verified figures and inherits their credibility.
The hidden part isn’t the fabrication. The hidden part is that the AI shows no signal that it has done this. No confidence indicator. No source attribution. No flag that says “I estimated this.” Two metrics on the same page (one retrieved from your CRM, one fabricated from training patterns) get the same decimal precision, the same metric label, the same authoritative tone.
For a functional leader reviewing an AI-generated weekly summary, there is no visual way to tell the difference. The verification has to happen architecturally, not visually.
Threat 2: The Bad Data the AI Silently Inherits
The second threat is less about the AI and more about what you’re handing it.
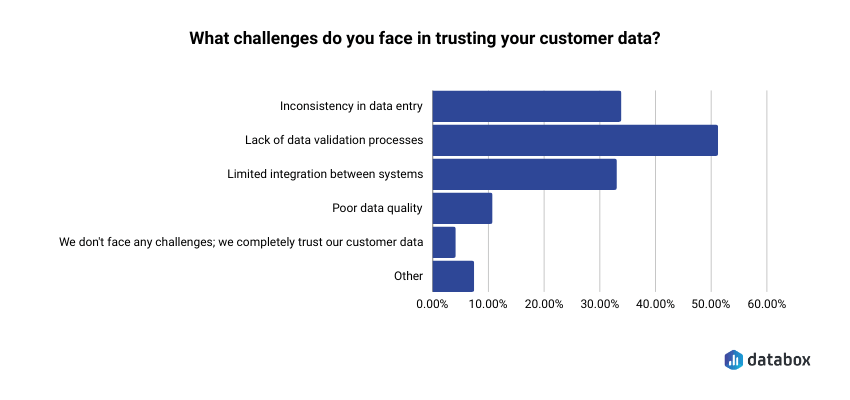
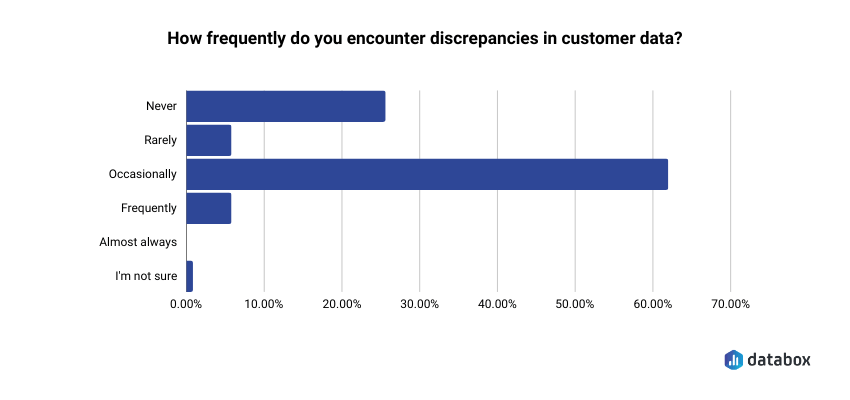
For example, Databox’s survey on managing CRM and customer data found that around 50% cite lack of data validation processes as the biggest challenge in trusting their customer data, and 60% encounter discrepancies in that data at least occasionally.
Even when leaders do submit questions to the data team, the wait is real: 64% of teams say it takes 1–3 days to gather the data needed to answer a single business question. By the time the answer arrives, the meeting has moved on, the budget has been allocated, and the campaign has been running unchanged for three days. But the speed problem is downstream of the bigger one: the person who needed the answer didn’t have a way to get it themselves.
AI doesn’t make analysts redundant. It removes the gate. When a regional manager, an account executive, or a campaign lead can ask a question in plain English and get a trustworthy answer, the analyst’s role shifts from data-pulling to strategic interpretation. The role becomes more valuable, not less, because the low-leverage work moves to the AI layer.
The company that lets more people ask better questions makes better decisions across more parts of the business. That’s the change AI is making, not just faster reports, but a wider question-asking surface.
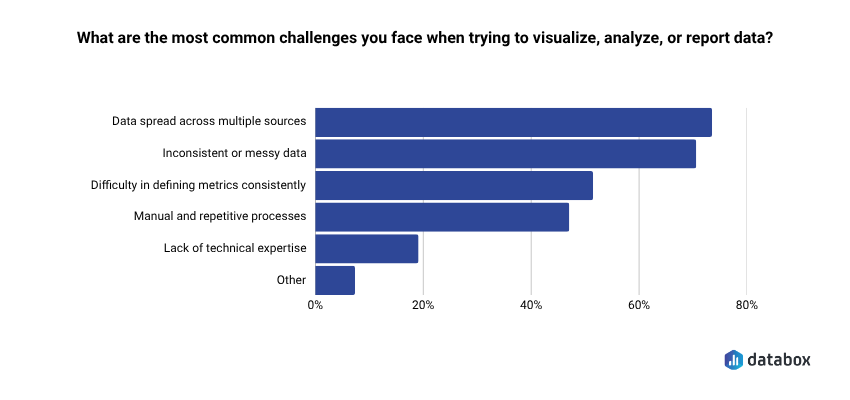
Separately, Databox’s Time to Insight research found 71.64% say inconsistent or messy data is a common challenge when trying to visualize, analyze, or report data.
AI analyzing these data sources doesn’t repair them. It analyzes them as-is and reports findings with the same confidence whether the input is clean or contaminated. A duplicate contact gets counted twice in a customer count. A misattributed deal source gets carried into a channel performance summary. A stale snapshot from last quarter gets analyzed as if it reflects this week.
This is the hidden part: the AI doesn’t tell you any of this. It can’t, because it doesn’t know. It runs the analysis on whatever it can see and delivers an answer that looks identical to one built on clean inputs. The bad data threat is not a hallucination in the strict sense; the math is correct, the inputs are real, but the output is wrong, and it lands in the same place a hallucinated metric would: a confidently delivered number nobody flags.
Threat 3: The Wrong Metric Definition Applied Without Flag
The third threat is the most organizational, and the hardest to catch.
“Revenue” means different things to different teams. Finance defines it as recognized ARR. Sales defines it as bookings. Marketing defines it as pipeline value. “Active user” means one thing in product analytics and another in marketing automation. When an AI tool is asked about any of these, it picks one interpretation and applies it consistently, without telling you which one.
Databox’s research “How Mid-Size SaaS Companies Think About Collecting, Visualizing, Analyzing, Monitoring, Reporting, and Planning on Business Data” found that over one-third say keeping metric definitions consistent across teams is not well-served by their current approach.
That misalignment doesn’t disappear when AI enters the workflow. It compounds. The AI picks a definition (often whichever appeared most frequently in training data), applies it with full confidence, and produces a number that is mathematically correct and contextually wrong for the question being asked.
A CMO and a CFO can review the same AI-generated report, agree the numbers look reasonable, and walk out operating from fundamentally different definitions of the same metric. Neither knows. The next decision built on that report inherits the disagreement.
Download our FREE guide 15 Questions That Make LLM Hallucinations Easier to Catch
– Why a hallucinated analysis is more dangerous than a hallucinated fact?
– The one question that makes good models flinch?
– How to tell if a number is being calculated or generated?
Three Definitions You Need Before Evaluating Any AI Analytics Tool
Three concepts come up in every vendor pitch and almost never get defined. Knowing what they mean is how you separate a tool that prevents hallucinations from a tool that talks about preventing them.
Retrieval-Augmented Generation (RAG) is a technical pattern where the AI is required to retrieve relevant, verified information from a defined data source before generating a response. The AI looks something up before speaking instead of answering from memory. RAG is what makes the difference between an AI that pulls your actual pipeline figure from Salesforce and one that generates a plausible estimate based on industry patterns.
A semantic layer is a governed translation layer that maps business terms to their exact, organization-approved data definitions. The semantic layer is what enforces “revenue” meaning what your organization decided it means, every time the AI is asked – across teams, across queries, without drift.
Grounding is the architectural choice to constrain AI outputs to information from a connected, verified data source. A grounded AI can only report what it can retrieve. An ungrounded AI fills gaps with the most statistically plausible completion.
These three things: grounding, RAG, and a semantic layer, are not features. They are the architecture that determines whether an AI tool can hallucinate about your metrics or not.
7 Questions That Catch Each Hidden Threat
Bring these to any AI analytics vendor conversation, or to an internal review of a tool you already use. Vague answers are answers.
1. Where do these answers come from: our live connected data, or training data and one-time exports?
A tool grounded in your live integrations is architecturally different from a tool applying a general LLM to a CSV. This question catches Threat 1 at the foundation.
2. Can every AI-generated output be traced back to a specific source metric and the integration it was pulled from?
If the answer is no, you have no way to verify which numbers are real and which were fabricated. This catches Threats 1 and 2.
3. What happens when the AI can’t answer a question from verified data: does it refuse, or does it generate an estimate?
Refusal is a feature, not a limitation. A system that fills every gap with a plausible answer is a system that hallucinates by design. This catches Threat 1.
4. Does the system flag low-confidence outputs (for example, when data is incomplete or stale) before they reach the user?
A confidence indicator is the difference between two metrics that look the same and two metrics labeled by reliability. This catches Threat 2.
5. How does the AI know which definition of “revenue” or “active user” to apply? Is there a semantic layer enforcing organization-approved definitions, or does the model pick one?
If the model picks one, you have Threat 3 baked into every output. Databox’s Time to Insight survey found 48.48% of business leaders say a single standardized definition for core metrics would most improve the trustworthiness and consistency of their reporting — this question is how you operationalize that.
6. Is the data the AI analyzes live, or a snapshot? If a snapshot, how old?
A snapshot more than a few hours old will generate analyses that look current but reflect a reality that no longer exists. This catches a quieter form of Threat 2.
7. What audit trail does the system produce? Can a finance lead or compliance officer trace any AI-generated number in a board report back to the data point and the time it was retrieved?
As AI-generated insights move into board reports and external disclosures, audit-trail expectations are following. A system with no traceable lineage is a decision risk and a compliance exposure.
A vendor who answers all seven with specifics is building for reliability. A vendor who deflects, generalizes, or pivots to talking about model accuracy is describing a product where these threats are an open variable.
How Databox AI Is Built Around These Questions
Genie, Databox’s conversational AI analyst, operates from the user’s own connected data integrations across more than 130 native sources. When a marketing leader asks Genie what’s driving the drop in MQLs this month, the answer comes from the live HubSpot and Google Ads connections, not from an LLM’s training memory. Genie retrieves before it generates. That’s the answer to questions 1 and 3.
Every AI-generated insight in Databox can be traced back to the source metric and the specific data integration it was pulled from. A CFO reviewing an AI-generated cost analysis can verify which system the number came from and when the data was last synced. That’s the answer to questions 2 and 7.
When Genie encounters a query where the connected data is incomplete or the source metric isn’t available, it surfaces the uncertainty rather than filling the gap with a plausible estimate. That’s the answer to questions 3 and 4.
Databox’s Metric Library enforces standardized definitions across connected sources. “Revenue” means what your organization defined it to mean, not what the model inferred from training data. When marketing and finance both query revenue through Genie, they get answers built on the same governed definition. That’s the answer to question 5.
Databox MCP extends this architecture to external AI tools, including Claude, ChatGPT, n8n, and Cursor. A RevOps lead querying pipeline data through Claude via MCP gets answers tied to their Databox-connected sources, not to Claude’s training data. The grounding travels with the data, regardless of which AI interface a team prefers.
The difference between AI that retrieves from your verified data and AI that generates from training patterns is the difference between a system designed to minimize hallucination risk and one where hallucinations are an unmanaged variable.
Frequently Asked Questions
Can AI hallucinations be completely eliminated?
No. Hallucinations remain a persistent challenge as long as generative AI relies on probabilistic pattern completion. The goal is systematic reduction through architecture (grounding, RAG, semantic governance) and workflow (confidence scoring, traceable outputs, human review for high-stakes decisions). Tool architecture sets the ceiling.
What’s the difference between an AI hallucination and an AI error?
An AI hallucination is incorrect content generated by AI and presented as factual with full confidence. The defining characteristic is the confident delivery, not the error itself. A calculation error is the system getting the math wrong on a real input. A hallucination is the system inventing a metric, trend, or finding with no basis in any underlying data.
How does RAG prevent AI hallucinations?
RAG requires the AI to retrieve verified information from a defined data source before generating any response. Instead of producing answers from patterns learned during training, the model queries the connected data first and generates its response from that retrieved context. It reduces the surface area where hallucinations can occur by replacing generation with retrieval for every data point the system can access.
How do I know if an AI analytics output is hallucinated?
The reliable signals are architectural, not visual. Look for outputs that can’t be traced to a source metric or integration; numbers that don’t align with the raw source system; confident answers to questions the AI shouldn’t be able to answer from its connected data; and metric definitions that don’t match your organization’s agreed-upon terms. A tool that provides source attribution, confidence indicators, and refusal mechanisms is one designed to make these threats catchable.