


Table of contents
Tracking your website’s page performance is one of Google Analytics’ most powerful features.
Not only do you get insight into what pages are getting the most traffic and engagement, but you also get a deeper look into how your users interact with them, where they spend the most time, which content they find the most interesting, and more.
This type of insight is crucial for keeping your website performance in check and staying on top of visitor preferences.
Now, even though pageview reports are so important, many marketers still struggle to fully understand how they work and how best to use them.
And the problem is especially evident nowadays with the sunset of Universal Analytics and the transition to Google Analytics 4.
As reporting models evolve in GA4, many teams also rethink how they interpret pageview data day to day. Instead of manually comparing date ranges or building custom explorations, teams now use AI data analysts, like Databox MCP, to ask simple questions about performance in plain English. Because it works with your actual metrics, definitions, and historical data, it can explain why pageviews increased or dropped, how engagement changed over time, and whether shifts are part of a longer trend or a short-term spike. This helps turn raw pageview reports into clearer, more actionable insight.
In this article, we’ll take a look at how the pages and screen report in GA4 works, what’s different compared to UA, how to set up the reports, how to customize and read the report, and some of the best practices to follow.
Let’s dive in.
- What Are Pageviews in Google Analytics
- Google Analytics Pageviews Report vs. Pages and Screens Report in GA4
- Google Analytics Pageviews Report Best Practices
- Monitor Your Most Important Google Analytics 4 Metrics in Databox

What Are Pageviews in Google Analytics
Pageviews is a Google Analytics metric that counts the total number of times a page is viewed.
A pageview is recorded each time a user accesses a specific page, regardless of whether it’s a new or returning user.
Now, there have been quite a few changes to both the pageviews metric and the pageviews report with the release of GA4, so let’s take a look at some useful information below:
Pageviews in Google Analytics 4
In Google Analytics 4, pageviews refer to the metric that measures the total number of times a page on your website or app that a user views.
In GA4, unique pageviews are recorded as an event called “page_view” and are automatically tracked without the need for additional code implementation.
Compared to Universal Analytics, GA4 places greater emphasis on analyzing events rather than traditional pageviews alone to gain a deeper understanding of user engagement and conversion paths.
This shift allows for a more flexible and comprehensive analysis of user behavior across different platforms and devices.
The metric can be found in the Pages and Screens Report, but we’ll talk more about how to find and read it later.
What’s a Good Number of Pageviews a Month?
According to Databox’s own Benchmark data, the median value for the number of pageviews for B2B companies is 6.6K a month.
This benchmark was calculated from anonymized data from close to 4000 companies. Are you a B2B company and want to benchmark your marketing performance, including Sessions, Users, Avg. Session Duration, and more, against other companies like yours? Join the Benchmark Group for free.
For B2C companies, the median value is 3.31K per month. This benchmark was calculated from anonymized data from over 2200 companies.
Are you a B2C company and want to benchmark your marketing performance against hundreds of other companies like yours? Join the Benchmark Group for free.

*Important note: Databox Benchmark Groups show median values. The median is calculated by taking the “middle” value, the value for which half of the observations are larger, and half are smaller. The average is calculated by adding up all of the individual values and dividing this total by the number of observations. While both are measures of central tendency, when there is a possibility of extreme values, the median is generally the better measure to use.
Instantly and Anonymously Benchmark Your Company’s Performance Against Others Just Like You
If you ever asked yourself:
- How does our marketing stack up against our competitors?
- Are our salespeople as productive as reps from similar companies?
- Are our profit margins as high as our peers?
Databox Benchmark Groups can finally help you answer these questions and discover how your company measures up against similar companies based on your KPIs.
When you join Benchmark Groups, you will:
- Get instant, up-to-date data on how your company stacks up against similar companies based on the metrics most important to you. Explore benchmarks for dozens of metrics, built on anonymized data from thousands of companies and get a full 360° view of your company’s KPIs across sales, marketing, finance, and more.
- Understand where your business excels and where you may be falling behind so you can shift to what will make the biggest impact. Leverage industry insights to set more effective, competitive business strategies. Explore where exactly you have room for growth within your business based on objective market data.
- Keep your clients happy by using data to back up your expertise. Show your clients where you’re helping them overperform against similar companies. Use the data to show prospects where they really are… and the potential of where they could be.
- Get a valuable asset for improving yearly and quarterly planning. Get valuable insights into areas that need more work. Gain more context for strategic planning.
The best part?
- Benchmark Groups are free to access.
- The data is 100% anonymized. No other company will be able to see your performance, and you won’t be able to see the performance of individual companies either.
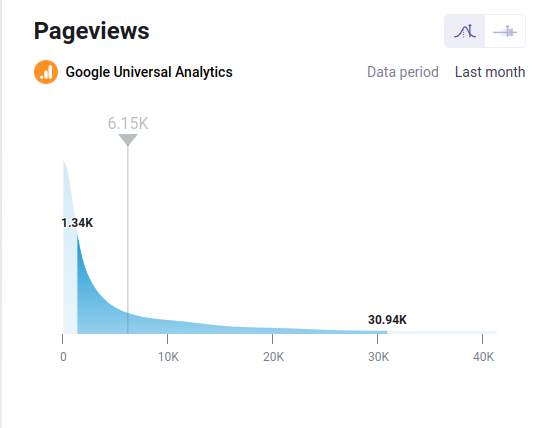
When it comes to showing you how your performance compares to others, here is what it might look like for the metric Average Session Duration:

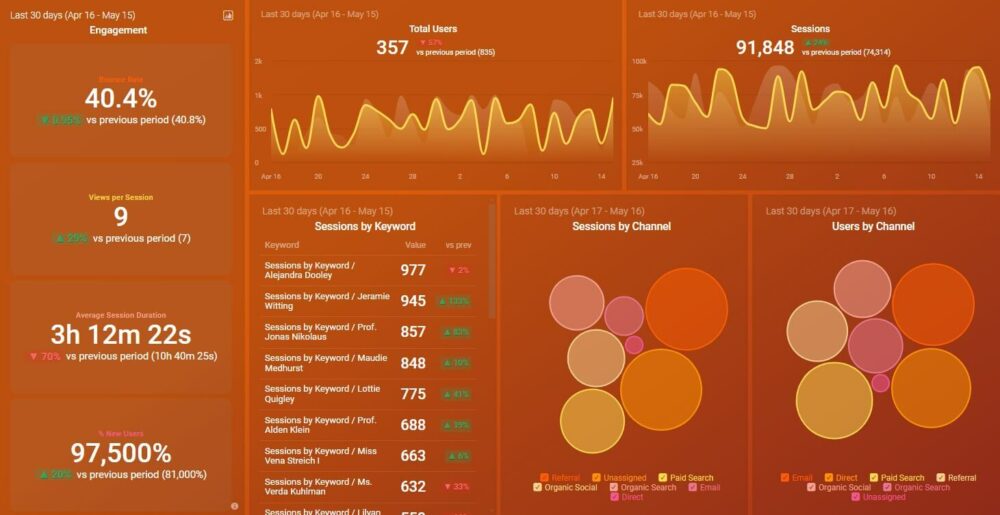
And here is an example of an open group you could join:

And this is just a fraction of what you’ll get. With Databox Benchmarks, you will need only one spot to see how all of your teams stack up — marketing, sales, customer service, product development, finance, and more.
- Choose criteria so that the Benchmark is calculated using only companies like yours
- Narrow the benchmark sample using criteria that describe your company
- Display benchmarks right on your Databox dashboards
Sounds like something you want to try out? Join a Databox Benchmark Group today!
Google Analytics Pageviews Report vs. Pages and Screens Report in GA4
Pageview reports are one of the most popular Google Analytics reports; they give you comprehensive details of your website’s overall performance.
You get information about where people are coming from, what pages they are viewing, what time of the day they visit your website, and more.
In Google Analytics 4, this report is now known as the Pages and Screens report.
Here, it specifically shows which website pages and app screens users are visiting and interacting with.
You can set up different dimensions and metrics for each page and customize which segments you want to see in the pages and screens report, which makes for a much more granular analysis.
Now, some might find the term “screens” a bit confusing at first, but it’s actually pretty simple.
Screens are basically the same as pages, but GA4 tracks them as what visitors look at within mobile apps specifically.
Overall, the pages and screens report in GA4 gives you data on what pages users interact with the most, where they spend the most time, which pages are underperforming, and a lot more.
Now, let’s go deeper down the rabbit hole and take a look at how you can access the report and analyze it properly:
- How to Access the Pages and Screens Report?
- How to Read and Customize the Pages and Screens Report
- Recap: How is Google Analytics 4 Pages and Screens Report Different from Pageviews Report in UA?
How to Access the Pages and Screens Report?
Even though most things in GA4 seem complex at first, finding the pages and screens report isn’t one of them.
All you have to do is go to Engagement > Pages and Screens (on the left menu once you log in).

Within the report, you can find different metrics and dimensions and customize them by creating different segments and adding secondary dimensions that you want to track as well.
Compared to the Pageviews report in Universal Analytics, this one is a lot more granular in terms of what insights you can extract.
Unfortunately, you can’t access historical pageview data from your Universal Analytics account. But if you’re an existing Databox user and have used GA dashboards in the past, you can still find your data in the app.
How to Read and Customize the Pages and Screens Report
Now you know where to find the report, so let’s move on to the actual analysis and customization.
Once you open the report, you’ll notice that there are different page titles and screen class data segments. In a nutshell, this is all of your web pages, categorized by page title and screen name.
There are two graphs next to each other, with the one on the left displaying the most popular pages and the right one displaying user and new user data.

Below, there’s a detailed breakdown of each segment (page/screen), categorized by website and mobile apps. See which pages and screens get the most views, average engagement time, top events, top conversions, and more.

Customizing the Report
There are a few different ways you can go about customization.
The first option is to create comparisons, which is available for all Google Analytics 4 reports. For this, you just toggle to the top right and click on “Add Comparison”.
Comparisons allow you to set up an additional layer for each report visual you want to focus on, helping you focus on more specific events/cohorts.
For instance, you can check out which pages female visitors interact with the most.
To build a comparison, first, click on “Add Comparison.”
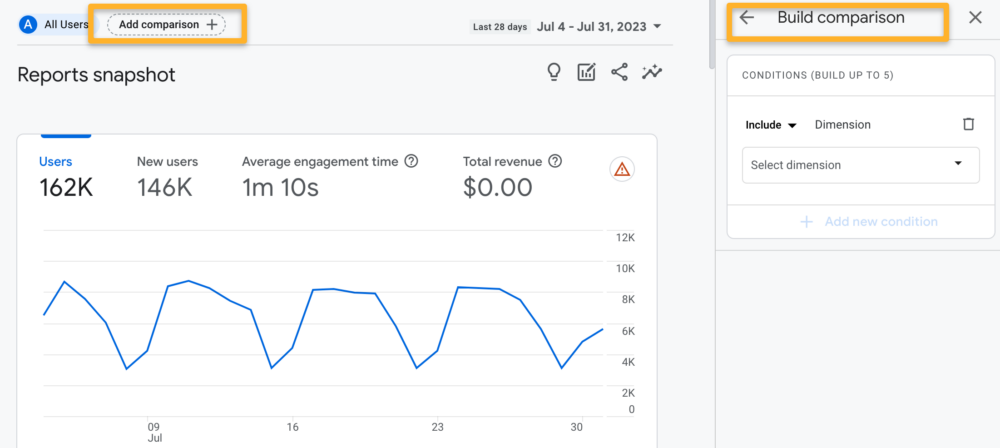
Under “Include,” simply select your preferred dimension (like gender) and choose the value (such as “female”) By the way, with the “Add condition” option, you can add several dimensions within a single comparison.
When you want to delete the comparison, just press the “X” on the top right.
You can further customize your report by adding additional categories to it.
Simply go to the bottom of the pages and screens report and press “+” to add another dimension.
Recap: How Is Google Analytics 4 Pages and Screens Report Different from The Pageviews Report in UA?
While some marketers are still nostalgic for the Pageviews report in Universal Analytics, the GA4 Pages and Screens report actually provides a lot more insight into your performance.
But even though the objective is the same, there are several things that have been changed and upgraded in GA4.
For starters, you’ll notice there are no longer metrics such as exits, bounce rate, or average time on page present in GA4.
These have been replaced with new metrics that do focus on the same parameters but have been modified with the aim of simplifying the reporting and analysis processes.
For instance, instead of average time on page, you’ll now get average engagement time that shows the amount of time users remain engaged on each page (a bit more advanced than just “spending time” there).
Also, because GA4 properties are mobile-first focused, landing pages aren’t as relevant as they used to be and it’s why there aren’t any landing page/screens reports within the platform anymore.
Events-based models are at the heart of GA4 now, not sessions.
Overall, the best way to get on top of GA4 is to start exploring the new interface and go through all the different dimensions, metrics, and capabilities.
If you’ve spent a lot of time in UA, you’ll quickly get a feel for what’s changed and what’s been “repackaged”, so to say.
Google Analytics Pageviews Reports Best Practices
Want to learn how to take advantage of the Pages and Screens report in GA4?
Here are some of the best practices you should follow:
- Use Content Grouping for More Granular Analysis
- Use the Operating Systems Metric to Better Understand Mobile and Desktop Performance
- Take Time to Learn How Dimensions Work
- Leverage Comparisons to Track Data Over Time
PRO TIP: Save Time Creating Your Google Analytics 4 Traffic Dashboard
Yes, you can DIY in Google Analytics 4, but what if you would prefer a simpler, easier route? After all, once you learn how it’s done, you still have to choose the right metrics and design your custom dashboard to answer the important questions your stakeholders have, for example:
- How many people are visiting my website?
- Which channels bring in the most users?
- How engaged are my users?
- How well is my website keyword optimization performing?
and more…
Now you can benefit from the experience of Google Analytics experts, who have put together a great Databox template showing all the most important website traffic KPIs. This template allows for easy integration with scheduled report delivery. It’s simple to implement and start using as a standalone dashboard or in marketing reports!
You can easily set it up in just a few clicks – no coding required.
To set up the dashboard, follow these 3 simple steps:
Step 1: Get the template
Step 2: Connect your Google Analytics 4 account with Databox.
Step 3: Watch your dashboard populate in seconds.
Use Content Grouping for More Granular Analysis
Content grouping is one of the best customization options for deeper pageview analysis. This feature allows you to group similar pages into standalone cohorts.
Say you run an e-commerce website – you can use the content grouping option to create groups for products and checkout pages (e.g.), and use that segment for clearer analysis.
Another way to use it is to create topic groups for your website’s blog. If you talk about email marketing, SEO, and paid advertising, you can create a separate group for each topic.
This way, marketers can analyze pages faster and more effectively, and also spot any potential gaps for improvement.
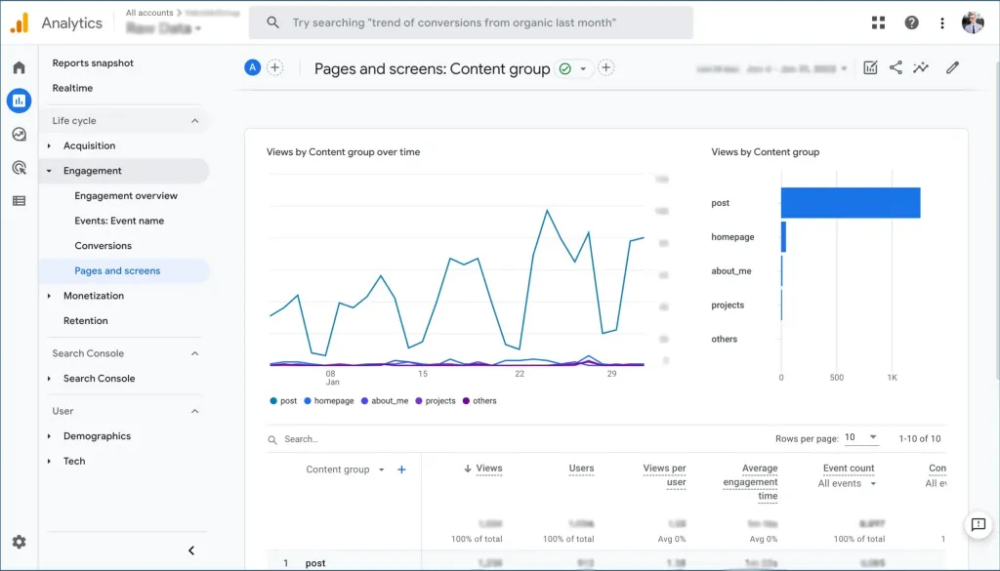
To set up content grouping, you can use Google Tag Manager to modify your GA4 “configure tag” and have it immediately pop up in the report.

This is what it will look like in the Pages and Screens report.
Use the Operating Systems Metric to Better Understand Mobile and Desktop Performance
This part of the report analysis is just as important as it was in UA.
To better understand the performance of your pages and know what to focus on improving, you need insight into both your website and mobile app visitors.
You can check this out by adding the Operating System (OS) metric to the report and segmenting the visitors.
With this metric, you’ll immediately notice if any visitors are having issues with accessing particular pages on mobile and find low-hanging fruit opportunities that can massively boost engagement and conversions.
Take Time to Learn How Dimensions Work
Yes, Google Analytics 4 reports come with a lot more actionable insight compared to Universal Analytics… but you need to understand how they work to take full advantage of them.
One of the first things you can do about this is to start reading about dimensions in GA4 reports.
Dimensions can add a whole new, well, dimension to your reporting process, and they help you zero in on specific data that’s much more relevant to your business than what’s automatically populated in GA4.
For the Pages and Screens report, you can check out Google’s official table with different dimensions and how they work here.
Related: Google Analytics 4 Custom Dimensions 101 Guide
Leverage Comparisons to Track Data Over Time
We briefly mentioned comparisons earlier, but let’s get into a bit more detail on this useful feature that can bring a lot of useful insight if used properly.
Comparisons allow you to compare metrics and dimensions across different date ranges or segments. It helps you understand how your website or app performs compared to previous periods or specific data segments.
Once you set up comparisons, you essentially get visual layers on top of graphs that give a side-by-side view of the data subsets you want to analyze.
Here’s what you’ll see in the report once you set up a comparison.

Monitor Your Most Important Google Analytics 4 Metrics in Databox
Sure, Google Analytics 4 has introduced a bunch of new features and customizations you can use to get more actionable data at your fingertips in the built-in reports.
But the platform is still far from intuitive.
Plus, so many marketers are still struggling with the transition from UA due to the vast number of changes and upgrades to past features and metrics.
To simplify the transition process and learn the ropes the easy way, you can turn to Databox.
With Databox, you can integrate your Google Analytics 4 account and create easy-to-use dashboards that contain all of your most relevant metrics and KPIs in one place (and it will only take you minutes to do it).
You can also use our Databox Google Analytics Databoard Transition Tool to help you transition your Google Analytics Universal dashboards to display Google Analytics 4 data in just a few clicks.
In just a few clicks, you can connect your account, cherry-pick the metrics you want to track and drag them to the dashboard, and then transform the data into professional visuals.
You can use our 100+ dashboard template library to create and customize your GA4 dashboard based on your specific objectives.
Keep in mind that we have a lot of templates that contain pageviews in the way you used to see them in UA. This can help you kickstart the GA4 reporting process a lot quicker instead of going through everything manually at once.
And if you just don’t have enough time yet to build GA4 reports and make sense of your performance data, we have a free GA4 setup service – contact our team and we’ll build you a dashboard for free and assist with the data analysis process.
Sign up for a free trial and let Databox smoothen the transition to Google Analytics 4.


