Table of contents
Since we created the Databox Partner Program in January 2017, over 120 digital marketing agencies have joined us in our mission to make marketing more data-driven.
More than 80 of those agencies are also part of HubSpot’s Agency Partner Program, so we hear a lot about the latest and greatest tools used by top inbound marketers.
“Do you integrate with Wistia?” was one of the most common questions we’d get. Some of our long-time partners who are also tiered Wistia partners — like Nextiny Marketing, Prism Global Marketing, StoryTeller and ConnectEngine — asked us over and over again.
So, we finally made it happen. Now, we can pull 30+ metrics from Wistia so that you can view your Wistia data alongside data from services like HubSpot, Google Analytics, MailChimp and Shopify.
When we learned that we are the 9th most popular partner integration at INBOUND17 (based on number of installs), and Wistia is the 6th most popular, we knew we made the right call.
In case you have been living under a rock, though, and haven’t heard of Wistia, it is a video hosting tool built to support the needs of B2B marketing. It provides analytics and call-to-action capabilities that go far beyond your typical embedded YouTube video.
How the Integration Works
If you are looking to monitor and show clients the ROI your video marketing services are producing, this integration is for you. You can track all your KPIs up to the latest hour, so there is no need to log into every service and copy and paste data or graphs before the monthly meeting. Our automated dashboards eliminate all of the manual tasks involved in reporting!
There are two ways to get started: You can connect your Wistia account and create a dashboard from scratch using our Report Designer, or you can use a template from our Template Gallery to start with a pre-built dashboard (examples below).
If you aren’t using Databox yet, you first need to create a free Agency Databox Account. After that, head over to the Data Manager and click ‘+New Connection’.
Every free agency account comes with 10 client accounts included. So, if there is one standard report you like to use for reporting video metrics, you should create it in the top-level agency account first. Then, you can easily push into your clients’ accounts.
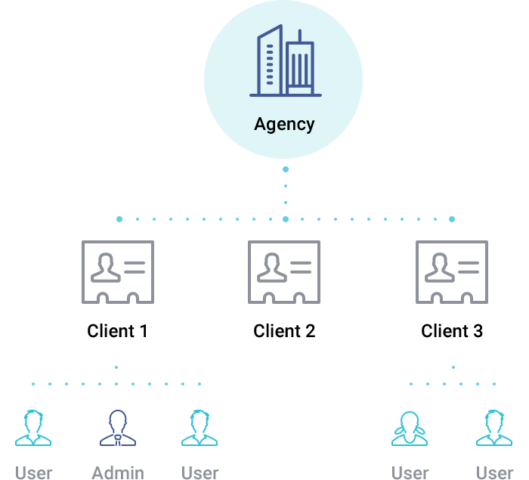
After you have created a report that you love, you can begin passing it down to client accounts. First, create a new client.
Then, share the dashboard with that client account.

Finally, log in to that particular client account. You need to connect your client’s Wistia account to their account within Databox in the same way you added your own account. More details on this process are here.
1-Click Wistia Reporting Templates
You can use the report templates below to instantly visualize data from Wistia alongside data from other services.
Wistia Alone

This dashboard gives you a high-level overview of all your Wistia metrics. It highlights your most-played videos and projects. You can then find your viewers’ favorite content.
Key Metrics
- Daily Plays
- Average View Time
- Top Videos by Plays
- Top Channels for Acquisition
- Total Hours Watched, by Day
Wistia + Google Analytics

This dashboard gives you more insight into the ways that video impacts site behavior. You are probably curious about metrics beyond video plays and conversions. By adding Google Analytics data, you can see how videos affect session length, number of pages viewed and other behavioral metrics. The graphs on the right specifically look at sessions that include a video play, and sessions that include an email form submission.
Key Metrics
- Total Plays, Visitors
- Top Videos by Plays
- Play Rate by Video
- Performance by Ad
- Sessions w/ a Video Play
- Sessions w/ an Email Submission
Wistia + HubSpot
Wistia passes plenty of contact-specific data into HubSpot. Leveraging the integration, you can determine how many contacts watched a video with ‘SaaS’ in the title and later became opportunities by creating a Smart List using those parameters.
Then in Databox, you can graph the growth of this list to see how many leads those videos generate.

You just need to use the ‘Contacts by Smart List’ metric, and then choose the Smart List you created.
Browse through more video marketing dashboards here.
Eliminate the Annoying Parts of Reporting Video Metrics
Tired of spending hours cutting and pasting data into your monthly report decks?
If so, sign up for a free Databox account and immediately begin tracking data from up to 3 sources for up to 10 clients on any device — desktop, TV, mobile and Slack.
Once you eliminate the time-consuming parts of reporting and start monitoring your team’s performance in real-time against your clients’ goals, you can spend much more time analyzing and improving results.
If you really want to blow your client’s mind, use Wistia’s Soapbox and Databox together to send your analysis. If you’re unfamiliar with Soapbox, it is a free Chrome Extension from Wistia that allows you to instantly begin recording yourself alongside a screencast.
Some agencies use Soapbox to record explanations of their client’s digital marketing data as shown in Databox dashboards. Rather than spending half an hour typing up a report in Powerpoint or Keynote, they just record their analysis and send off a video recording to their clients.
“By recording our analysis on video, clients can see and hear us explain each graph and datapoint. It also helps them get comfortable with monitoring the Databoards in real-time, since we can explain each data point in our videos. Compared to a powerpoint document (that’s time-consuming to produce and immediately out-of-date), a Soapbox video of Databox dashboards is a more effective way to communicate our value. Plus, we can even track whether they watched it. ”
 Gabriel Marguglio
CEO of Nextiny Marketing, a Wistia Gold Partner
Want to follow in the footsteps of top Wistia partners like Nextiny? Start here.