


Table of contents
Let’s face it, financial and operational reporting isn’t exactly the loveliest topic in the world of business.
Everyone knows we need it, but few have time or energy to devote to doing it well.
Do you get reports that truly reflect the current situation of your business? Or do you get canned reports that are nothing more than a “warts and all” reflection of historical data? Let’s face it – 90% of the time, we aren’t getting the most from our business systems and tools.
Have you ever seen a report that looks like it was created by the artist formerly known as Prince? I don’t mean the gravel-voiced poet laureate of Minneapolis, either, I mean The Artist Formerly Known as Prince — the one who wrote “Purple Rain.”
Well, guess what, it’s possible to match DATA and ART and put it into an artistic masterpiece – a report that deserves to be framed. From deep color and brilliant font choices to thoughtful positioning of the analysis so that the reader can enjoy it. Yes, we’re being a little tongue-in-cheek here, but we’re also highly aware of the fact that many analytics reports are little more than statistical exhibitions of flat numbers in dull text boxes.
With data warehouse reporting, you can easily transform large amounts of data into valuable business insights from multiple sources. And the best part is – It’s an automated and easy process with the possibility to get artistic reporting results.
In this guide, we will explain to you exactly what data warehouse reporting is, how it works, and how you can use it to help improve reporting within your company.
Stay tuned ’till the end!
- What is a Data Warehouse?
- 5 Reasons How a Data Warehouse Improves Business Reporting
- Data Warehouse Reporting Best Practices
- Data Warehouse Tools to Help You Get Started
- Visualize Important Business Data from Your Company’s Databases

What is a Data Warehouse?
The definition of a data warehouse can be confusing — there is different interpretation and disagreement, even among industry leaders. To most, the data warehouse seems like a silver bullet, but to many companies, it amounts to nothing more than overspending on storage.
Data warehouse reporting may sound like a scary and mysterious concept, but it’s actually very easy to understand.
Data warehousing is a business intelligence solution that organizes your company’s data into virtual warehouses. It allows you to view a single consistent picture of your customers, products and services, and business performance. A data warehouse is a single repository of information that has been transformed into a composite view that enables users to have a complete and accurate picture of their business.
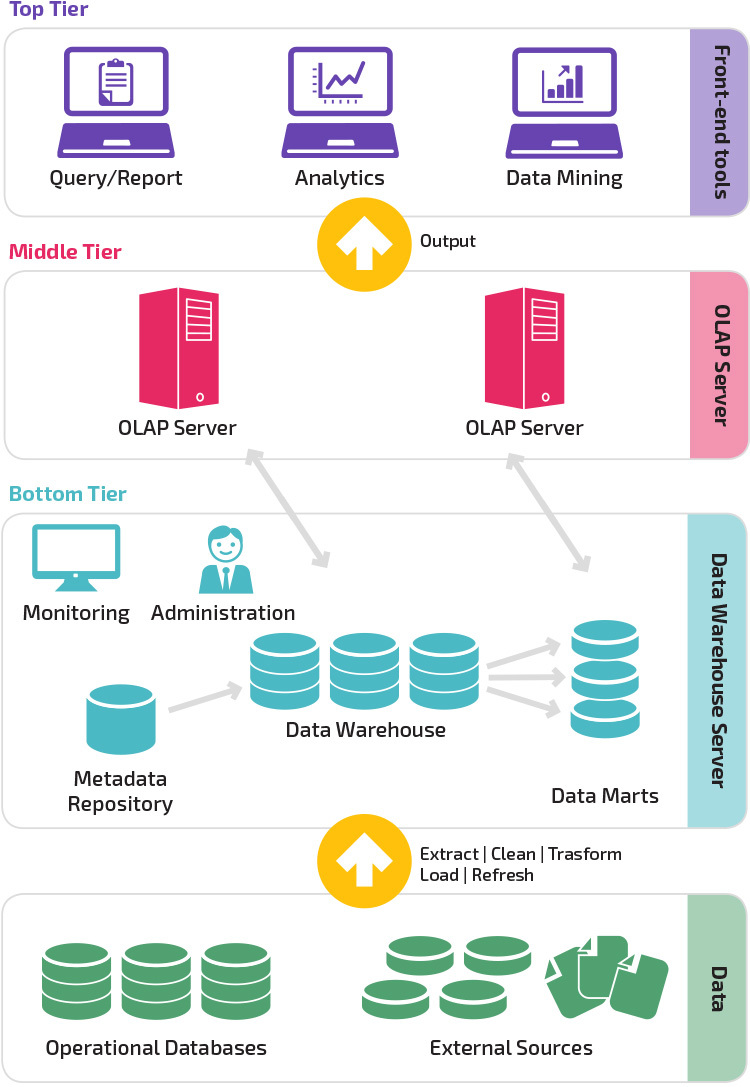
The data warehouse is not a product but an environment that pulls together data from multiple sources – much of it OLTP data – and stores it in an organized way, ideally in the same structure or data model as the business intelligence tool or application.
Your data warehouse is a goldmine of valuable information. But, getting to this gold means digging through a lot of dirt. How can you mine useful insights and gold from your data warehouse? Fortunately, there are some proven data warehouse reporting techniques that help you sift through the dirt and pull out valuable insights.
But before we cover them let’s see the impact a data warehouse has on business reporting.
5 Reasons How a Data Warehouse Improves Business Reporting
Here are 5 reasons how data warehouse helps improve business reporting:
1. Produce more meaningful reports with structured data
The main purpose of a data warehouse is to make it easy for end-users to analyze data by providing better access and controls over the information being analyzed. Trying to report from a transactional database is usually not very effective. This is because the data has not been structured and labeled specifically for reporting.
Structured data in a data warehouse makes it easier to produce meaningful reports. The structured data provided by a good data warehouse makes it possible for the user to ask more meaningful questions and obtain more useful answers.
A data warehouse is implemented differently than other types of databases used in business applications. It is designed to maximize access to historical data and facilitate more detailed queries and analysis over multiple years, months, or even days of information. In order to do this, it needs to store large amounts of raw data.
Related: What Is Data Reporting and How to Create Data Reports for Your Business
2. Bring together multiple data sources into one place
Data warehouses can include data from a range of different sources and are often created for a specific purpose. For example, a customer relationship management (CRM) system is usually designed to store information about customers and interactions with them. It may also store information about suppliers and/or employees. A data warehouse could contain this information although it may also contain other non-CRM information such as financial or sales data.
While reporting from an individual data source can be done using the business intelligence tools embedded in most analytics applications, to get the full picture of your business you need to bring together multiple data sources into one place.
3. Improve historical reporting and trend analysis
A data warehouse is built over time by loading details from transactional systems into a staging table where they can be transformed and cleansed, then loaded into the data warehouse itself. As your business grows, you can continue to expand the data warehouse with additional information and metrics over time.
Data warehouses must be designed carefully, as they contain large amounts of sensitive information. They are used by organizations to compare their current performance against historical trends, allowing them to make informed decisions about future plans and projects.
4. Improve ROI
Use a data warehouse as the foundation for your self-service BI application. You can use more sophisticated analytics tools with a self-service BI application when it has access to a data warehouse for business reporting.
To ensure a positive ROI on your self-service BI program, you need strong data governance software with robust user access review capabilities that will limit access to sensitive information and provide training on best practices. Without it, not only will you not derive enough value from your BI program, but you may also set up a culture of fear and distrust around analytics.
5. Save time and reduce reporting errors
There are some pretty compelling and clear advantages to having a data warehouse in place. Not only does it eliminate the need to manually collect, clean and present data, but it also allows you to produce reports more quickly and easily.
Data warehouse standard reports aren’t exciting, but they do provide valuable insights into your business. Giving business users access to self-service reporting capabilities makes them more productive while freeing up the time of data specialists to focus on more complex analysis.
However, data warehouse reporting can offer a lot more value and insight than traditional reports. These five reasons explain why that is true. If your business has a lot of data and needs to make better decisions, implementing a data warehouse might be the right move for your company.
Data Warehouse Reporting Best Practices
Well, it might seem overwhelming to build and maintain a data warehouse. But, with a good plan, you can build one without too much hassle. Here are 7 best practices for building a data warehouse for your organization:
1. Identify The Need for Data Warehouse
To understand why organizations are adopting the concept of a data warehouse, let’s first understand why they need one.
Data warehouses are useful for businesses that want to make use of their vast stores of raw business information by analyzing it and turning it into valuable insights. If you already have a system that works well, then it’s unlikely you’ll be able to justify the expense required in setting up a data warehouse. When you do decide that a data warehouse could benefit your business, the next step is figuring out what kind of data warehouse will work best for your needs.
There are two main types: operational (OLTP) and analytical (OLAP). An OLTP database focuses on day-to-day operations and contains information about existing products, customers, and staff. An OLAP database contains historical information that can help you find trends.
2. Avoid the ‘Big Bang Approach’
The big bang approach has two major issues:
Businesses cannot realize any value from their investment – They don’t see immediate results from their investment in a data warehouse. The implementation can take months or years. During that time, the business does not get anything tangible back from its investment in the project.
The business requirements development over time – People figure out what else they want to do with the data warehouse once it’s complete. Businesses put the project on hold as they don’t see immediate results and their requirements change.
The only way to avoid these issues is to have an agile approach. You should build the warehouse in smaller chunks so that you can deliver value faster and respond quickly to changing business requirements. With an agile approach, business analysts can request specific reports and run analytics whenever needed. Another benefit of creating an agile approach is that the data warehouse can be adjusted to fit the specific needs of every industry, company, or vertical.
3. Analyze And Understand Data
Data warehouses are a major component of the Business Intelligence (BI) system. They are used to consolidate large volumes of data from operational systems, transforming them into a form more useful for analysis and enabling decision making. In the past few years, it has become clear that traditional data warehouses are not suitable for online analytical processing (OLAP). For this reason, alternative OLAP tools have been developed that are specifically designed for fast and flexible data analysis.
4. Decide How Frequently You Need to Load Data
How often you load records into the data warehouse depends on the requirements of your organization, but it’s usually at least once per day. For example, if it’s a retail store and you process transactions every day, then you’ll want to load transactions into the data warehouse every day. If it’s more of an online business where there are thousands of transactions happening in real-time, then you may only load transactions once every hour or two hours.
5. Define a Change Data Capture (CDC) Policy for Real-Time Data
The change data capture (CDC) approach is a very useful mechanism for replicating changes in the source systems to the data warehouse. It uses change tables to capture changes made in the original source tables and brings these changes into the data warehouse. This mechanism helps reduce the impact of large-volume updates on source systems. It also provides a view of the historical data that has changed over time.
6. Use ELT Tools Instead of ETL
While the ETL and ELT methods both appear similar, ELT is a more simplified version of ETL.
ELT eliminates some of the data cleansing and transformation steps in the process, making it easier to implement but also potentially resulting in more data errors. The main difference between these two methods is that an ELT method allows for more flexible storage and retrieval of information. This flexibility allows you to store new, unstructured data without worrying about cleaning or transforming it before adding it to your data warehouse. This can be helpful because the process of cleaning and transforming data takes time, and it may not always be necessary depending on what type of analysis you are performing.
ELT does have a potential downside, though: The lack of consistency between stored information can create inconsistencies during reporting. If you use ELT instead of ETL, you should make sure that your BI tools are flexible enough to handle this type of data inconsistency – otherwise, your reports could turn out inaccurate.
7. Choose Between On-Premise or in the Cloud
There are two approaches to building a data warehouse: On-premises (self-hosted) and Cloud-based.
The traditional approach to implementing a data warehouse is to invest in hardware, software, and staff on-site in your own data center. This is the most costly option and is typically only used by organizations with large amounts of data and complex requirements for systems integration. These characteristics are common in the financial services industry, where regulations require strict control over sensitive data.
A cloud is a growing option for organizations looking for cost savings and increased agility. A cloud-based data warehouse can be an attractive solution when you have lower volumes of less complex data with limited processing needs. The cloud provides easier access to all your organization’s relevant information, improves IT efficiency, allows faster time to insight, and enables quicker business decisions with better access to analytics within an enterprise.
Data Warehouse Tools to Help You Get Started
With the help of Data Warehouse tools, you can store, manage, process and analyze your business data more effectively. We provide you with a list of top-notch data warehouse tools:
1. Amazon Redshift
Fully managed data warehouse solution that makes it easy to securely and cost-effectively store and analyze any amount of data in AWS.
The most significant feature of Amazon Redshift is that it can provide petabyte-scale datasets with very fast query response times and ultra-low latency. Also, you can easily scale up or down as your data volume changes by just specifying the amount of computing power you need for your business. It’s built on a columnar storage format which compresses data much more efficiently than row-based storage formats like ORC or Parquet.
Databox integrates with Amazon Redshift. We recommend using Amazon Redshift queries to pull data from your proprietary database and showcase it alongside data from popular services like Mixpanel, Google Analytics and Salesforce. See more information about connecting your Databox account with Amazon Redshift here.
2. Microsoft Azure
Microsoft Azure is a cloud computing platform and infrastructure for building, deploying, and managing applications and services through a global network of Microsoft-managed datacenters. Azure offers services, platforms, and infrastructure for both developers and IT professionals to create hybrid applications. Microsoft positioned Azure as a competitor to Amazon Web Services (AWS), Google Cloud Platform (GCP), IBM SoftLayer, and Oracle Cloud Infrastructure as part of a new “cloud computing” department within Microsoft.
Here’s more information on how to use your Microsoft SQL Server with Databox. And if your data is already connected, we suggest trying out one of our free IT dashboard templates.
Track and visualize data from MySQL and Microsoft SQL Server alongside 100+ other popular integrations in real-time from our library of pre-built templates. Just download any template for free, connect your data, and get instant visualizations of things like query performance, total connections (active and inactive), buffer pool stage, slow queries, and more.
3. Google BigQuery
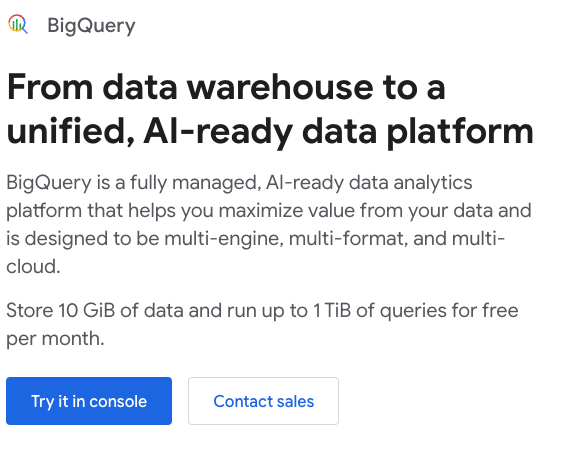
Google BigQuery is an analytics platform maintained by Google that allows users to perform very fast analyses of large datasets. Google BigQuery is a serverless data warehouse, similar to Apache Hive and Apache Spark. The product was announced in 2010 and became available for commercial use in 2011.
It’s a fully managed, petabyte-scale, low-cost analytics data warehouse that lets you query terabytes to petabytes of data, using the same SQL-like language used by popular business intelligence tools like Tableau and Qlik.
BigQuery is a hybrid system that enables the storage of information in columns, however, it takes into the NoSQL additional features, like the data type and the nested feature. BigQuery can have up to 100 concurrent users.
Here’s more information on how to connect and visualize data from a Google BigQuery database in Databox.
4. PostgreSQL
PostgreSQL is a database management system (DBMS) that is especially used for data warehouses. SQL Server is a DBMS that is especially used for e-commerce and other data warehousing solutions. Postgres is a feature-rich DBMS that can handle complicated queries and big databases.
MySQL is a simpler DBMS that’s comparatively simple to line up and manage, fast, reliable, and well-understood. PostgreSQL performs well in OLTP/OLAP systems once read/write speeds are needed and intensive data analysis needs to be performed.
PostgreSQL can exist configured to run very efficiently in a database server machine, functioning at the same time as a web or application server.
If you have your data from a PostgreSQL database ready, you can visualize it in Databox. Find out how here.
5. Oracle Autonomous Warehouse
In Oracle Autonomous Warehouse, the inbuilt self-service tools including a mobile app and a dedicated web portal allow users to define cubes and views that contain data from Oracle, Data Hubs, and third-party data sources. It also helps users to make custom queries on data sources that can be used as an analysis cube or a dimension table. With an Autonomous Data Warehouse, you can simply construct a data warehouse, secure it, scale it, and back it up without having to be concerned about the complex processes involved in doing so. An autonomous data Warehouse has multi-model data capabilities and supports multiple workloads within one platform for fast implementation and results.
6. Snowflake
Snowflake is a kind of data warehouse that Amazon Web Services (AWS) built on top of the cloud. With Snowflake, users can store their data at a low cost. Snowflake storage value is similar to storing data on Amazon S3. AWS tried to solve this issue with Redshift Spectrum, introducing the product which allows querying data from Amazon S3; but it’s not as convenient as Snowflake. In Snowflake, computation and storage are separate, which means customers pay only for the computing power they use. With Snowflake, it’s easy to clone tables, schemas, or databases and to run queries on the data quickly.
Connect data from your Snowlafe database with Databox and visualize it in your most important dashboards. Learn more about the integration here.
7. Amazon S3
Amazon S3 is a cloud-based storage service designed to save and store objects of up to 5 terabytes in size. S3 offers subscribers access to the same systems Amazon uses to run its own websites. This storage service does not require much administration. It uses a key-value system that minimizes time spent uploading, downloading, and moving data. The storage service provides an HTTP-based API for uploading and downloading objects. Access control for buckets, objects, and CORS are built-in as well.
Visualize Important Business Data from Your Company’s Databases
It’s not easy keeping up with the latest technology trends… especially if you’re a small to a medium-sized business owner.
Would you believe that you can create a data-rich report with just five clicks and send it to your team’s Slack channel with just one click?
That is exactly what Databox can do for you.
Don’t be afraid of data warehouse reporting. Yes, it can be tricky to ask the right questions and present the results in a useful way. But if you take your time, you can create valuable reports with beautiful graphs and charts that will bring value not just to your organization, but to your colleagues as well.
On top of reports, Databox offers an intuitive dashboard and graph builder to share customized data visualizations with your team. With a simple drag-and-drop interface, you can organize your information into any meaningful format— and this is just one of the many features that make Databox such an intuitive tool for analysts and managers alike.
With Databox, the insights you need can be delivered right to your fingertips whenever you want.
So, what are you waiting for? Sign up today for free and open your new “data portal“!


