Facebook Group Insights Dashboard Template

Template created by Databox Databox
This easy-to-use, easy-to-understand, and robust Facebook Group Insights Dashboard Template allows you to instantly track membership growth, as well as how members of your Facebook group engage with your posts and brand. You will also be able to dig into and learn about the demographics data of your group members.

Uses one-click integrations:

Get this dashboard for free

What you’ll learn from this Facebook Group Insights Dashboard Template

Connect your Facebook groups account and learn:

  • How many members do I currently have in my Facebook group? View the total number of members you have in your Facebook group at a glance. Although this is considered a vanity metric, if you have little to no members in your group, you’ll be unable to achieve your Facebook marketing goals. That said, the goal should be to have followers that actively engage with you and your posts, as this ultimately impacts revenue and retention too.
  • How many new members joined my Facebook group last week? See how many new members you gained in your Facebook group within a given time period. Use this data to evaluate the effectiveness of your efforts in attracting new audience members and increasing your brand reach.
  • How many outstanding requests are waiting for my approval? Monitor and manage new member requests to join your Facebook group at your convenience. If you’d like to receive quality member requests over quantity, take it a step further by asking prospective members to answer specific questions that’ll help you determine if they’re the best fit for your Facebook group.
  • How do I measure member growth over time? Learn how well your marketing efforts are at driving new visitors and how many of those visitors are motivated to come back to your website.
  • The amount of time visitors are spending on your website. Track and visualize member growth in your Facebook group daily, weekly, monthly, quarterly, and yearly. Then, easily compare members' growth from one period to another. A consistent decline in the number of members gained indicates that your strategy for acquiring new members needs to be revisited.

Pull additional data using our deep integration with Facebook Gropus.

What other campaign metrics can you track and visualize with our integration with Facebook Groups? Almost anything:

  • Membership growth and requests
  • Engagement (actions and reactions
  • Group members demographic data
  • Active contributors, and so much more.

In Databox, there are almost 100 Facebook metrics already built and ready for you to visualize in a variety of different ways. In addition, with Query Builder and Data Calculations, the range of different metrics and metric combinations you can track from Facebook widens.

Read more about Databox’s Facebook Groups integration.

Customize this dashboard with Databox

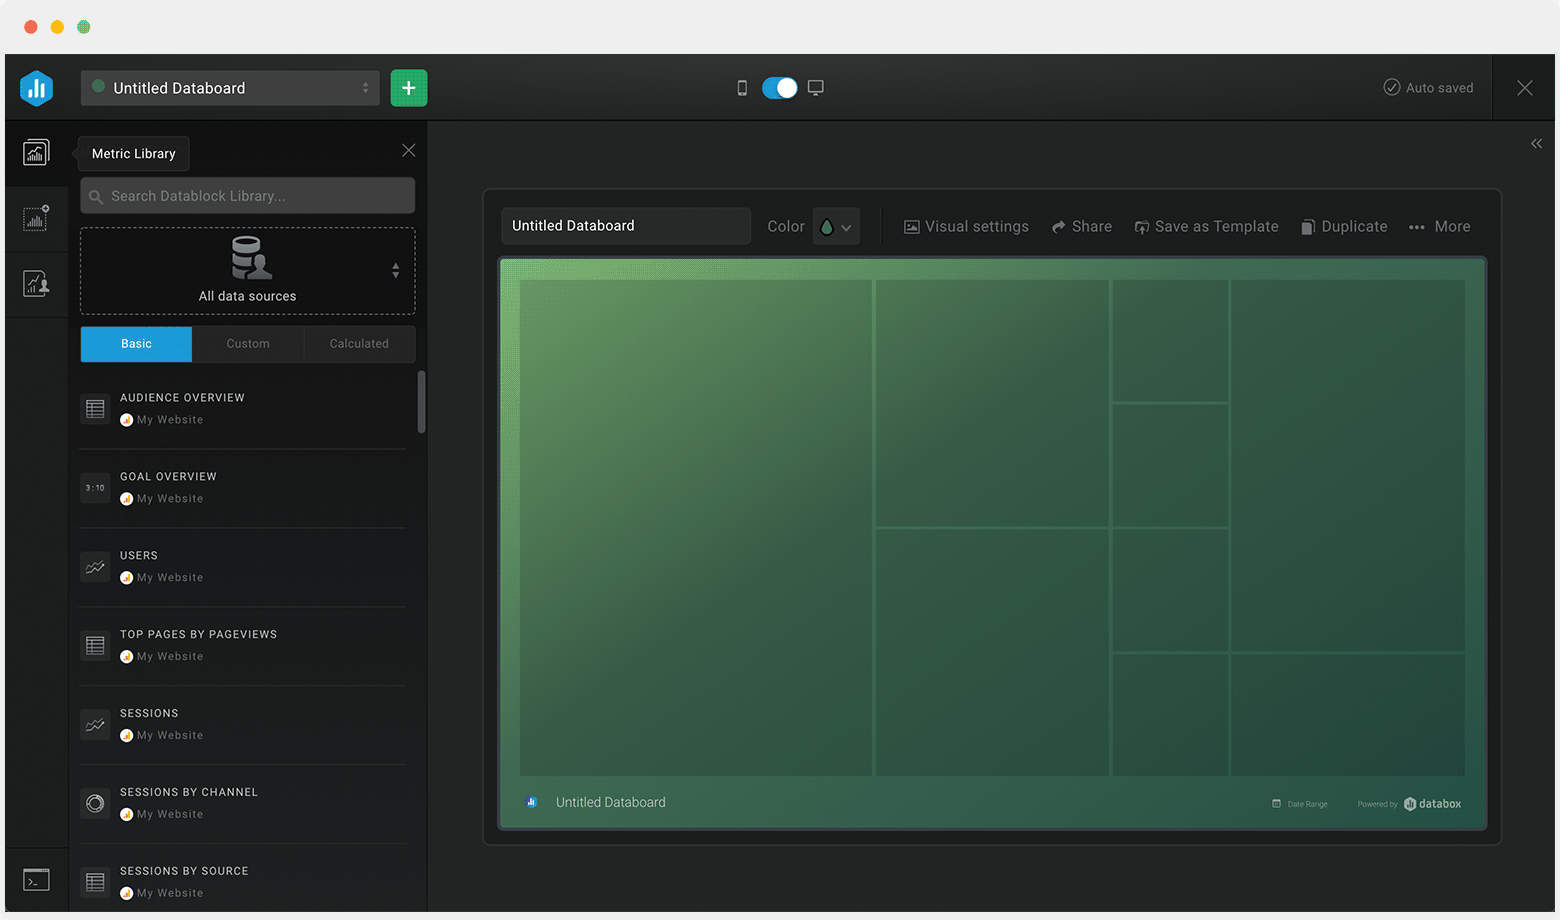
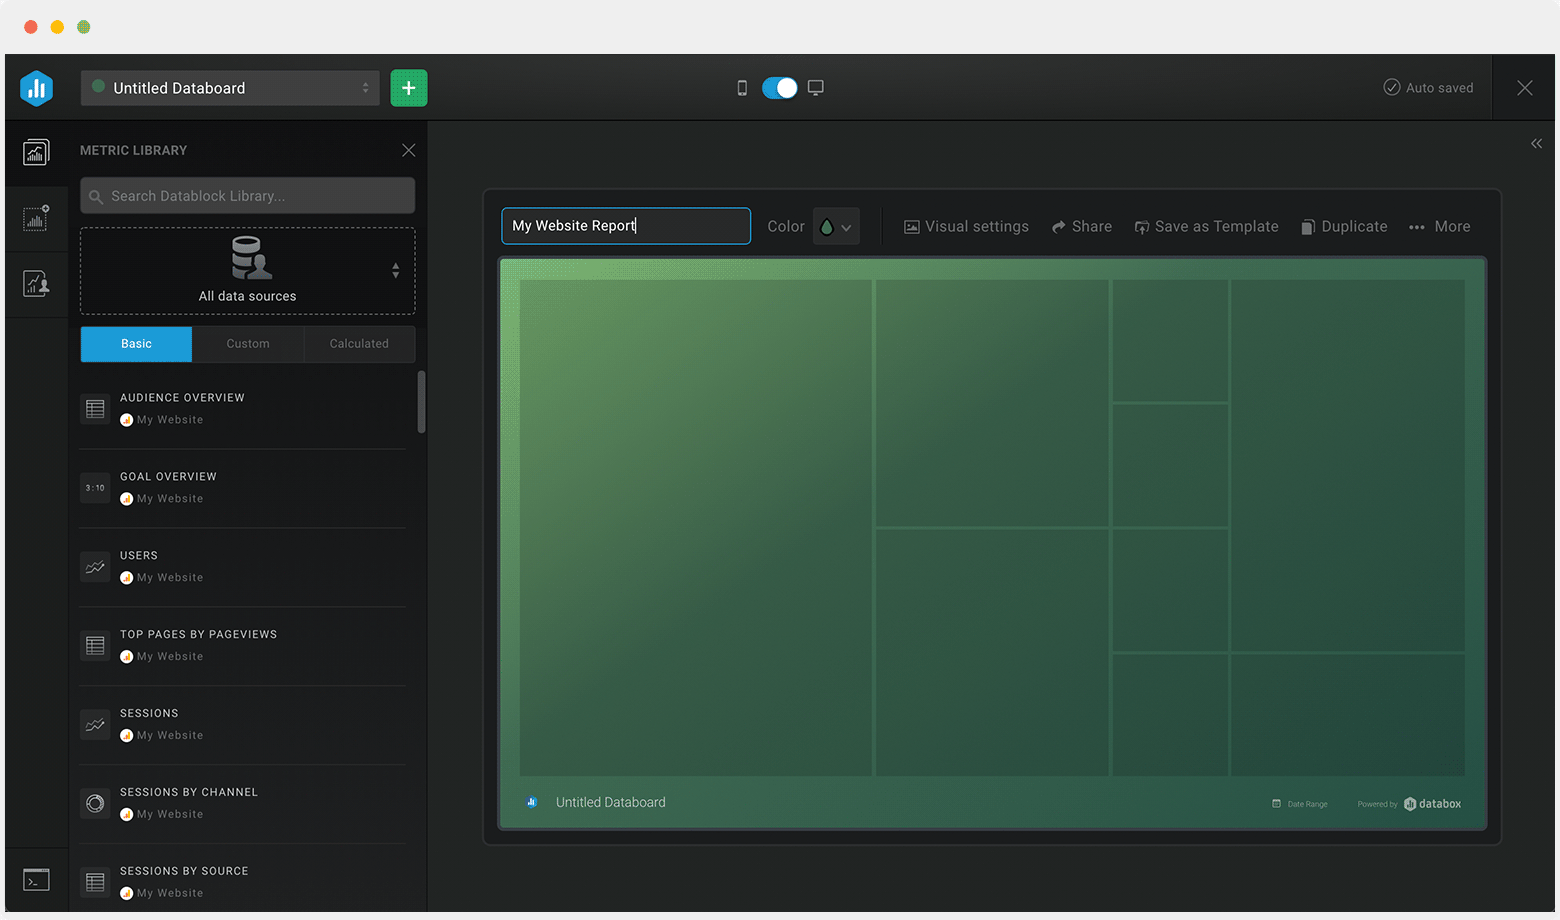
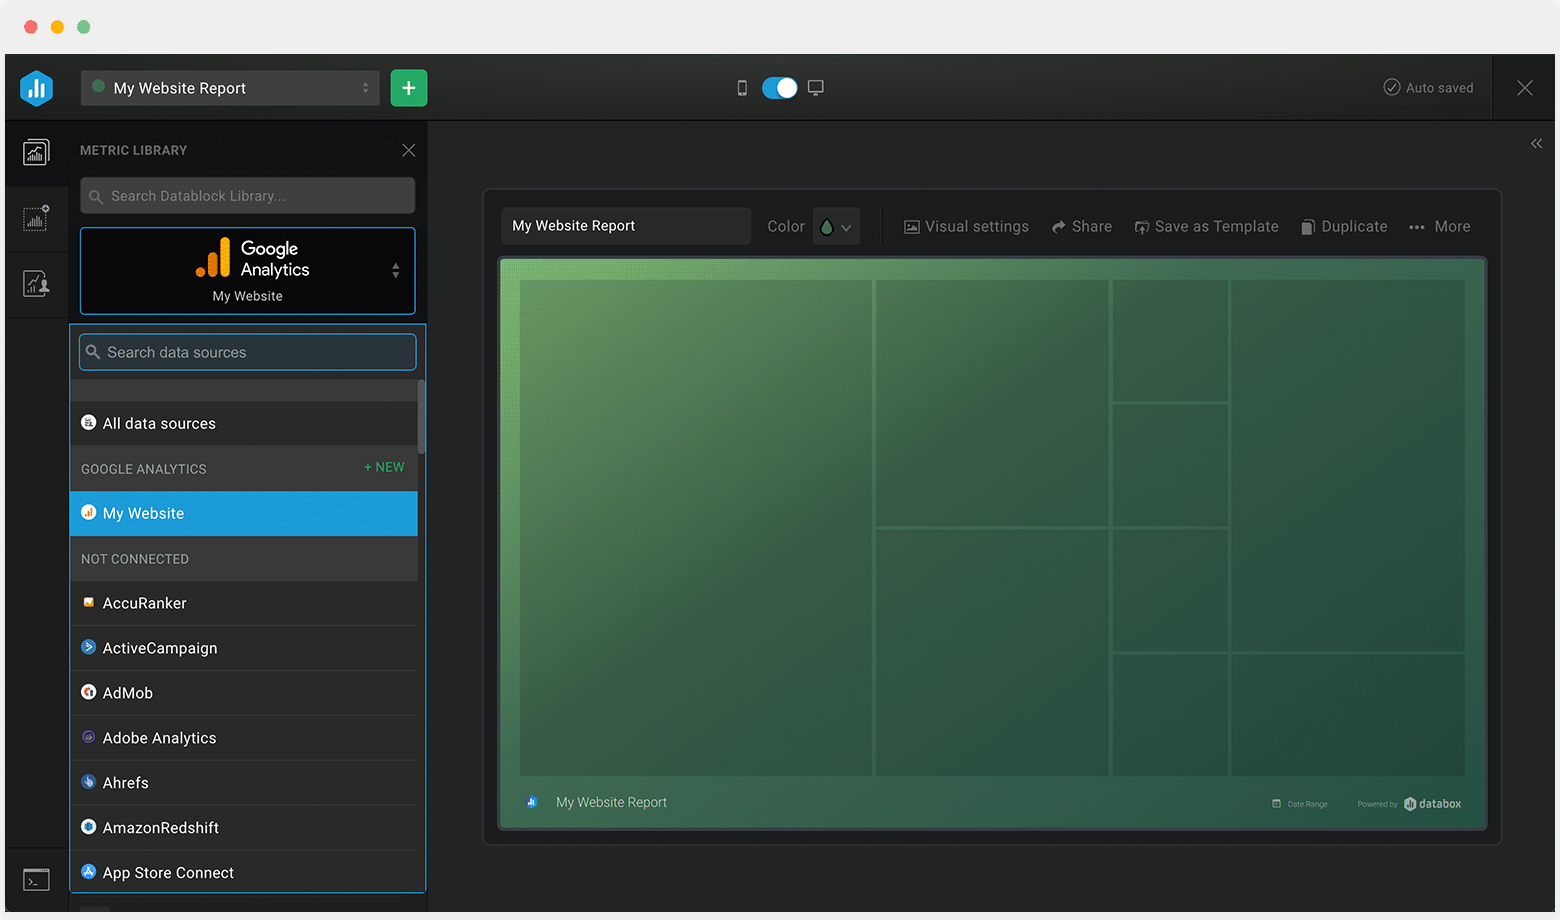
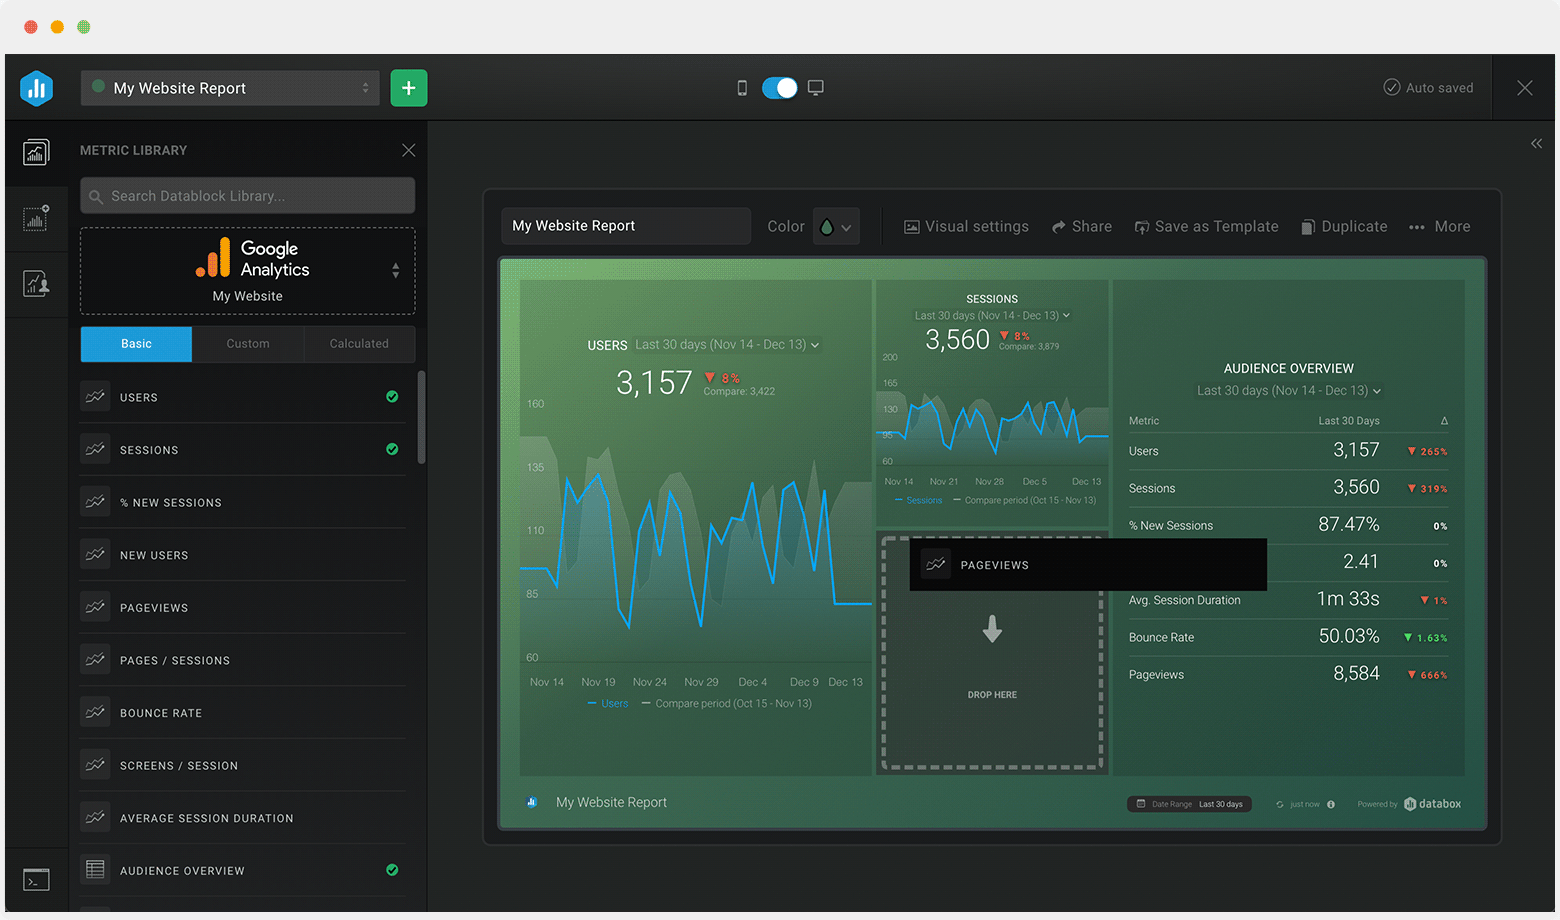
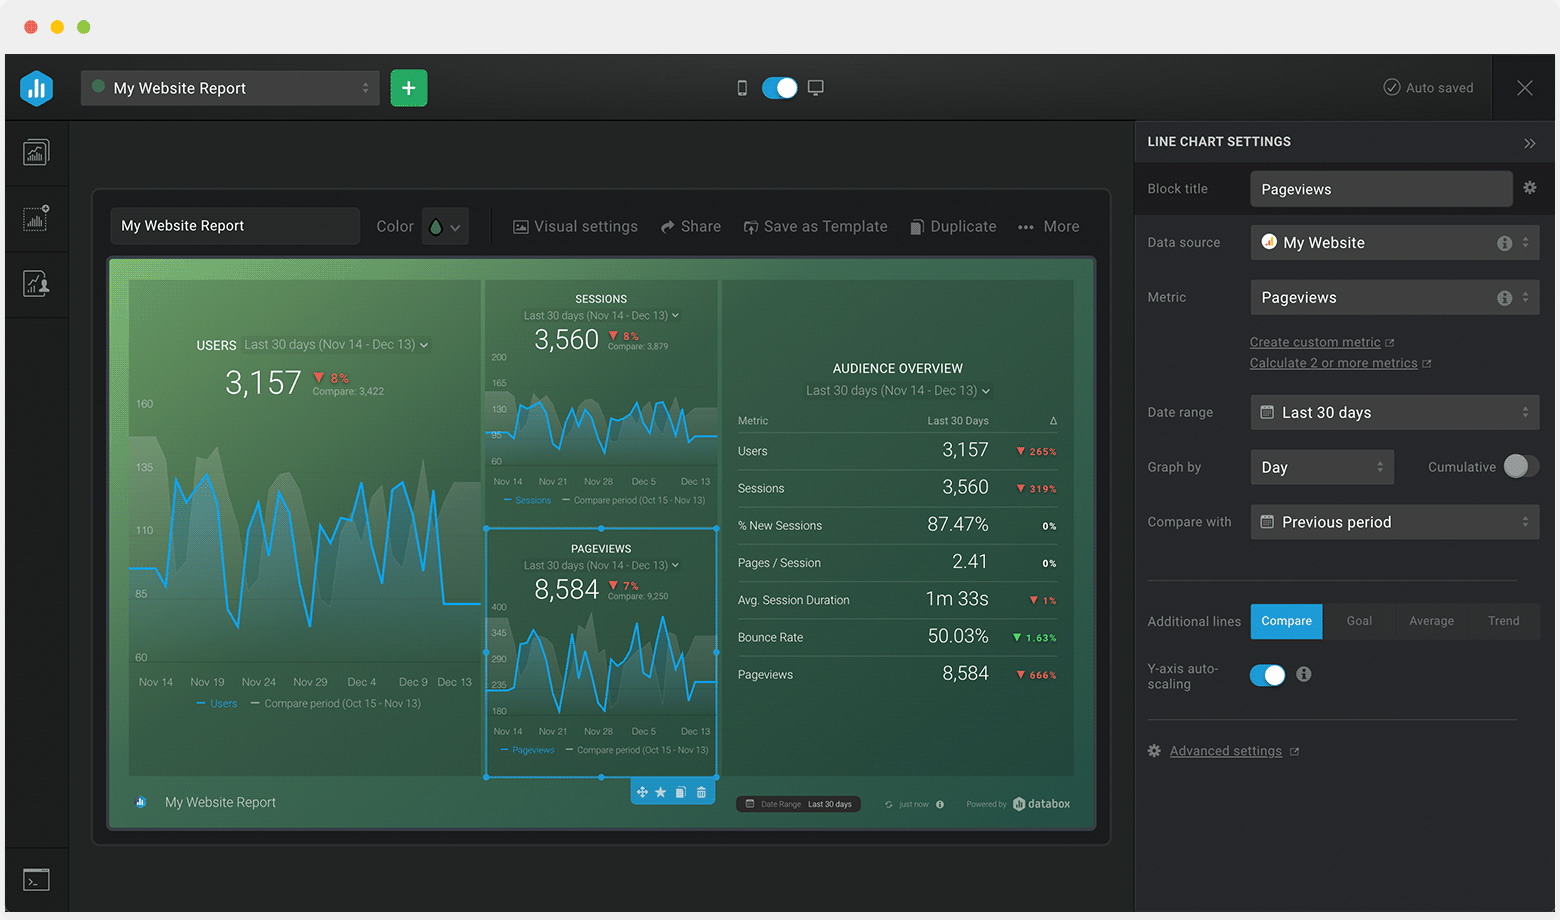
Sometimes, you’ll want to dive deeper into performance. When you need to customize this template (or any other dashboard) to include different metrics, add metrics from different sources, etc., you can do so by using Databox’s Dashboard Designer.

The Designer allows you to easily drag-and-drop metrics and visualizations from any data source right into your dashboard.

Get Started