Table of contents
Before Advancify became a Databox Partner, the two founders, Kris and Matt, actually had a pretty refined process for tracking data.
They used Google Analytics as the single “source of truth” for marketing data, and they would create custom reports for each client to track relevant data. Occasionally, if a client had specific e-commerce needs, they might build a custom dashboard in Shopify as well.
Advancify is known for their technical expertise. They are WordPress, Squarespace and Shopify Partners, as well as GSuite, HubSpot, and RingCentral resellers. So, Google Analytics is the one service that every client will consistently use.
But, as they neared the 100 property limit within Google Analytics (100 separate domains), they realized that these custom reports were confusing and did not tell a specific story.
“Our clients would listen to our analysis during the monthly meetings, but then after the meeting was over, they did not have a great way to access their KPIs over the rest of the month, and the custom reports were not very clear.”
 Kris Aguero
Co-founder, Advancify
Use Real-time Dashboards To Clarify The Data
Google Analytics is a dense tool that is not meant for assembling a monthly report in comparison to a custom dashboard software. Kris and Matt started using the Agency Free plan on Databox to create live dashboards that would update with the latest Google Analytics data, alongside other popular services like MailChimp, Shopify and all the major social media platforms.
“Our clients are not used to the ability to see their KPIs from multiple services on one screen. When there are green or red arrows next to every metric to show trends, it is pretty easy to tell how well you did for the previous month.”
 Kris Aguero
Co-founder, Advancify
Advancify usually asks clients about their annual goals when they begin a project or retainer. Then, they add those goals to their Databox account to give themselves constant reminders about the numbers they are aiming for. They also can build the client tracking dashboards around those metrics- in other words, they can include the related metrics that will support the monthly or annual goal.
Share Data With All Stakeholders In Their Preferred Way
Previously, Kris and Matt would print out a few screenshots from Google Analytics and add some annotations. After they discussed their insights at the monthly meeting, they would share the handouts with the client if the meeting was in person, or send the file if they were doing a conference call. This was not a great solution for explaining their agency’s value.
Now, they use a couple different methods to share data within their agency and with the client. They use the Notes Datablock to track their insights as the month progresses.

Then, they use:
- A live dashboard on the TV when the client visits the office
- Scheduled snapshots to send dashboards automatically at the end of the month via email.
- Databox mobile app for times when they want to check data while away from their computer.
“When I see some data that is trending in the right direction, I will send it to my partner Matt. We love those little celebrations over the course of the month.”
 Kris Aguero
Co-founder, Advancify
How To Answer Client Questions In Real-Time
Some of Advancify’s larger projects and retainers are based on Shopify development, so the team wanted to be able to answer the key questions that a business owner might have after they launch their new Shopify site.
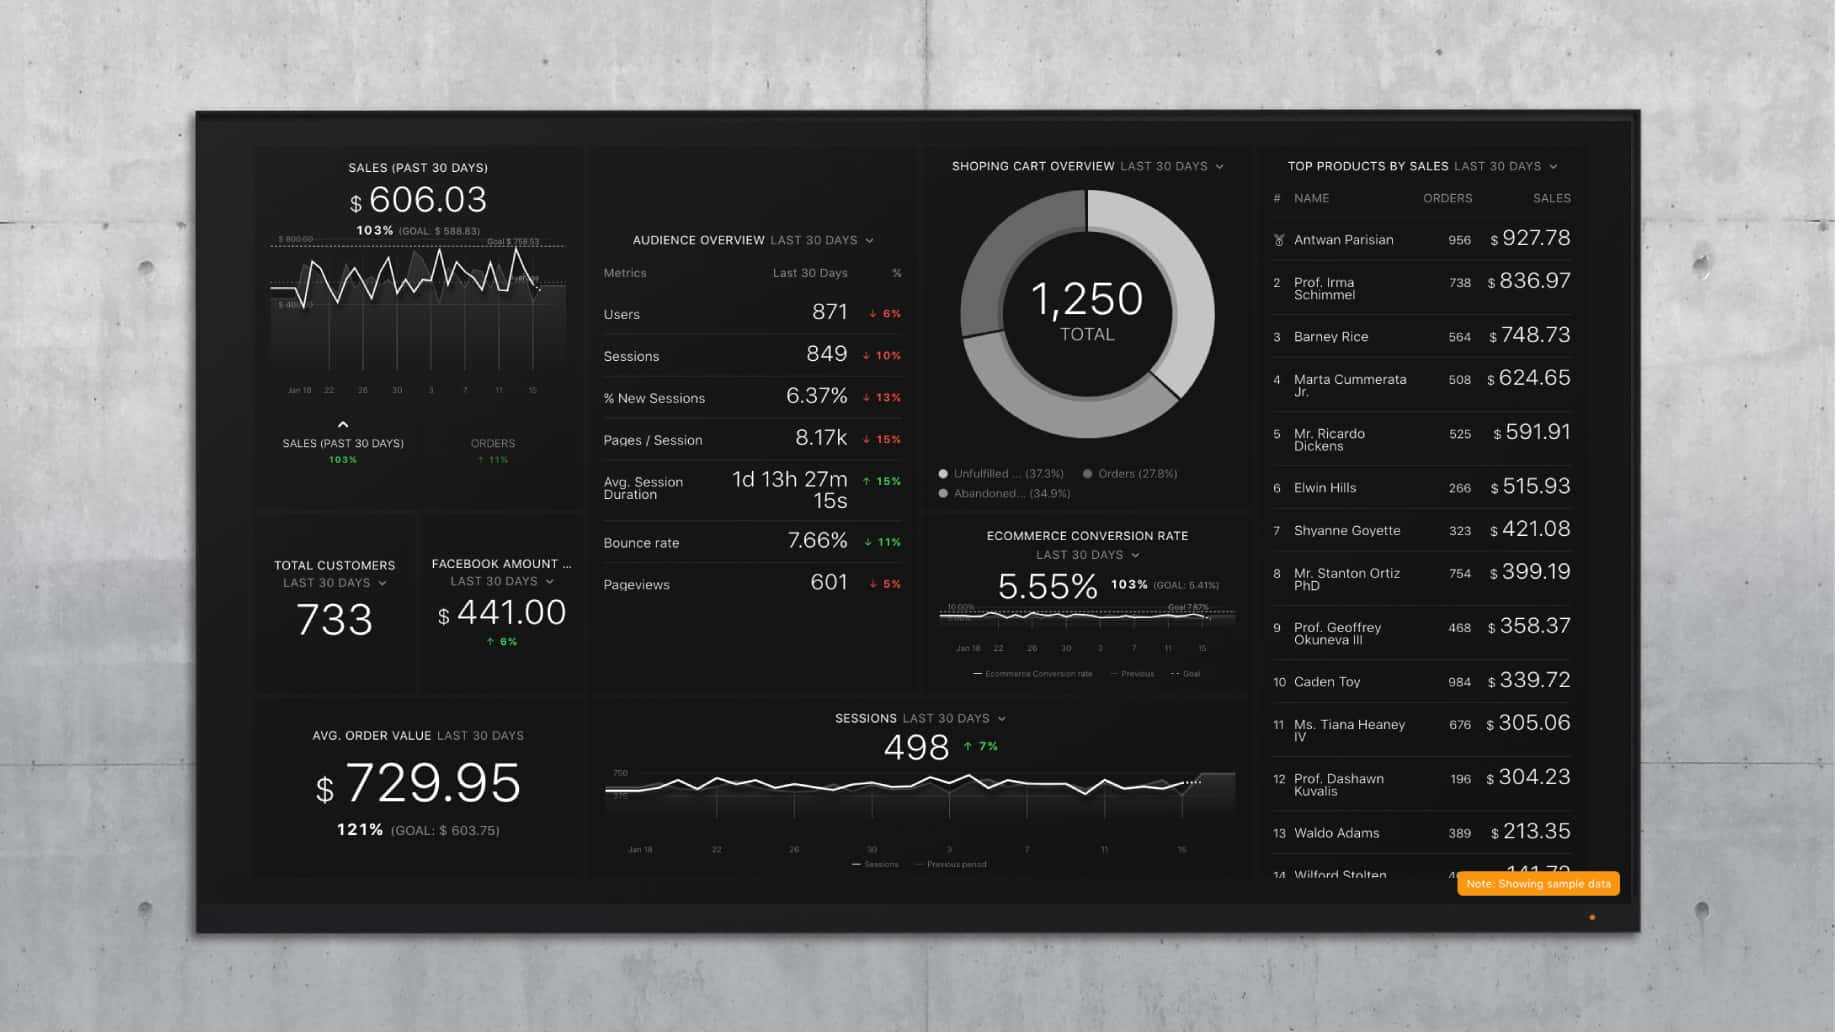
They shared 5 common Shopify KPIs that clients should be tracking in a recent blog post. This allows them to answer questions immediately when a client calls or emails. They also launched this Shopify dashboard in the Databox Template Library for tracking Shopify metrics in real-time:

Interested in tracking real-time data at your agency? Sign up for an Agency Free account here!


