Table of contents
TL;DR
- AI-ready data means an AI can reason about your metrics without a human cleaning, reconciling, or translating them first — a higher bar than “clean enough for a dashboard.”
- The most common blocker for functional leaders is inconsistent metric definitions across tools. Three versions of “MQL” means the AI is averaging three different realities and calling it one signal.
- A 6-question yes/no diagnostic reveals your actual readiness state in under five minutes, without requiring any engineering support or data audit.
- Consistency and completeness are the highest-leverage fixes, and most functional leaders can address both in two to four weeks with the tools and people they already have.
- AI tools produce better outputs the moment your data gets honest – not perfect, honest. Databox AI is built to show the difference.
Introduction
You turned on an AI feature in your analytics tool. It surfaced an insight about your pipeline. You looked at it, paused, and closed the tab because you weren’t sure the number was right.
AI-ready data would have made you forward it instead. It’s data that is clean, structured, and governed consistently enough that an AI model can reason about your metrics without a human translating or reconciling them first.
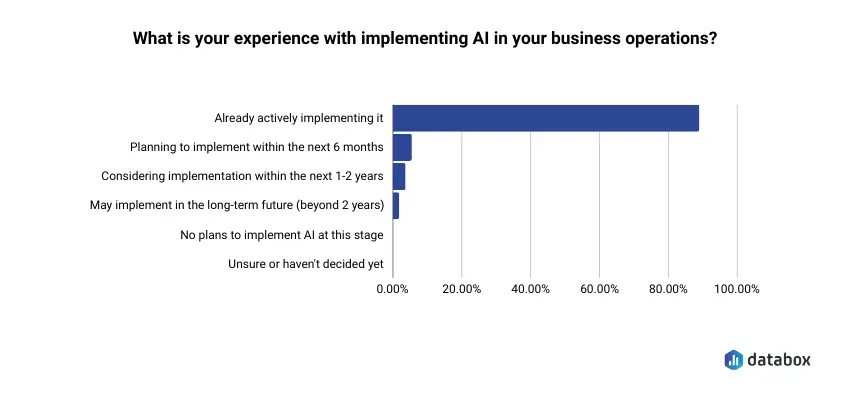
That moment of closing the tab is happening across thousands of B2B SaaS teams right now. Adoption is not the problem: nearly 9 in 10 SMBs already use generative AI in some form, according to a recent Databox survey.
Trust in the output is the problem, and that gap almost never traces back to the AI model itself. It traces to the data underneath. When a Head of RevOps asks an AI tool “what drove the spike in CAC last month?” and gets an answer built on a revenue figure that disagrees with Salesforce, the AI did not fail. The data did.
Every competing definition of AI-ready data is written for data engineers and chief data officers. It covers schemas, pipelines, and governance frameworks. None of that is wrong. However, none of it helps a VP of Marketing who needs to know: can I trust the AI output in my Monday standup? And if not, what do I fix first?
The answer lives in the metrics layer you already control: in the definitions, connections, and refresh schedules you set up, or inherited, when your team started scaling.
Below: a plain-language breakdown of what AI-ready actually requires, five testable dimensions you can assess against your own stack, and a six-question diagnostic you can complete in under five minutes. No engineering background needed.
Clean Data Gets You Good Reports. AI-Ready Data Gets You Answers You Can Act On.
Most definitions of AI-ready data start with “clean, structured, and well-governed information.” That’s accurate as far as it goes. AI-ready data is clean, structured, and governed consistently enough that AI models can trust it: moving organizations from preparation to prediction without manual intervention between every query.
But that definition buries the part that matters to a functional leader. Clean is where most teams stop. And stopping at clean is the problem.
The distinction becomes clear when you compare what a dashboard needs against what an AI model needs.
| What BI-ready data needs | What AI-ready data also needs |
|---|---|
| Clean values, no obvious errors | The same metric defined identically across every tool |
| Consistent formatting | Data lineage you can trace from the output back to the source |
| Aggregated views ready for display | Refresh cadence matched to the question being asked |
| Outliers removed for readability | Representative data, including edge cases and outliers |
| One number per chart | One agreed-upon number per metric, system-wide |
A dashboard shows you that CAC went up. An AI model should tell you why, which channel drove the increase, and whether the trend is accelerating. It can only do that if every source feeding the model agrees on what “CAC” means, which costs count, and when the data was last updated.
For a VP of Marketing, AI-ready translates to something concrete: the AI looks at your connected metrics and produces a trustworthy signal you can bring to a standup without spending the first 20 minutes verifying whether the inputs were right.
Your Data Isn’t AI-Ready Because Metric Definitions Scaled Faster Than Metric Discipline
If your data falls short of that standard, you are in overwhelming company. IBM research found that less than 1% of unstructured enterprise data is in a format suitable for direct AI consumption. A 2025 Qlik survey of 500 AI professionals found that 90% of directors and managers believe company leaders are not paying enough attention to bad or inadequate data.
Those numbers sound like infrastructure problems. For functional leaders at B2B SaaS companies, they are not. The gap is almost always definitional before it is structural.
Two distinct failure types create the readiness gap, and they require different responses:
The first is structural: sources that don’t connect, refresh on different schedules, or live in siloed tools. A marketing team tracking spend in Google Ads, revenue in Salesforce, and attribution in a spreadsheet has a structural problem. Each source may be individually clean, but they aren’t connected in a way that lets an AI reason across all three. Structural problems are real. They’re also the ones most likely to require engineering or ops support to resolve.
The second failure type is definitional, and it’s where functional leaders have the most direct control. Metric definitions vary by tool, live in someone’s head, or were never written down. Business rules live in code or in people’s memories, and AI cannot apply rules that have never been made explicit.
A CFO opens the board deck the morning of the meeting. Salesforce shows $2.1M in pipeline. The BI report shows $1.8M. The difference: Salesforce counts a deal as “in pipeline” at Stage 2, while the report definition requires Stage 3. Both numbers are clean. Both are technically correct. An AI model looking at both sources has no way to know which version of pipeline to use when someone on the board asks whether the quarter is going to close.
That is a definitions failure, and it’s the single most common reason AI outputs feel untrustworthy to functional leaders: the inputs contain competing versions of the same truth.
AI projects fail twice as often as traditional IT projects, with over 80% failing to deliver meaningful business value, according to RAND research. The primary cause is input quality. The hardest part of AI transformation turns out to be mindset rather than technology, and the fix starts with deciding that metric discipline matters as much as metric collection.
Five Dimensions Your Dashboard Ignores and Your AI Model Cannot
Gartner estimates that poor data quality costs organizations an average of $12.9 million annually. For a 200-person SaaS company, the figure scales down, but the mechanism stays identical: bad inputs produce bad outputs, and the cost compounds every time a decision rests on a number that should not be trusted.
Five dimensions determine whether your data crosses from “good enough for a report” to “good enough for an AI to reason about.” Each one is testable without engineering help.
| Dimension | The test question | What failure looks like | Who owns the fix |
|---|---|---|---|
| Consistency | Would every tool you use produce the same number for this metric today? | Three definitions of “MQL” across HubSpot, the dashboard, and the weekly report | Functional leader + ops |
| Completeness | Are essential fields filled in often enough to forecast from? | 40% of deal records with no close date | Functional leader + frontline managers |
| Freshness | Is the data current enough for the question you’re asking? | Weekly ad spend syncs feeding a daily anomaly detector | Ops or data team |
| Traceability | Can you follow any AI-surfaced number back to its source? | A CAC spike with no clear origin in the underlying data | Functional leader + ops |
| Single source of truth | Is there one agreed number per critical metric, system-wide? | Revenue lives in Stripe, Salesforce, and a spreadsheet — none agree | Functional leader (decision, not project) |
One Definition, Everywhere It Matters
Consistency is the dimension with the highest leverage and the lowest technical barrier. It means the same metric carries the same definition in every tool that tracks it.
When a VP of Marketing defines an MQL as “a lead who completed a demo request form” in HubSpot but the weekly report counts anyone who downloaded a whitepaper, the AI has no stable foundation. It averages two different realities and presents the result as a single signal. The output looks precise. The input is incoherent.
The test: can you write down your top five KPI definitions right now, and would your ops lead, your analyst, and your dashboard all agree on every word? If not, the AI is working with contested inputs.
No Critical Fields Left Blank
Completeness means essential fields are present with minimal missing or null values. The goal is not having every data point. The goal is having enough signal for the AI to reason reliably.
If 40% of deal records in your CRM have no close date, the AI cannot build a reliable forecast. A Director of Sales Ops reporting that forecast to the board is defending a number built on a dataset with a 40% gap in its most critical field.
Current Enough for the Question You’re Asking
Freshness is relative, not absolute. Data must be current enough for the specific use case. A monthly trend analysis can tolerate weekly refreshes. Daily anomaly detection cannot.
A VP of Marketing spots a performance drop on Thursday. The ad spend data feeding her AI tool syncs every Monday. The AI is reasoning about a world that existed five days ago. Speed and quality are not in tension here — stale data degrades both simultaneously.
Can You Follow the Number Home?
Traceability answers a simple question: when the AI surfaces a number, can you trace it back to where it came from and understand what changed?
If your AI tool flags a spike in customer acquisition cost, can you follow that number from the output back to the source system, identify which cost line increased, and determine whether the change was real or a data artifact? Without that path, every AI output rests on belief rather than understanding. A Head of CS who acts on a churn signal that turns out to be a duplicate-account artifact in the CRM made a decision on a number she could not verify.
A Single Source of Truth for What Matters Most
A single source of truth means one agreed-upon number for each critical metric, with every downstream tool pointing to it. Not roughly aligned. One number.
If revenue lives in Stripe, Salesforce, and a spreadsheet, and none of them agree, the AI does not know which to trust. Neither does the CFO in the board meeting.
The shortcut for picking the source: follow the financial reality. Recognized revenue belongs to your billing system (Stripe, Chargebee, NetSuite). Pipeline and forecast belong to the CRM. Spend belongs to the platform that wrote the check (Google Ads, LinkedIn, Facebook). Product usage belongs to the product analytics tool, not the CRM’s stale custom field. Document the choice, point every report and dashboard at it, and stop arguing about which number is right.
Picking one source, documenting it, and pointing every tool at it is not a technology project. It’s a decision. And it’s the single highest-leverage change a functional leader can make before deploying AI.
A 6-Question Diagnostic Tells You Where Your Data Stands in Under Five Minutes
Gartner found that 63% of organizations are unsure whether their data management is ready for AI. If you are in that 63%, the fastest path out is an honest audit, not a months-long data governance initiative.
The diagnostic below is designed for functional leaders. No engineering knowledge required. Answer each question based on your actual current state, not the state you plan to reach next quarter. Yes or no only.
The Checklist
1. Can you write down your top 5 KPIs and confirm that every tool tracking them uses the exact same definition? Not “similar.” Not “close enough.” The same calculation, the same filters, the same time window.
2. Do all of your connected data sources refresh automatically, or does someone on your team manually export or upload data on a schedule? If any primary source depends on a person remembering to run an export, count it as no.
3. If an AI tool flagged an anomaly in your pipeline or revenue this week, could you trace it back to a specific source, date, or change — or would you have to guess? The test is not whether you could investigate. It’s whether the path from output to source is documented and followable right now.
4. Is there one agreed-upon number for your most important metric — revenue, pipeline, CAC, or churn — or do different reports give different answers on the same day? Check your last board deck against your last team standup. If the numbers differ and no one flagged it, that’s a no.
5. Are all of your primary data sources connected to your analytics platform, or are some still living in CSVs, email exports, or someone’s personal spreadsheet? “Primary” means any source that feeds a metric you report on monthly or more frequently.
6. When a metric definition changes — for example, how you count an “active user” — does it update everywhere automatically, or does it silently stay wrong in at least one tool? If you are not sure, the answer is no. Silent drift is the default.
How to Read Your Results
5–6 yes answers: Your data is likely AI-ready or close. AI tools will produce trustworthy outputs. Focus on freshness and traceability as ongoing maintenance practices, not one-time projects.
3–4 yes answers: Partially ready. AI will work, but outputs will carry caveats. You’ll spend time validating signals rather than acting on them. Fix consistency first, then completeness.
0–2 yes answers: Foundational work needed before AI delivers reliable value. Start with one metric, one source, one definition, and build from there. The goal is not perfection. It’s data honest enough that the AI’s outputs match reality closely enough to trust.
AI readiness is not a finish line. It’s the ongoing practice of maintaining honest, connected data so your tools can do what they promise. Treat this diagnostic like a quarterly check-in, not a one-time audit.
What “AI-Ready” Looks Like in Practice Inside Databox
Databox is a business analytics platform that connects to 130+ data sources — CRM, ad platforms, billing, product analytics, web analytics, support tools — and gives functional leaders one place to define metrics, build dashboards, and ask questions of their data in natural language through an AI assistant called Genie.
The AI works across whatever sources you connect. The quality of its outputs is directly tied to whether those sources are refreshing on schedule, using consistent metric definitions, and pointing to one source of truth per metric. Two scenarios make the difference concrete.
Scenario A — When the Data Is Ready
A VP of Marketing has connected Google Ads, HubSpot, and Salesforce. She’s defined CAC once in the Databox Metric Library — the canonical store where every metric definition, calculation, filter, and source lives in one place. Every Databoard, every Goal, every Genie query pulls from that single definition.
On a Wednesday morning, CAC ticks up. She opens Databox and asks Genie what drove the change. Genie reasons across the same three connected sources, applies the one Metric Library definition, and surfaces the answer: paid social CPM rose 18% week-over-week while conversion rate held flat. She has an explanation in 90 seconds. She brings it to standup the same morning. She acts on Wednesday’s data, not last Monday’s export.
Scenario B — When the Data Has Gaps
A different VP of Marketing has the same sources connected but defines CAC three different ways: one in HubSpot, one in the weekly report template, and one in a custom dashboard her ops lead built. Genie flags the same CAC spike. But the answer is ambiguous because three definitions feed it — paid social is up in one version, flat in another, and the third doesn’t include organic costs at all. The signal is there. The story isn’t. She spends the rest of the morning reconciling instead of acting.
The difference between Scenario A and Scenario B is the Metric Library. The same product, the same model, the same connections, but one functional leader did the metric definition work and one did not. That work is the difference between AI that explains and AI that flags.
Closing the Gaps Takes Weeks, Not Quarters
The diagnostic above identifies gaps. Closing them does not require a data engineering team, a six-month governance initiative, or a new tech stack. It requires prioritization and focused ops work. Most functional leaders can address the two highest-leverage dimensions — consistency and completeness — in two to four weeks.
Fix consistency first. Write down the agreed definition of each top KPI. Get alignment from every stakeholder who reports on it: not just the person who built the dashboard, but the person who presents the number in the board meeting. Update the definition in every tool where it exists. One meeting, one shared doc, one round of tool updates — that’s the project.
Fix completeness second. Identify which critical fields have high null rates: close dates, deal stages, source attribution. The fix is rarely technical. It’s usually a data entry behavior — reps skipping a required field, a default setting that allows blanks, or an integration that maps fields incorrectly. A Director of Sales Ops who finds 35% null rates on close dates doesn’t need an engineer. She needs a required-field rule in the CRM and a conversation with her sales managers about why it matters.
Fix freshness third. Audit which sources are on manual sync. Automate what you can. For sources that cannot be automated, build awareness into how your team interprets AI outputs from those sources.
Fix traceability last, and treat it as ongoing. Start documenting where your most important numbers come from. A formal data catalog is not required. A shared spreadsheet with one row per KPI and one column for “source of record” is a meaningful start. The practice matters more than the format.
Start with your biggest pain point and build from there. The tools already exist. What the shift demands is new thinking about how you manage your metrics: the discipline to define once, connect reliably, and let the AI do the work that used to require an analyst and a Monday morning.
Conclusion
The diagnostic in this article takes five minutes. Most leaders who complete it find the same thing: the AI they already have is more capable than what their current data lets it demonstrate.
Consistency, completeness, freshness, traceability, and a single source of truth aren’t a checklist you complete once and retire; they’re the ongoing conditions under which AI produces outputs worth acting on. Every new tool, every new hire, every campaign restructure invites definitions to drift. The question is whether you catch the drift before the AI does.
Your data doesn’t need to be perfect. It needs to be honest enough that the AI’s outputs move faster than your spreadsheets.
Frequently Asked Questions
Is clean data the same as AI-ready data?
No. Clean data is a prerequisite for AI readiness, but it is not sufficient. AI-ready data also requires consistent metric definitions across every tool that tracks a given metric, traceability from insight back to source, and freshness appropriate to the specific use case. Traditional data quality practices — like removing outliers — can actually make data less useful for AI, which needs representative data including edge cases to build accurate models.
How long does it take to make data AI-ready?
For functional leaders without a dedicated data engineering team, the highest-impact fixes — standardizing metric definitions and connecting data sources — typically take two to four weeks. Full traceability and governance maturity takes longer, but neither is required to get meaningful value from AI analytics tools. Start with consistency and completeness, and build from there as your team’s AI usage matures.
Can AI tools work even if my data isn’t perfectly AI-ready?
Yes, with real caveats. AI can surface trends and anomalies with imperfect data, but outputs will be harder to act on — you’ll spend time verifying signals rather than responding to them. The practical threshold is not perfection. It’s whether your data is honest and connected enough for the AI to produce outputs you trust without a verification step after every query.
What is the difference between BI-ready and AI-ready data?
BI-ready data is optimized for display; AI-ready data is optimized for reasoning. A BI tool shows you that a metric changed. An AI tool explains why it changed, which driver caused it, and whether the trend is continuing. That second layer of output requires consistent definitions across sources, traceability from output back to origin, and representative coverage that includes edge cases — a fundamentally different standard than what a clean dashboard demands.
Do I need a data engineer to make my data AI-ready?
Not for the highest-leverage fixes. Consistency and completeness are decisions and process changes, not engineering projects. A functional leader with ops support can address both in two to four weeks. Engineering help becomes relevant for structural issues — connecting siloed systems or automating manual data transfers — but most functional leaders will see meaningful improvement in AI output quality before they reach that stage.