")
Table of contents
A working starter pack for finance and functional leaders — plus what to ask next once the conversation opens up.
TL;DR
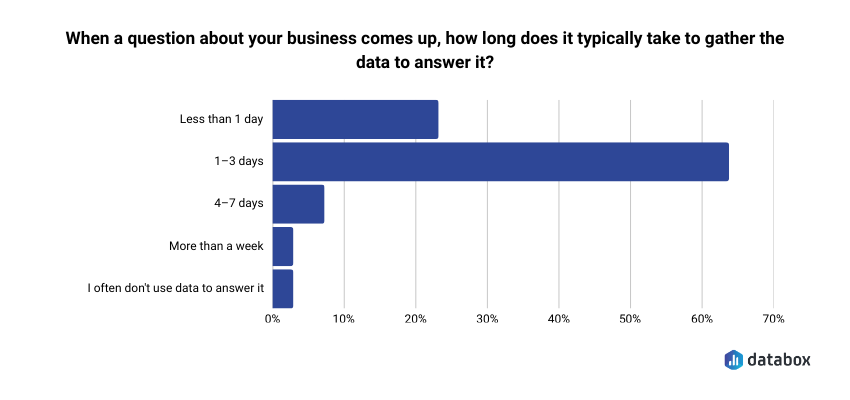
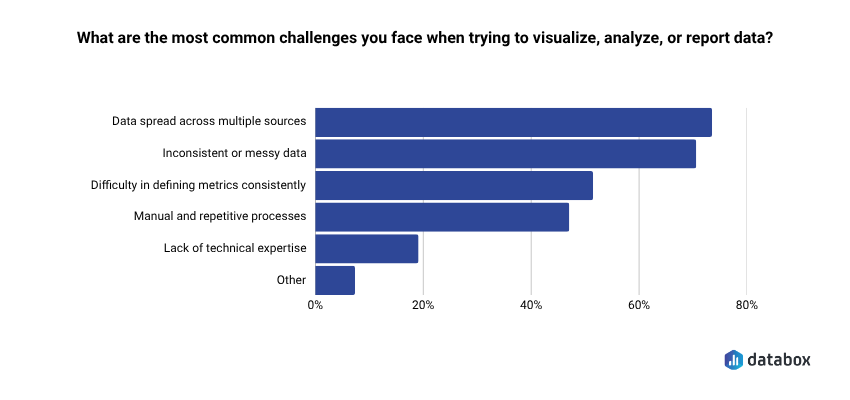
- In Databox’s research Time to Insight, 64% of teams say it takes one to three days to gather the data to answer a business question, and 73% say data scattered across sources is their top reporting challenge. Finance teams feel this acutely: a single question often crosses Stripe, QuickBooks, and a spreadsheet.
- This article gives you nine real prompts from the Databox Prompt Library (five for Stripe, four for QuickBooks), each with a sample return, why it matters, and two to three natural follow-ups.
- Prompts work when they name the metric, the time window, and the comparison. “How’s my revenue?” fails. “What is our MRR this month, and how has it trended over the last 6 months?” works.
- Cross-source questions (margin vs. MRR growth, revenue vs. cash-position gaps) only become answerable once Stripe and QuickBooks live in the same layer. Databox handles the connection; Genie or MCP handles the asking.
- Key architectural difference from generic AI tools: with Genie, the language model never touches the math. Calculations run on deterministic code against validated data. That’s what separates reliable BI from AI approximating arithmetic.
Introduction
You’re twenty minutes into hunting down a number that should take thirty seconds. Net new MRR. Gross profit margin last quarter. The cash position before Friday’s payroll.
The data exists. Stripe has it. QuickBooks has it. The AI tools sitting in your other tab are genuinely capable. And yet here you are, exporting CSVs, pivoting columns, Slacking your finance lead to double-check.
This is a data-access problem that hits finance particularly hard. In Databox’s research, Time to Insight, 64.29% of teams say it takes one to three days to gather the data to answer a business question. 73.13% cite data spread across multiple sources as their top reporting challenge.
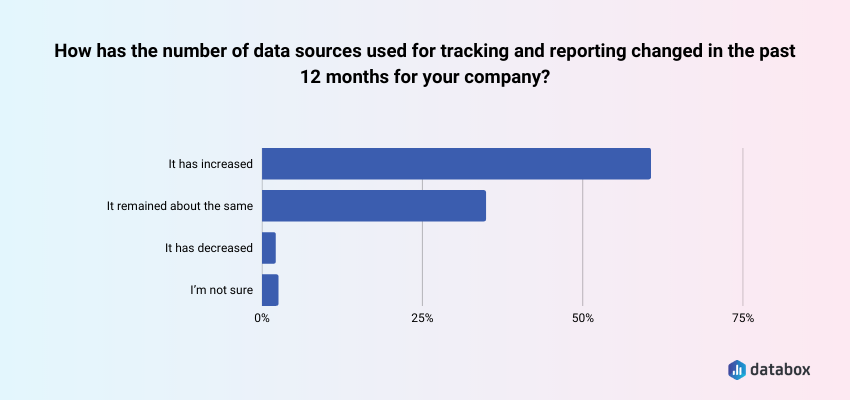
Additionally, according to Databox’s State of Business Reporting research, about 60% say the number of data sources they work with has grown in the past twelve months, meaning the problem compounds.
Finance gets the worst of this because a single finance question routinely crosses two or three systems.
The bottleneck is often your data, but just as often, it’s knowing what to ask and having a connected layer where those questions can actually be answered.
This article is a short, honest prompt library. Nine prompts, drawn directly from the Databox Prompt Library — five for Stripe, four for QuickBooks. For each, you’ll see the exact prompt, a sample of what a connected AI returns, why the question matters, and two or three natural follow-ups that extend the conversation once the door is open.
At the end, a short section on cross-source questions you can ask once Stripe and QuickBooks data live in the same place, plus one worked example of how a revenue ops leader used Genie to replace gut-feel forecasting — because the pattern transfers to finance.
Why Most Finance AI Prompts Fail
Ask ChatGPT “how’s my revenue doing?” against an uploaded CSV, and you’ll get a generic summary. Ask a connected AI a specific question against live Stripe data, and you’ll get an answer you can walk into your next pipeline review with.
The difference isn’t the AI, but three things in the prompt:
- A named metric: “MRR” or “gross profit margin” beats “revenue”
- A named time window: “last 6 months” or “this quarter vs. last quarter” beats “recently”
- A named comparison or breakdown: “by plan tier” or “vs. last month” beats “overall”
Every prompt in the library below follows that structure. That’s why they work.
5 Prompts for Your Stripe Data
Stripe is subscription and payment event data, designed for developers, not accountants. The prompts that get useful answers match how Stripe structures its data: around MRR, gross volume, customers, upgrades, downgrades, and churn.
1. “How has our gross volume changed over the last quarter?”
What a connected AI returns: A gross volume total for the most recent quarter, the same figure for the prior quarter, the percentage change, and a trend shape: accelerating, flat, or decelerating.
Why it matters: Gross volume is the rawest revenue signal in Stripe. Before MRR, before net anything, this is the top-line cash flow from subscriptions and payments. If this is shifting, every downstream metric will shift with it.
Natural follow-ups:
- “What drove the change in gross volume — new customer volume, upgrades, or price?”
- “Which plan tier contributed the most to the gross volume change?”
- “How does this quarter’s gross volume compare to the same quarter last year?”
2. “How many new customers made their first payment this month, and how does that compare to last month?”
What a connected AI returns: The count of first-payment customers for this month, the same count for last month, and the percentage change.
Why it matters: First-payment customers is the cleanest new-customer signal you have — truer than signups (which include free trials) and truer than leads (which include noise). It’s the number that most closely tracks actual revenue acquisition pace.
Natural follow-ups:
- “What was the average first payment amount this month vs. last month?”
- “Which plan did most new customers choose for their first payment?”
- “How does this month’s new customer count compare to our three-month rolling average?”
3. “What is our current churn rate, and how much MRR did we lose to churn this month?”
What a connected AI returns: A current churn rate percentage, the dollar amount of MRR lost to cancellations in the last month, and a trend against prior months.
Why it matters: Churn rate in a vacuum is less useful than churn rate paired with MRR impact. A 3% churn rate on your smallest plans is a different conversation than a 3% churn rate concentrated in your top tier. This prompt gives you both.
Natural follow-ups:
- “Which plan tier saw the highest churn this month?”
- “How does this month’s churned MRR compare to our six-month average?”
- “What’s our net revenue retention after accounting for upgrades?”
4. “What is our MRR this month, and how has it trended over the last 6 months?”
What a connected AI returns: Current MRR, the six-month trend with monthly data points, and the overall growth rate across the period.
Why it matters: MRR is the metric board decks and SaaS investors orient around. The six-month trend tells you whether growth is accelerating, steady, or stalling, far more useful than a single-month snapshot.
Natural follow-ups:
- “What was the biggest month-over-month MRR change in the last six months, and what drove it?”
- “How does our MRR growth rate compare to the same period last year?”
- “What portion of current MRR comes from annual plans vs. monthly?”
5. “What is the trend in our MRR upgrades versus downgrades over the last 90 days?”
What a connected AI returns: Upgrade MRR and downgrade MRR for the 90-day window, the net of the two, and whether the gap is widening or narrowing.
Why it matters: The upgrade/downgrade ratio is an early leading indicator of product-market fit drift. When downgrades start gaining on upgrades, you usually see the impact in net new MRR two to three quarters later.
Natural follow-ups:
- “Which plan tier had the most upgrades? The most downgrades?”
- “What was the average upgrade amount vs. the average downgrade amount?”
- “Are downgrades concentrated in a specific customer segment or cohort?”
4 Prompts for Your QuickBooks Data
QuickBooks holds your general ledger: cash, P&L, receivables, and expenses. The prompts that work here are about financial health and operating rhythm, not subscription mechanics.
6. “How does our actual income compare to the prior period — are we growing revenue month over month?”
What a connected AI returns: Current period actual income, the prior period figure, and the month-over-month growth rate with a plain-language trend read.
Why it matters: This is the single most common finance question asked in any business and the one most often answered by exporting a P&L and eyeballing two numbers. A connected AI answers it in seconds with the growth rate calculated for you.
Natural follow-ups:
- “Which income categories grew the fastest? Which shrank?”
- “How does this month’s income compare to our budget?”
- “What’s our rolling three-month income trend?”
7. “What are our total operating expenses this month, and which expense categories are growing the fastest?”
What a connected AI returns: Total operating expenses for the month and a ranked list of expense categories by growth rate against the prior period.
Why it matters: Cost creep is easier to catch when you see it ranked. Month-over-month variance in a single spreadsheet cell is easy to miss. A ranked list of the fastest-growing categories is a forcing function for the conversation about whether to cut, investigate, or accept the growth.
Natural follow-ups:
- “Is the growth in our top category driven by one vendor or spread across many?”
- “How does this month’s operating expense ratio compare to last quarter’s?”
- “What’s our operating expense run rate projected over the next six months?”
8. “What is our gross profit this month, and how has our gross profit margin trended over the last quarter?”
What a connected AI returns: Dollar gross profit, margin percentage, and a quarterly trend line showing whether the margin is expanding, stable, or compressing.
Why it matters: Gross profit margin is where pricing decisions and cost structure meet. Margin compression is one of the earliest indicators that something in the unit economics needs attention, usually before it shows up in cash position.
Natural follow-ups:
- “Which month in the last quarter had the lowest margin, and why?”
- “How does our current margin compare to the same quarter last year?”
- “What’s contributing most to margin changes — revenue mix or COGS?”
9. “What is our total income this month, and how does it compare to last month and the same month last year?”
What a connected AI returns: Total income for the current month, last month, the same month last year, and the percentage change against each.
Why it matters: Two comparisons beat one. Month-over-month tells you momentum. Year-over-year tells you whether you’re really growing or just riding a seasonal pattern. Finance leaders who only look at one of these routinely misread their business.
Natural follow-ups:
- “Which income category had the biggest year-over-year change?”
- “Is the year-over-year change consistent with our growth trajectory?”
- “Are there any unusual income events distorting the comparison?”
What You Can Ask Once Stripe and QuickBooks Live in the Same Place
The nine prompts above all query a single source. Once both Stripe and QuickBooks are connected to the same analytics layer, you can ask questions that neither tool can answer alone. These aren’t in the prompt library — they’re natural follow-ups you can ask Genie, Databox AI analyst, directly, or through Databox MCP if you’re working in Claude, ChatGPT, or n8n.
A few that tend to pay off:
- “How does my gross profit margin trend line up with my MRR growth?” Stripe holds MRR, QuickBooks holds COGS. Overlaying them tells you whether you’re growing efficiently or buying growth.
- “What percentage of recognized revenue this month came from customers currently past due on an invoice?” Stripe knows subscription status, QuickBooks tracks AR aging. This one catches revenue-quality issues before they become write-offs.
- “Which months had the highest MRR but the lowest cash position, and what explains the gap?” Stripe shows when revenue was booked, QuickBooks shows when cash landed. The gap between the two is where cash flow surprises live.
These are the questions most finance teams eventually need but rarely build dashboards for; the juice isn’t worth the manual reconciliation. When both sources are in the same layer, they become conversational.
How a Revenue Ops Leader Replaced Gut-Feel Forecasting
This example isn’t from finance; it’s from Sales. The pattern transfers cleanly to any functional leader asking Stripe or QuickBooks questions, which is why it’s here.
The transferable pattern for finance: a specific prompt (named metrics, named time windows, named logic) gets back both the number and an insight you weren’t looking for. That’s the difference between a dashboard and a conversation with your data.
Five Principles for Prompts That Actually Work
Most finance prompts fail for the same reasons. Five habits fix the majority of them:
1. Name the time period. “Last month” is ambiguous. “March 2025 vs. February 2025” is not.
2. Name the metric. “Revenue” could mean gross, net, recognized, collected, or MRR. Be specific.
3. Ask for the why. A prompt asking what the churn rate was returns a number. A prompt asking what drove the churn rate change returns an answer you can act on.
4. Specify the output. Table, bullet list, narrative, ranked list: tell the AI. The format should match how you’ll use the answer.
5. Follow up. The first answer is rarely the insight. Treat AI as a conversation, not a one-shot query.
What AI Handles Well, and Where Humans Still Matter
AI is genuinely good at finding patterns in connected financial data, explaining variance, and summarizing in plain language. It is not a substitute for judgment on anything that touches compliance or attestation.
| AI handles this well | Requires human judgment |
|---|---|
| Identifying trends and anomalies in metric time series | Revenue recognition timing and ASC 606 compliance |
| Explaining variance between actual and expected values | Tax treatment of specific transactions |
| Summarizing P&L or cash flow in plain language | Audit-trail documentation and attestation |
| Surfacing which customers, plans, or categories are driving a change | Anything destined for regulatory filings without review |
| Generating first-draft board or leadership summaries | Answers derived from exported or stale data |
The live-vs.-export distinction matters more than most teams realize. AI analyzing a 30-day-old CSV can’t see the payment that failed yesterday, the customer who churned this morning, or the invoice that just went 90 days overdue. And most AI data tools compound this by having the language model itself do the arithmetic: reading numbers, approximating averages, guessing at results. Serious finance decisions can’t rest on approximate math.
How Databox Makes These Prompts Answerable
Every prompt in this article is only as useful as the data it queries. Databox connects Stripe, QuickBooks, and 130+ other sources in a single analytics layer, then exposes that connected data to AI through two paths.
Genie is the AI analyst built into Databox. You ask a question in plain language, Genie analyzes the data, identifies patterns, and explains what’s happening. The key architectural difference from generic LLM wrappers: the language model never touches the math. All calculations run on deterministic, testable domain code against validated data. The LLM interprets your question and narrates the answer, meaning: it doesn’t approximate arithmetic. That’s the difference between plausible-sounding answers and answers you can hand to your CFO.
MCP (Model Context Protocol) connects your Databox data to external AI tools. Claude, ChatGPT, Cursor, n8n — any MCP-compatible client can query your live Databox data directly. You work in the AI tool you already use. The answers come from your real numbers, not from general knowledge or a stale export.
Both paths sit on the same connected-data layer. That’s what makes the cross-source questions answerable, and what makes the Stripe and QuickBooks prompts above return real answers rather than approximations. Browse the full Databox Prompt Library →
Frequently Asked Questions
What’s the difference between asking AI about an exported CSV and asking against live connected data?
An exported CSV is a snapshot. Any change that happens after the export — a payment, a cancellation, an updated invoice — won’t appear in your AI answers. Live connected data means the AI queries what’s true right now, not what was true last week.
Can I use ChatGPT or Claude directly with my Stripe and QuickBooks data?
Yes, through Databox MCP. Once Databox is connected to Stripe and QuickBooks, MCP exposes that connected data to Claude, ChatGPT, Cursor, n8n, and other MCP-compatible tools. Without that connection, you’re stuck with exports, which creates the stale-data problem.
Why do cross-source questions need connected data rather than separate queries?
Stripe and QuickBooks use different data models and don’t share customer identifiers by default. A question about LTV and payment cycle speed needs subscription data from Stripe matched to invoice data from QuickBooks. Without a unified layer, you’d need to manually merge and reconcile before the AI could analyze anything.
How specific do my AI prompts need to be?
Specific enough to name the metric, the time period, and the comparison. “How’s my revenue?” is too vague. “What is our MRR this month, and how has it trended over the last six months?” — the library prompt above — is specific enough to get a usable answer.
What financial questions should I not trust AI to answer without human review?
Revenue recognition timing, tax treatment, audit documentation, and anything headed for a regulatory filing. AI is strong at pattern recognition and summarization but lacks the judgment accounting compliance requires. Use AI to accelerate analysis, not to replace the review that happens before anything hits official records.
How does Databox make sure AI answers are accurate rather than approximated?
Databox separates the language model’s role from the computation layer. The LLM interprets your question and narrates the result in natural language, but every calculation runs on a deterministic analytics engine against validated data. The LLM never does the math. That separation is the difference between reliable business intelligence and AI guessing at arithmetic.