Table of contents
TL;DR
Self-service analytics lets SaaS operators ask a business question and get a trusted, metric-backed answer without waiting on an analyst.
Here’s what that requires in practice:
- A definition isn’t enough. Every metric needs an owner who maintains it when the business changes.
- Governance creates self-serve, not tools. Most BI rollouts fail at the metric and distribution layer, not the tooling layer.
- The hard problem is definitions. What counts as churn? Which ARR figure goes in the board deck? Settle these first.
- AI is what finally makes self-serve accessible to everyone. Natural language queries mean anyone can ask a business question without knowing which dashboard to open. But the LLM should never do your math.
- The benchmark: a decision-maker asks a question, gets a governed answer, and takes action in the same working session. Everything else is implementation detail.
The problem self-service analytics is supposed to solve
A CEO opens the Monday revenue review and sees two numbers that should agree — but don’t. Pipeline coverage is 2.1x in the board deck and 1.6x in the RevOps dashboard. She asks out loud: “Which one is right — and why are we debating the number instead of the plan?”
That moment is what self-service analytics is supposed to prevent. Not by giving everyone more charts, but by making answers fast, consistent, and defensible.
What is self-service analytics?
Self-service analytics is an operating model where non-technical business users can ask a business question, get a trusted, metric-backed answer, and take action, without waiting on an analyst, opening a ticket, or exporting to a spreadsheet.
It’s distinct from self-service BI (business intelligence), which refers to the tooling category – Databox, Tableau, Power BI, Looker, and their peers. Self-service analytics is the outcome those tools are supposed to enable. You can have every BI tool on the market and still not have self-service analytics if nobody trusts the numbers or knows which dashboard to open.
Why it matters specifically for SaaS companies
In a SaaS business, the questions that drive decisions are fast, frequent, and cross-functional:
- Did CAC spike because paid got expensive or because our conversion rate fell?
- Is NRR slipping in a specific segment, or across the board?
- Are we at risk of missing pipeline coverage before the board meeting?
These aren’t annual strategy questions. They come up every week. Routing them through a one- or two-person analytics team (which is the reality for most mid-market SaaS companies) means the analyst bottleneck isn’t strategy or execution. It’s the analytics queue.
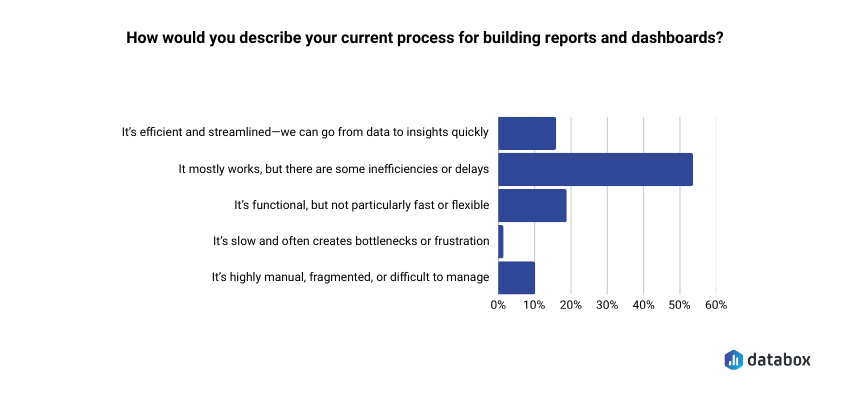
In Databox’s Time to Insight study, only 16% of companies describe their current process for going from data to insight as efficient and streamlined. For SaaS teams managing monthly recurring metrics, that lag is a competitive disadvantage. By the time the analyst queue clears, the decision window has often already closed.
The cost shows up at the individual level too.
“I know what questions to ask about user engagement patterns in our wearable devices, but I am hindered by my lack of SQL skills to query the underlying event data. If I could query our product database in natural language, I could make product prioritization decisions in hours rather than days. Waiting three days for answers means we’re always playing catch-up with last week’s data rather than this week’s.”
How self-service analytics actually works: the four layers
Most self-serve implementations fail because one of these four layers is broken or missing:
1. The metric layer: one definition, enforced
Every governed metric needs a single authoritative definition, a named owner, and version history. Without this, you get metric drift: ARR means one thing in the board deck and something slightly different in the CRM. The result isn’t a data problem; it’s a decision problem, because two teams are optimizing for different numbers.
A Metric Library, a documented single source of truth for every metric that drives weekly decisions, is the foundation. For most SaaS companies, that starts with eight to ten metrics: ARR, NRR, pipeline coverage, churn rate, CAC, gross margin, win rate, and cash burn.
2. The access layer: the right granularity for the right role
Executives need summary views with clear variance explanations. Operators need drill-down. Giving everyone access to everything sounds democratic, but creates noise and erodes trust when numbers look different depending on how you cut them.
Role-based access is more than a security decision: it’s a design decision about what each person actually needs to make their specific decisions.
3. The distribution layer: answers where decisions happen
A dashboard that nobody opens during the Monday revenue review is shelf-ware and not self-serve. Self-serve analytics works when metrics show up inside the workflow where decisions already get made: the weekly review, the Slack channel, the board prep doc.
Distribution is the most underinvested layer. Most teams build dashboards and assume people will go look. They don’t.
4. The action layer: context built in, not bolted on
Executives act on explanations, not on numbers. If NRR dips 2 points, the metric alone doesn’t tell you whether it was driven by downgrades in one segment or broad-based churn. Self-serve analytics has to ship context alongside the number; otherwise you’ve replaced one bottleneck (waiting for the analyst) with another (figuring out what the number means).
Self-service analytics vs. self-service BI: what’s the difference?
These terms are often used interchangeably, but the distinction matters in practice.
| Self-Service BI | Self-Service Analytics | |
| What it is | The tooling category | The business outcome |
| Examples | Tableau, Power BI, Looker, Databox | Fast, trusted decisions without analyst dependency |
| Where it fails | Rarely — tools mostly work | Frequently — at the metric, governance, and distribution layer |
| What you need | A license | Metric definitions, ownership, and workflow integration |
Buying a self-service BI tool is the beginning of the process, not the end. Most SaaS teams discover this about six months after rollout, when the dashboard count has tripled but the Slack messages asking “which number is right?” haven’t stopped.
Where self-service analytics breaks down
Definitions without owners. A metric definition that nobody is accountable for maintaining will drift. When the pipeline definition quietly changes from “any open opportunity” to “opportunities with next steps logged,” every downstream report changes with it and nobody knows why the numbers shifted.
Exploration without guardrails. Giving every operator unlimited slicing and dicing without a semantic layer doesn’t democratize data – it multiplies unofficial metrics. Within months you have ten versions of “churn” and no authoritative one.
Stale or inconsistent data. SaaS executives will tolerate late data once. They won’t tolerate wrong data. If the same metric calculates differently depending on which report you open, budget and headcount decisions become political rather than analytical.
How AI makes self-service analytics work for everyone
Until recently, self-service analytics was self-service in name only. In practice, it meant self-service for power users: people already comfortable navigating BI tools, applying filters, and knowing which dashboard to open. Everyone else still sent a Slack message to the analyst.
AI changes that equation fundamentally.
Databox CEO Pete Caputa faced exactly that choice before a leadership meeting: pull someone from marketing into an async reporting loop, or walk in without the numbers. Using our AI analyst, Genie, he pulled a full cross-platform ad spend breakdown (MTD spend by platform, Google Ads split by search vs. YouTube, branded vs. non-branded) in about 90 seconds, without involving anyone else.
“It eliminates a lot of conversations that I used to have,” he says. “And for the ones that I do have, I don’t have to start with ‘how is this performing’, I can start with ‘what can we do to improve this.’
The same shift happens at the operator level. Ali Wert, Director of Content Marketing & Brand at Databox, used to spend 30 to 60 minutes manually drilling across multiple dashboards for her weekly lead and pipeline pacing report. She asked Genie to locate her custom metrics, generate a MoM comparison, drill down by original source, and produce a summary ready to paste directly into a Slack leadership update. It took three minutes.
That’s the real promise of AI in analytics: it extends self-serve from the technically confident to genuinely everyone. A CFO, a CS lead, or a regional sales manager can ask a business question in plain English and get a governed, metric-backed answer — without SQL, without a BI training course, and without a three-day wait.
But the architecture underneath it matters enormously. There’s a critical distinction between AI that translates a question into a query against governed metrics, and AI that performs the calculation itself.
The LLM should never do your math.
When an exec asks “what changed in churn this month?”, the right architecture queries the actual churn metric, slices by segment, and returns computed results. The language model handles the translation: plain English in, structured query out, while the computation happens against trusted, governed data.
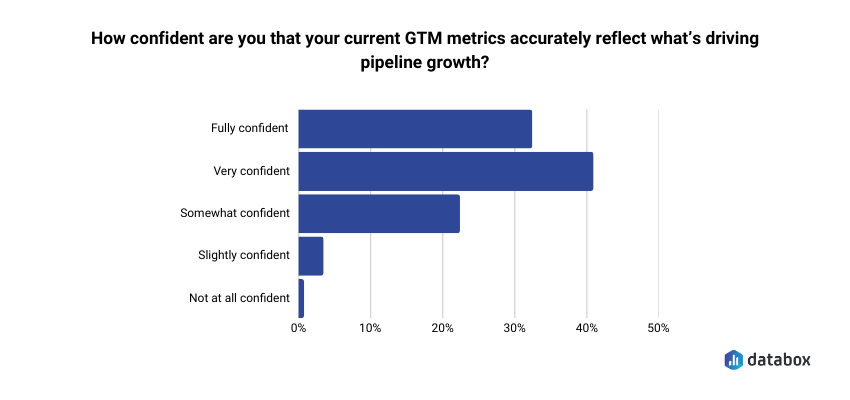
The risky path is letting the language model perform the arithmetic directly. That’s how you get confident-sounding explanations with unauditable calculations underneath them. Our research on attribution found that fewer than 1 in 3 GTM leaders are fully confident their metrics accurately reflect what’s driving pipeline growth.
Letting an LLM do math on top of metrics that fewer than 30% of executives already trust doesn’t fix the confidence problem, it buries it deeper.
The question to ask any AI analytics vendor is simple: where does the computation happen? The answer tells you whether AI is extending your metric layer or bypassing it entirely.
Getting started with self-serve analytics: the right order of operations
Most self-serve rollouts fail because they start with the dashboard and work backward. The order that actually works:
1. Define your top ten metrics first, before anyone builds a view. ARR, NRR, pipeline coverage, churn, CAC, gross margin, win rate, burn. Write down the exact calculation for each one.
2. Assign metric ownership. One person signs off on definition changes and is the named contact when numbers conflict. A definition without an owner decays.
3. Map metrics to decision cadences. Which metrics get reviewed Monday morning, which get checked before a board meeting, which trigger action if they move 10% in either direction? Then push those metrics into the meeting, the Slack channel, or the inbox where the decision already happens.
4. Choose tooling that enforces the metric layer, not just one that makes dashboards easy to build. The question to ask any vendor: where does the computation happen?
5. Add AI queries only after the metric layer is clean. AI answers are only as trustworthy as the definitions underneath them. An exec who gets a confident AI-generated answer built on an ungoverned metric is worse off than one who waited two days for a verified number.
What good looks like: the self-serve analytics benchmark
Self-serve analytics is working when:
- A decision-maker can ask a business question and get a governed, metric-backed answer in the same working session
- The exec team spends Monday’s revenue review choosing actions, not debating definitions
- Analysts are maintaining the metric system, not producing one-off reports
- When a number looks wrong, there’s a named owner to call, not a Slack thread that ends with “can someone pull this?”
If your team can’t clear that bar, the problem usually isn’t the tool. It’s the metric layer underneath it.
“For us, the transparency and awareness, the alignment with the team has been really accelerated. We had the ability for everyone to gather around and agree on what metrics are the ones that matter to us that everyone should know and everyone should be focusing on. Databox saves us 3 or 4 days per month.”
Frequently Asked Questions
What’s the difference between self-service analytics and self-service BI?
Self-service BI refers to the tooling category – Tableau, Power BI, Looker, and similar platforms. Self-service analytics is the outcome: business users making faster, trusted decisions without analyst dependency.
You can have every self-service BI tool on the market and still not have self-service analytics if the metrics aren’t governed, the definitions aren’t agreed on, or nobody opens the dashboards during actual decision-making meetings. The tool is a prerequisite, not the destination.
What are the main benefits of self-service analytics for SaaS companies?
Three benefits matter most in a SaaS context. First, decision velocity: teams stop waiting two to three days for answers and start acting on this week’s data instead of last week’s. Second, metric alignment: when ARR, churn, and pipeline coverage mean the same thing across every team and every report, you eliminate the definition debates that slow down exec reviews. Third, analyst leverage: instead of producing one-off reports, your analytics function maintains the metric system that lets the whole company self-serve. That’s a better use of a scarce, expensive resource.
How does AI fit into self-service analytics?
AI is what finally makes self-service analytics accessible to everyone, not just power users. Natural language queries mean anyone in the business can ask a question in plain English and get a governed, metric-backed answer: no SQL, no BI training, no analyst ticket required.
The constraint isn’t AI itself, it’s where computation happens. AI should translate questions into queries against governed metrics; the computation should happen against trusted data, not inside the language model. The LLM should never do your math. When it does, you get confident-sounding answers with no audit trail, which is harder to catch and correct than a delayed but verified number.
What’s the biggest reason self-service analytics implementations fail?
Starting with dashboards instead of definitions. Most rollouts begin by purchasing a BI tool and building views, then discovering six months later that the same metric looks different depending on which report you open. The implementations that work start by documenting the eight to ten metrics that drive weekly executive decisions, assigning an owner to each one, and only then building the views on top. Governance first, dashboards second.