Go-to-market alignment starts with a single source of truth.
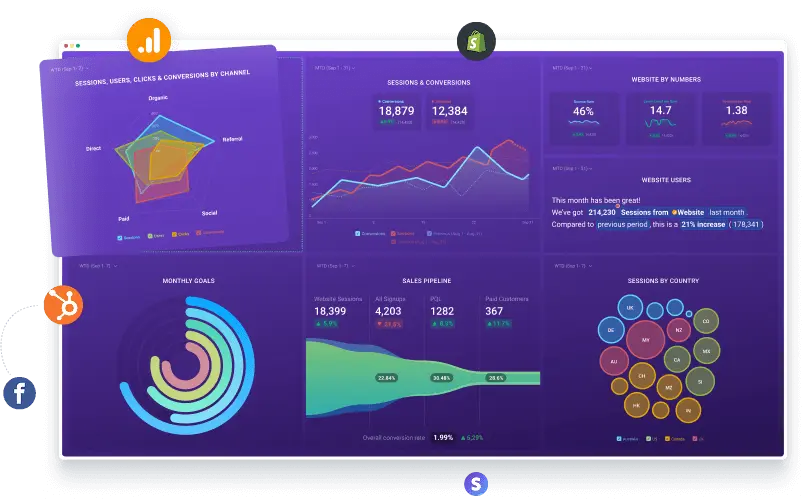
If your marketing, sales, and RevOps teams can’t align on go-to-market metrics, they’ll never agree on results. Databox unifies GTM metrics across teams so your entire go-to-market strategy runs on shared, real-time data. Eliminate reporting silos, reduce friction, and make smarter decisions faster with GTM dashboards built on a central source of truth.
Misaligned metrics = missed goals
Nearly half of GTM leaders say their teams are misaligned on which go-to-market metrics matter most.
- Over 50% say disagreements on KPI definitions slow them down.
- 1 in 5 say it outright derails decision-making.
When teams aren’t rowing in the same direction – or even working off the same numbers – progress is impossible to measure.
With Databox, you can establish a single source of go-to-market metrics.
- Establish shared (and agreed-upon!) GTM metrics
- Quickly create and share cross-functional dashboards
- Align revenue-driving teams
With Databox, you can keep all teams – from Sales to Marketing to RevOps – rowing in the same direction
See how GTM leaders are tracking top metrics with Databox.
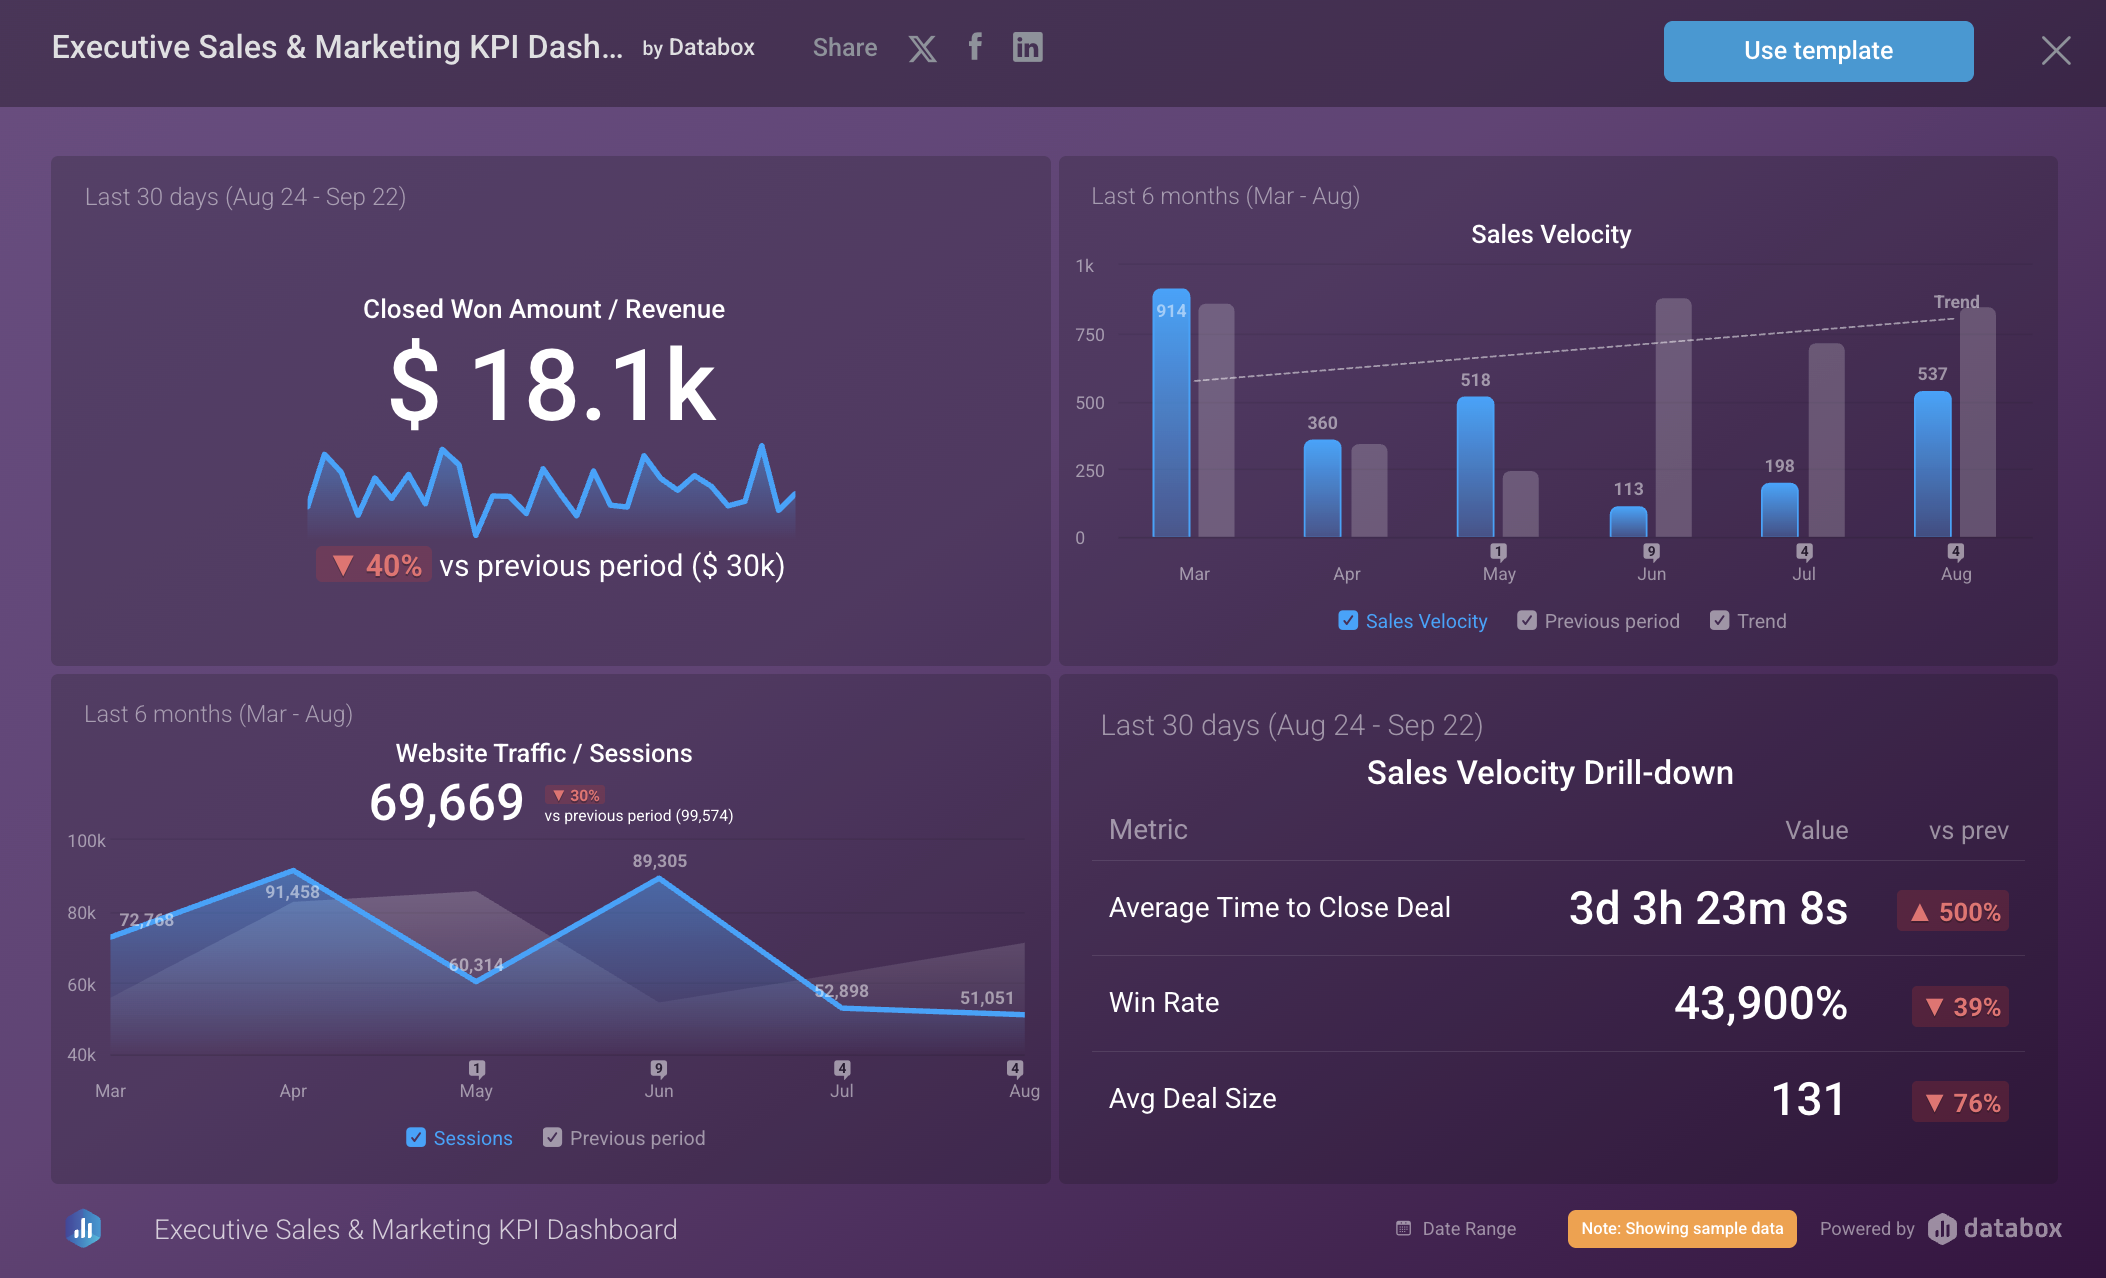
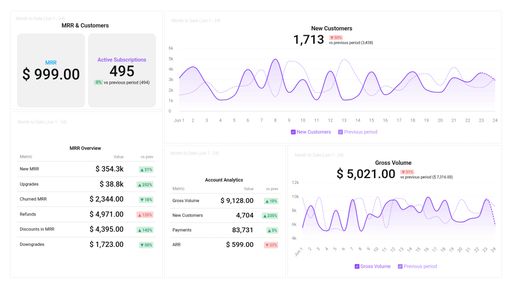
Executive Dashboard (Template)
Across all GTM functions, including Executives, revenue is the #1 metric totrack.
But given all the recent shifts in SEO and AI, it’s not surprising that execs have their eye on web traffic, too.
This HubSpot CRM and Marketing dashboard template shows the top four metrics tracked across GTM and Executive leaders, based on our recent research study.
Want to build this dashboard yourself?
Get the free template
Want us to build it for you? (It’s free!)
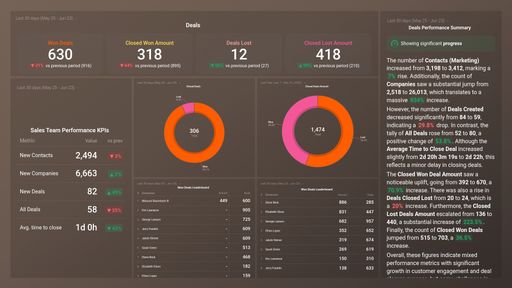
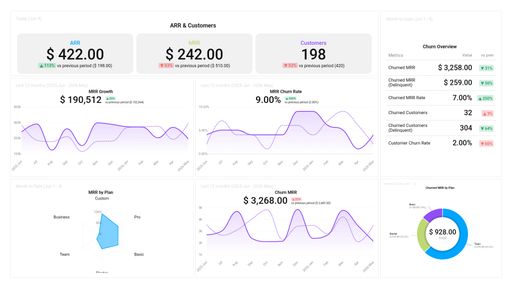
RevOps Leadership Dashboard
Pipeline velocity is king for the RevOps function. And, of course, revenue (it’s in the name, after all!). But RevOps also takes a holistic view: monitoring leading indicators like SQLs and social media engagement.
This dashboard shows the top five metrics RevOps leaders track, based on our recent research study.
Want to build this dashboard yourself?
Explore plug-and-play templates
Want us to build it for you? (It’s free!)
Get your free dashboard
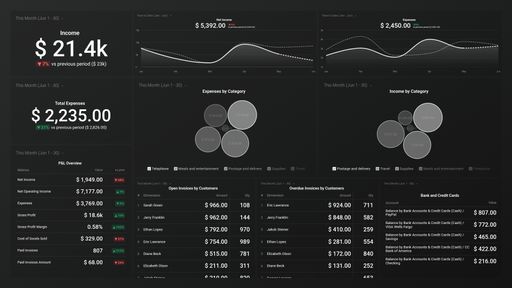
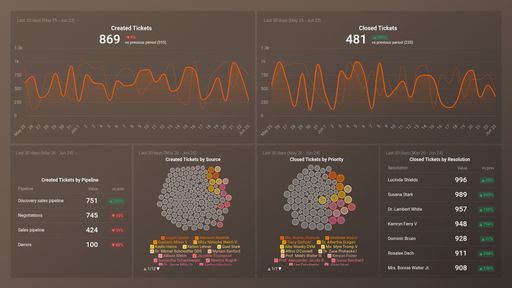
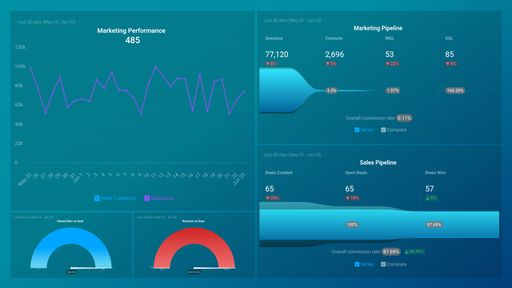
Marketing Leadership Dashboard
Marketing leaders prioritize connecting activities to impact. To do this, they align brand KPIs like traffic and engagement with go-to-market metrics like pipeline velocity and revenue.
This dashboard shows the top five metrics that marketing leaders track, based on our recent research study.
Want to build a leadership dashboard yourself?
Explore plug-and-play templates
Want us to build it for you? (It’s free!)
Get your free dashboard
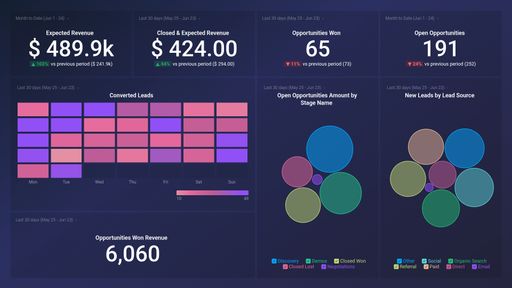
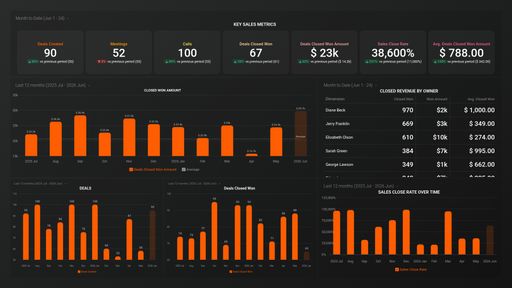
Sales Leadership Dashboard
Not surprisingly, sales leaders prioritize revenue and pipeline velocity, but also monitor MQLs, win rates, and conversion trends.
This dashboard shows the top five metrics that sales leaders track, based on our recent research study.
Want to build a leadership dashboard yourself?
Explore plug-and-play templates
Want us to build it for you? (It’s free!)
Get your free dashboard
“When there is transparent information sharing and a shared understanding of goals, it becomes easier to align on priority metrics and avoid misunderstandings across departments.”

Explore plug-and-play templates


Don’t see a template that matches your needs?
You can build a dashboard with any data using Zapier, Make, Google Sheets, or a SQL database.
Or reach out and we’ll build a custom one for you (it’s free).
Frequently Asked Questions
What are the top KPIs tracked by GTM teams?
According to a 2025 study by Databox, the top five metrics tracked by GTM teams are: 1) Revenue, 2) Website traffic, 3) Pipeline velocity, 4) Payback, and 5) Click-through rates.
How do you measure GTM effectiveness?
According to a 2025 study by Databox, the majority of teams prioritize revenue as the key metric for go-to-market effectiveness.
Why do GTM teams struggle to align on metrics?
A 2025 research study by Databox shows nearly half of GTM leaders say their teams are misaligned on which metrics matter most. Different tools, inconsistent definitions, and siloed reporting all contribute. Without a shared source of truth, every team ends up working off “their own numbers.
How does Databox help eliminate misalignment?
With 130+ integrations, Databox centralizes all your data into one platform. That means Marketing, Sales, RevOps, and Finance are all reporting from the same source of truth instead of debating which numbers are “the right ones.
Can each team still track the metrics they care about in Databox?
Yes. While teams can and should track the same set of metrics, every team can customize dashboards for their own role and priorities. Team spaces all for sharing of more granular dashboards specific to each function.
What’s the difference between Databox and building reports manually?
Manual reporting often requires spreadsheets, exports, and reconciliation—consuming hours of RevOps or analyst time. With Databox, dashboards update automatically, metrics are standardized once and reused everywhere, and alerts keep leaders informed in real time.
How fast can we get set up in Databox?
You can connect your CRM, marketing automation, ad platforms, finance tools, and more in minutes. Plug-and-play templates make it easy to start tracking GTM metrics immediately, and if you don’t see what you need, we’ll build a custom dashboard for you (it’s free).
Do we need to pay per user in Databox?
No. Every plan on Databox includes unlimited users on every plan. Everyone on your GTM team can access the same dashboards and reports without extra per-seat costs.
How does Databox help with executive reporting?
Databox makes it simple to create boardroom-ready dashboards and reports that are highly visual and easy to share quickly.
Get Started Now
Compare
Databox Inc.
HQ: Boston, MA, USA
AI-powered analytics for teams that need answers now.
Databox Inc.
HQ: Boston, MA, USA

AI-powered analytics for teams that need answers now.


Compare