Uses one-click integrations:
-
 HubSpot CRM
If you don't use HubSpot CRM, you can pull data from any of our 130+ one-click, native integrations or from spreadsheets, databases and other APIs.
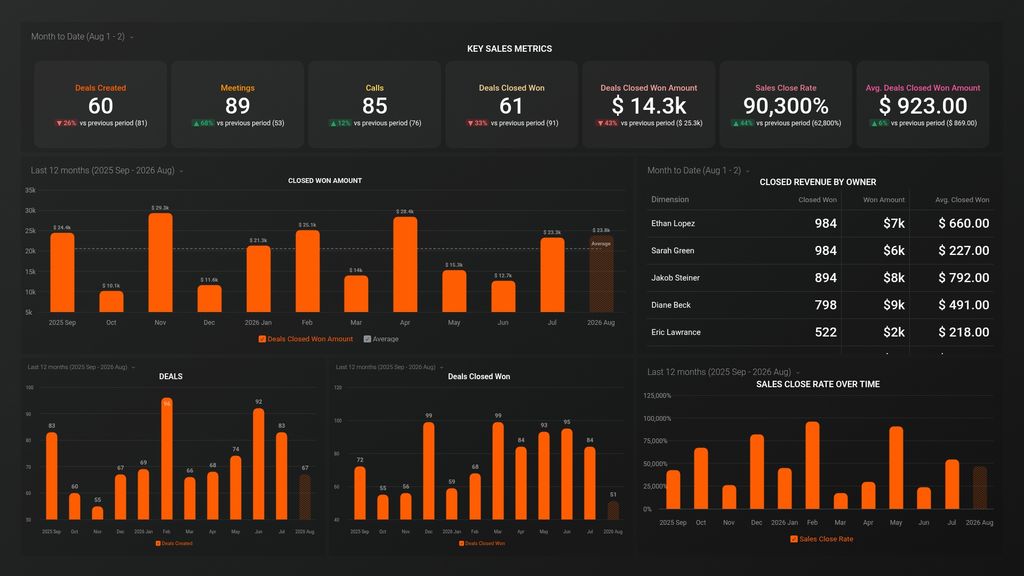
Try this dashboard for freeWhat you’ll learn from this SaaS Marketing Dashboard (CSO) Dashboard Template:
Connect your Hubspot CRM account and learn:
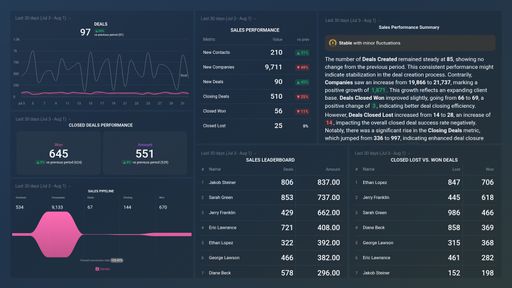
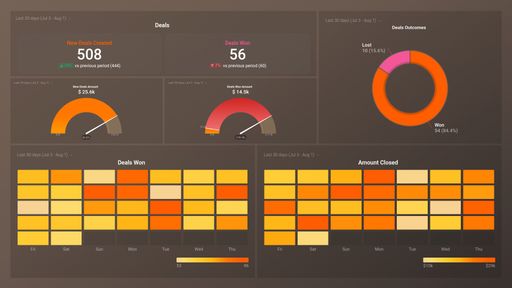
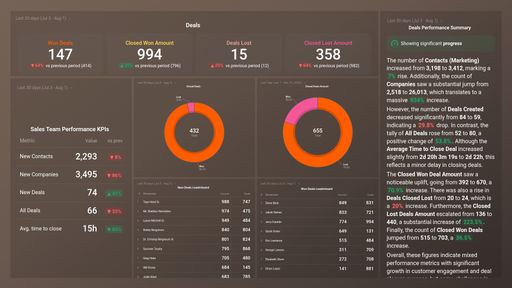
- How many open, closed, and lost deals did you see this month? Track the number of deals created by your sales team and their outcomes, including the number of deals closed, lost, and won so you can measure progress toward goals and prioritize support.
- Discover the changes in your sales close rate over time Gain insights into the trends for your sales close rate by tracking it month over month. When you see significant drops or rioses, you can drill deeper and find what the root cause for either might be and based on that adjust your sales strategy.
- How much revenue can we expect to close from each owner? Measure the potential revenue each member of your sales team can close from newly created deals in a given time period.
- How many customers do we currently have? Measure your customer retention rate by tracking how many customers you have.
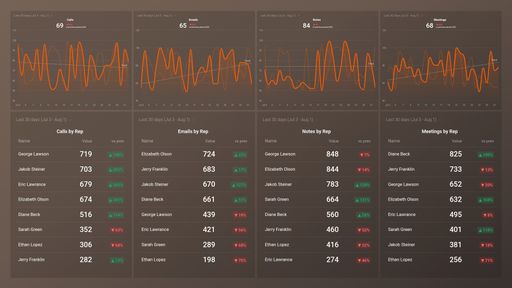
- If you are hitting your goals in terms of calls and meetings Make sure your sales team is on track to hitting their goals when it comes to set number of calls and meetings for a specific time period.
Pull additional data using our deep integration with HubSpot CRM.
What else can you track and visualize with our deep integration with HubSpot CRM? When it comes to sales metrics, almost anything:
- Leads Per Day
- Opportunities Per Day
- Conversion Rate Through Funnel
- Top of Funnel Additions
- Top Sources of Traffic
- Deals this Month
There are many, many different metrics and metric combinations you can track using HubSpot CRM. And in Databox, you can quickly visualize 100s of HubSpot CRM metrics in a variety of different ways, alongside all the important metrics from other data sources you’re using. Read more about Databox’s HubSpot CRM integration.
Explore more HubSpot CRM dashboards.
HubSpot CRM metrics included in this template
-
Closed Won by Owner
A metric that measures the total revenue generated by a sales owner from deals that were successfully closed in Hubspot CRM.
-
Meetings
The Meetings metric in HubSpot CRM measures the number of scheduled and completed meetings with your contacts. It helps to track the effectiveness of your sales and marketing tactics and optimize your outreach strategy.
-
Closed Won Amount by Owner
The Closed Won Amount by Owner metric shows the total amount of revenue generated from closed won deals for each owner in HubspotCRM.
- Average Closed Won Deal Amount by Owner
- Avg. Deals Closed Won Amount