


Table of contents
Google Analytics is one of the most powerful tools you can use to measure the performance of your online store.
However, it is easy to get overwhelmed by the firehose of data, charts, and filters available.
In this guide, we’re sharing 19 tips to help you measure ecommerce performance in Google Analytics, including:
- Make sure your analytics are set up properly
- Create goals in Google Analytics
- Track where conversions are coming from
- Build an ecommerce dashboard
- Set alerts for immediate performance notifications
- Monitor your store’s conversion rate
- Adjust data for seasonality and other trends
- Install Enhanced Ecommerce
- Keep a close eye on the shopping behavior flow
- Gain valuable insights from the Demographics and Interests report
- Create custom audience segments
- Optimize default channel grouping
- Segment by user behavior
- Track individual products and product categories over time
- Pay close attention to first-time buyers
- Monitor new sales compared to inventory levels
- Keep track of the ROI from paid ad campaigns
- Identify top referral sites
- Utilize the Model Comparison Tool to compare attribution models

How often should you review ecommerce performance?
Before we dive into specific tips, you need to know what to look at. Start by defining your KPIs along with the questions you want to answers to.
“Make sure to analyze and set your store’s key performance indicators,” says Lilia Manibo of Anthrodesk. “This is very important since this will be the basis of all your data evaluation.”
These KPIs will give you a roadmap for what to look at in Google Analytics.
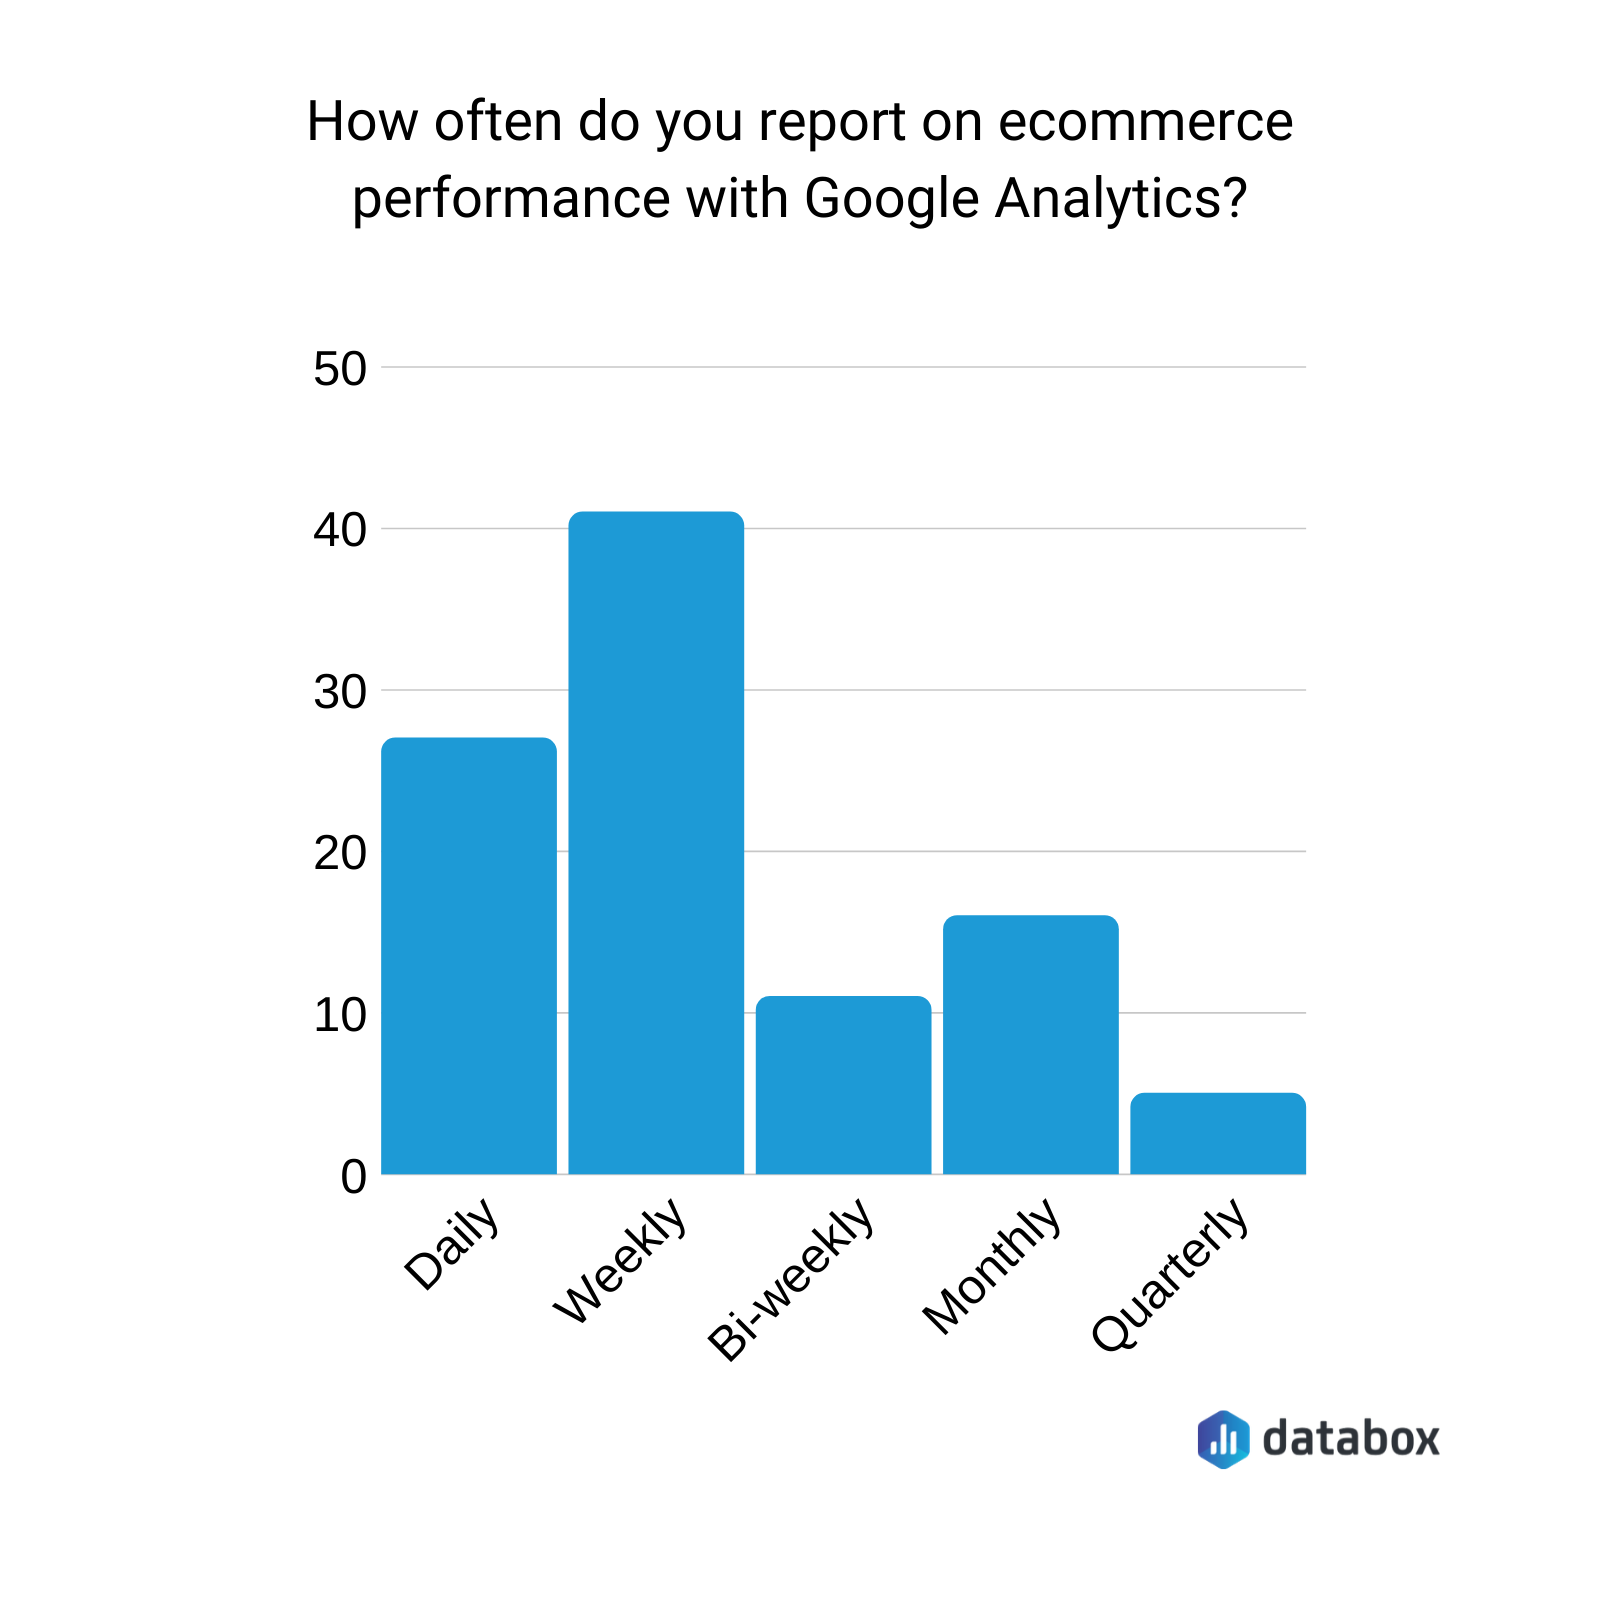
In addition, nearly 70% of the marketers we surveyed recommend reporting on ecommerce performance at least once a week.
1. Make sure your analytics are set up properly
This also seems too obvious to include. However, it is easy to make mistakes when setting up Google Analytics.
“While there are many tips I can provide, my absolute best tip is to make sure tracking is set up correctly,” says Dario Zadro of Zadro Web. “I know this seems like such a basic recommendation. However, I’ve seen many companies and sites get it wrong all the time. Google Tag Manager is my preferred choice for tracking and setting up all the variables needed. Plus, having a GTM setup saves much back with the dev team for updating tracking configurations.”
In addition, Andy Dunkin of Adam Block Design adds, “Make sure your conversion codes and triggers are set up correctly! If your conversions are not tracking properly, all of your data will be skewed and it really can make it difficult to make informed decisions. It’s possible for conversion triggers to fire at the wrong time, or multiple times when set up incorrectly or not functioning, especially when you’re talking about form submissions or lead generation sites. If you receive three form submissions but your conversion tracking registers 5, for example, you may think one form of marketing or a promotional code is doing better (or worse) than it actually is.”
2. Create goals in Google Analytics
“You should set up Goals in Google Analytics in order to measure your conversions and store income,” says Rebecca Beach of MomBeach.com. “This makes it easy to see what pages are converting better in your store. Maybe some sales pages are getting lots of traffic, but few conversions. How can you improve conversions on them? By setting up Goals, you can find out how to improve sales.”
Giovanni Prieto of SocialWolfMedia.com says, “Almost all tracking in Google Analytics is pointless if you don’t have conversion goals set up. This is the most important thing towards successfully understanding what’s working.
Daily will always be best if running a campaign with money behind it pushing people to your website. You can easily spot problems that might cost your business great opportunities or profit if you wait a week.”
“Setting up goals allows you to see how many conversions you are receiving and what that conversion rate is,” says Kevin Olson of Capitol Tech Solutions. “It is very important to set up goals for your ecommerce store because they basically tell you how well your site or marketing campaigns are performing.”
Jerome Williams of JWorks Studios adds, “Set goals/triggers for specific pages. If you want to make sure people are being filtered to the right areas of your store, say checkout, you can set up goals and/or triggers so that when a particular page is visited, or a certain button is clicked, you’ll get data on how much (or how little) visitors are interacting with your site. Very useful for determining if the placements of your call to actions are being seen and if the design/offer is enticing enough to click.”
For example, Jonathan Aufray of GrowthHackers says, “When visitors are on your product page, you want them to click on the purchase button. Once your visitors are on the payment page, you want them to pay their cart, etc. This will allow you to track conversions at each step of your sales process (How many people click on the purchase buttons, how many people enter their payment details, how many people abandon their cart, etc.) and will help you optimize each page.”
3. Track where conversions are coming from
“It’s important to really understand where your site visitors are coming from so that you can make the best marketing decisions moving forward,” says Sumitra Senapaty of WOW Club. “With each advertising dollar precious, when you know where your leads and visits are originating, it makes it much simpler to choose between multiple strategies.” Luckily, with the help of a ecommerce dashboard you can easily track this figure.
David Denning of Jumpstart Go says, “You want to analyze where the traffic is coming from that’s converting the highest, so you want to look at the source/medium in Google Analytics and, preferably, have conversion goals setup. You can then quickly tell if certain sources (Facebook, LinkedIn, email marketing, etc.) are performing best at leading to sales/revenue.”
Brandy Palmer of Green Wellness Life adds, “We run our own ecommerce store that sells a variety of different CBD products and we track performance in Analytics. Assuming ecommerce is properly set up for your business in Google Analytics, I would recommend two things to monitor performance:
1) Make sure to look at conversions by channel if you’re marketing across multiple channels. It’s important to know which ones are performing well so you know which channels are worth investing more in or conversely, which channels may need more love and attention to improve. You can view this by going to conversions -> multi-channel funnels -> overview. You could also create filters for your channels to view revenue by channel.
2) The other thing I would try to do is if you’re creating content, try to tie revenue and conversions back to the content you’re creating. You can see this by going to behavior -> site content -> all pages. Your blog pages will have $ values associated with them based on conversions partially attributed to those pages. This will help you determine the type of content that is working and what kind of content you should continue to create in the future.”
Jeremy Cross of Team Building Los Angeles explains how to set this up.
“To get more accurate data on conversion rates and your ecommerce performance, filter the pages you are looking at,” says Cross. “Most websites have blog posts or content that gets traffic that isn’t very relevant. Since this traffic isn’t really your target market, and there is essentially a 0% conversion rate, exclude it from your analysis. Instead, view the performance of product pages and content that is highly relevant. If you do this filtering then you can better understand your conversion rates and what you can do to improve them.”
Bill Ferris of Decor Interiors adds, “Relevant, well-written and properly formatted article posts typically perform better SEO-wise than e-commerce product or category pages. However, if you’re using a blogging platform like WordPress, you’re probably not capturing data for Google Analytics unless you’ve added the tracking code. This basic consideration is extremely important since these keyword-rich pages bring organic traffic to your site and can boost the value of e-commerce conversion pages.
Once Google Analytics is able to track both blog and ecommerce pages, I like to filter the results to look at each individually. Go to Behavior/Site Content/All Pages and then click Include (or Exclude) pages containing “”blog”” (in our case). This allows you to see how both types of pages do for metrics like page speed. If your blog pages are slow, you can see the Google tips for improvement and look for WP plug-ins to help. You can also see which posts are getting the most views. Are these focused on high volume keywords or niche topics? If the time on blog pages is short, it might indicate that you need to pump up the content to keep visitors more engaged. What is the % Exit like? If it’s high, your internal links to e-commerce conversion pages probably are not being clicked. Maybe you should look at the live page to figure out why not.
Filtering between blog and ecommerce page before doing in-depth Google Analytics analyses is helpful because the purpose and format of both types of pages are usually very different. Technically, their behavior is controlled by different files and scripts. Visually, they are often very different and strategically they have different goals. So, it’s important to evaluate them separately through filtering.”
4. Build an ecommerce dashboard
Louis John Murray of Futurety says, “Creating a simple ecommerce report within Google Data Studio allows us to quickly slice and dice ecommerce data to identify popular products, landing pages, key demographics, and successful marketing campaigns.”
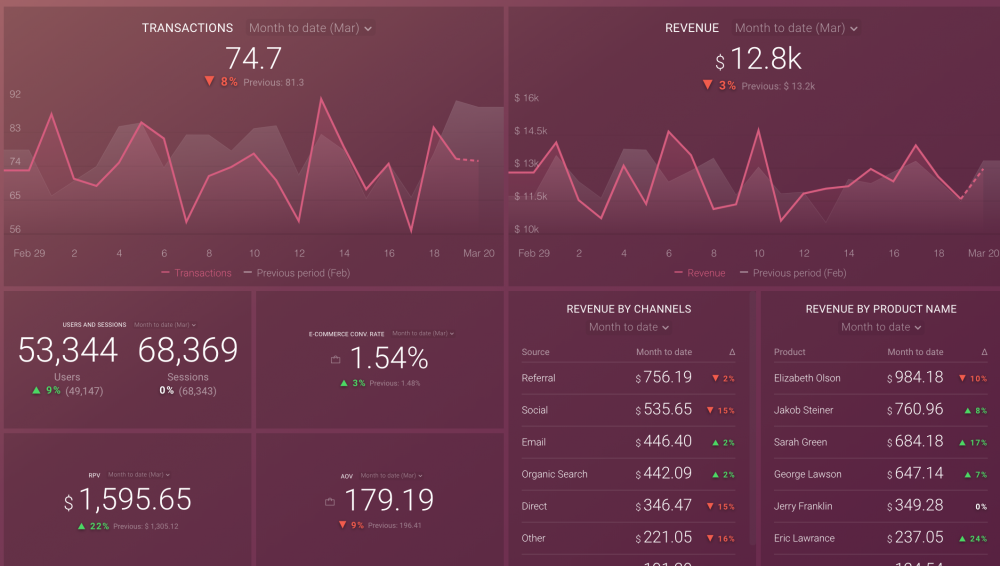
Editor’s Note: Another option is to use this Google Analytics Ecommerce Overview Dashboard which allows you to see revenue, transaction and conversion rate data.
5. Set alerts for immediate performance notifications
Lisa Bongiovanni of CleverFunnel says, “Set alerts as a canary in the coal mine, so you have immediate notifications as to good and bad without having to log in or rely on anyone else to know how your ecommerce site is performing.”
6. Monitor your store’s conversion rate
“If I could provide only one tip for tracking your ecommerce performance in Google Analytics, it would be conversions,” says Nadia Duwaik of Cleure. “After all, conversions equal money earned and at the end of the day that is the main driving force of any ecommerce site. You can have an increase in site traffic, but if you aren’t tracking your conversion rate and implementing measures to increase it, you are missing out on sales.”
Michael Kirkegaard Clausen of avXperten adds, “Check and manage the ecommerce conversion rate on the different devices. This is a percentage of sessions that is resulted in an ecommerce transaction. It is very important to optimize the user experience(UX) on all devices, and I have seen a lot of examples of people forgetting to optimize and improve this regularly.”
7. Adjust data for seasonality and other trends
“This may sound very ecommerce 101, but I’ve worked with a number of online stores who completely forget to temper Google Analytics data against seasonality, trends, major industry events (MacWorld, SEMA, RSA Conference, etc.) or changes/mergers happening with competitors,” says Anton Ross of Split.io. “The key to this approach is to not focus solely on what’s happening “”right now”” in SEO, because there’s a long game to be played, and focusing on micro-moments in data often paints in very little of the big picture.”
8. Install Enhanced Ecommerce
“Enhanced Ecommerce is one of the best reporting features that Google Analytics has to offer,” says Alexis Preston of The Code Wiz. “It provides a complete view of the pre-purchase shopping behavior of users and the performance of actual products. Once you install enhanced ecommerce, you can view different reports such as Shopping behavior, Checkout behavior, Product performance, sales performance, and product list performance. You can install enhanced ecommerce manually or if your website is hosted on Shopify or Magento, there are plenty of plugins available.”
Jeremy Mackey of WhatsTheHost says, “The enhanced ecommerce plugin, created by Google, for Google Analytics is a game-changer for ecommerce tracking.
Instead of tracking user data after the session is complete, this plugin helps track almost every single user interaction before the sale is complete.
You can track product impressions, clicks on a product link, adding and removing items from the cart and much more. These micro-interactions, at scale, can show the “”why”” behind whether a sale was made or not.
I encourage any site owner with some level of traffic to implement enhanced ecommerce to take GA to the next level.”
Rebecca Bowden of Mint Metrics adds, ”Make sure you use the product categories with Enhanced Ecommerce – especially if you have an ecommerce site with 100s of SKUs! Product categories are incredibly helpful at analyzing your ecommerce performance from a wider view.
But first, make sure you create a plan on how you want to categorize your products to answer your top analytics questions.
Once you do this, you can dig into your ecommerce data and answer questions like, Which campaign had the highest average purchase value for shoes?”
PRO TIP: Get Useful, Actionable Data on Your Ecommerce Store’s Performance
To improve the performance of your online store, it’s vital to have access to useful and actionable data. But, with so many metrics available to track, it may be hard to determine which ones will actually help you move the needle.
That’s why we have created a concise dashboard template that only tracks the most important metrics for analyzing the core elements of your ecommerce businesses, such as:
- Transactions and orders. How many transactions does your online store process in a day, a week, or a month? How many orders, and how many were placed on the same day of the previous month?
- Sales volume and trends. See how much money has been generated from sales in the current month. Analyze daily trends to compare with your sales goals and take action to reach them.
- Website traffic trends. Track the number of new and returning visitors to your website and the number of individual sessions initiated by these users.
- Conversion to customers. See what percentage of your website visitors convert to customers.
- Revenue per customer. See how much revenue you get from each unique visitor that interacts with your store during a given time period.
- Amount per transaction. Track the average dollar amount each customer spends on a sale.
- Best-selling products. See your most popular products in terms of volume and revenue in a given period.
And more…
Now you can benefit from the experience of our Google Analytics 4 experts, who have put together a plug-and-play Databox template showing the most important KPIs for monitoring your online store’s performance. It’s simple to implement and start using as a standalone dashboard or in ecommerce reports!

You can easily set it up in just a few clicks – no coding required.
To set up the dashboard, follow these 3 simple steps:
Step 1: Get the template
Step 2: Connect your Google Analytics 4 account with Databox.
Step 3: Watch your dashboard populate in seconds.
9. Keep a close eye on the shopping behavior flow
“Keep a close watch on your shopping behavior flow as your conversion rate is key to running a successful ecommerce store,” says Alistair Dodds of Ever Increasing Circles. “Monitor particularly the flow from sessions with add to cart, sessions with checkout, and sessions with transactions. Any sudden reduction in flow will indicate an issue with your checkout process and, potentially, site speed issues. So close monitoring and analysis of this flow is essential.”
Shawn of LostnLoveCo says, “What this does is tracks your users’ entry and where they go throughout your site until exit. This provides so much data as to where your potential customers are going and where your site is seemingly directing them. This data allows you to follow the path and find out where your strong pages are and where you need to make some adjustments. By using this I was able to discover that I had a very strong blog post that brought in traffic and customers were going to my store but leaving. What I did was adjust the links on this page to direct them to some more content-oriented products and this created more engagements with my items and more shopping cart visits.This tool is invaluable when needing to find out how to improve your sales funnel.”
Obaid Khan of Planet Content adds, “You can better understand user intent by checking whether users are finding the right content when they use transactional keywords. The Users Flow report shows you where a user landed and whether they continued to browse your website (and what they looked at). This shows you which keywords potentially drive conversions, what pages/products drive impulse, and ultimately, what kind of users you should be targeting.”
10. Gain valuable insights from the Demographics and Interests report
“You can use their Demographics and Interests reports to better understand more about online store visitors,” says Alexandra Zelenko of DDI Development. “By measuring users and sessions and comparing your numbers periodically (monthly, quarterly, annually), you can determine if your audience is growing, and if so, how quickly (or slowly). It’s crucial to have a mix of new and returning users, though the exact percentages vary by industry, goals, and more. Returning users are a positive sign since they indicate that people are thinking about your ecommerce brand, and may be thinking about making a purchase.”
11. Create custom audience segments
“Set up custom audience segments around specific groups like cart abandoners or repeat purchasers,” says Jasmine Hippe of Augurian. “This will allow you to easily track the size of these groups and understand their site behavior using the Audiences report.”
12. Optimize default channel grouping
“Optimize the Default Channel Grouping and ensure referrals are in the correct category,” says Brandon Chopp of iHeartRaves. “We receive traffic from a wide range of sources and the Channel view aggregates our data to give us a broad view of each channel. At iHeartRaves, we’ve been focusing on increasing our marketing efforts on social media and the Google Analytics’ Channels has helped us track our Paid & Organic Social channels easily and effectively.
13. Segment by user behavior
“The best way to track ecommerce performance is to segment by behavior and to make sure that you look at the content that all pages report,” says Basil Larios of Falcon Marketing. “By doing so, you will be able to track behavior by page and ultimately understand which products are doing the best. Alongside this tip, we would also suggest that those with online stores or ecommerce websites install an in-page analytics tool on their site in order to track the performance of their items in real-time. This will in turn make the insights you get from your store overview dashboard richer.
For our client CWSpirits, an online spirits retailer, the product is constantly moving and competitive pricing adjustments are implemented regularly throughout the week which is why we report performance analytics three times daily.”
14. Track individual products and product categories over time
“I like to look at granular product data, so I keep tabs on the Product Performance report,” says Joe Karasin of POSH Digital Media. “This is helpful for both sales tracking and marketing efforts. I then feature higher-performing products in ads.”
Max Allegro of Intuitive Digital adds, “Track your individual product and product category performance over time. Product Category (under the Ecommerce – Overview tab) will tell you your biggest revenue drivers by category. This is an excellent place to start to find what types of products your store is performing well in, and which may be underperforming.
Dive deeper by clicking in to see the Sales Performance for the products within each category. Look for the top-performing products that have the highest revenue, unique purchases, and quantity purchased to give you insight into what your customers interested in. Use this info to focus promotions on what customers are looking for, and to find out which underperforming products may need a little extra love.”
Editor’s note: In ecommerce reporting software like Databox, you can create custom dashboards with ad performance overviews by a specific campaign, and performance overviews by product or product category.
15. Pay close attention to first-time buyers
“Always remember that it’s important to note your first-time customers or new clients,” says Alexandra Zamolo of Beekeeper. “You’ll want to pay special attention to these accounts, whether it’s an automated message to offer savings off their next order or a free trial on the next service plan up, you’re missing out on a valuable source of additional revenue if you don’t have a strategy in place.”
16. Monitor new sales compared to inventory levels
Frank Spear of Awesome Motive says, “Business owners with online stores can quickly find themselves in trouble if they are not tracking their inventory versus sales. Don’t forget to stock up before big promotions!” Keep an eye on this data using these free ecommerce sales dashboards.
17. Keep track of the ROI from paid ad campaigns
“One important thing to track is the visitors that are landing on your site by way of a paid advertisement,” says Angela Ash of Flow SEO. “There are many reasons for this, with the top one being that you’ll need to know whether your advertising dollars are working for you or not. This way, you can always make a pivot and implement a new strategy when the need arises.”
For example, Kim Hawkins of EventsWholesale.com adds, “As an ecommerce company, Google advertising drives the majority of our business at www.EventsWholesale.com. Monitoring our Google Analytics has been vital to ensuring we make money from all of our advertising efforts. Analytics shows us exactly which keywords convert into sales, and which ones do not. By closely monitoring our keywords and conversions, we ensure that we do not waste a lot of money on poorly converting keywords. We also advertise through Bing and Yahoo ads, Facebook, Pinterest, and YouTube, but most of our revenue consistently comes through Google. We are able to monitor the results of all of our advertising efforts through Google Analytics. Because the market is constantly changing, it is vital to our business that we stay on top of statistics and keyword information. Google Ads has been a great investment for our business, and the results of our advertising have kept us in business for the past 13 years.” Easily track key parts of your online store’s PPC campaign in one place with this paid ads ecommerce dashboard.
18. Identify top referral sites
“Identify your best-performing referral sites,” says Andrea Loubier of Mailbird. “These are the sites that your customers are clicking from to visit your page. Obviously, this is important to track so that you can see where your visitors are coming from and, if this is associated with your paid advertisements, react accordingly.”
19. Utilize the Model Comparison Tool to compare attribution models
“One of the most insightful views in Google Analytics for Ecommerce performance is the Model Comparison Tool,” says Matt Hughes of This Digital. “This allows you to compare how different attribution models impact the valuation of your marketing channels.
The Model Comparison tool can be found by navigating to:
Conversions > Multi-Channel Funnels > Model Comparison Tool
In short, attribution models determine which marketing channel (Paid Search, Social, Organic, etc.) a conversion is attributed to.
For example, the default attribution model in Google Ads is the ‘Last Click’ model – this attributes a conversion to the marketing channel a user last clicked before converting.
The problem here is that a customer could have clicked through 5 Paid Search ads prior to visiting the website directly and converting, and yet ‘Direct’ will get all the credit, skewing your perception of how other channels are performing.
Luckily, there are several other attribution models, which can provide a much more accurate representation of how your marketing channels are working together to drive conversions.
For example, the ‘Position-Based’ model attributes a large portion of each conversion to the channel which first drove a user to your website, and another to the channel which a user visited the site immediately prior to the conversion; it also attributes a small portion of each conversion to any channels which a user used in between the two. This is just one of the models which provide an alternative perspective on how your marketing channels are really impacting performance..
There are also some other interesting attribution models, all of which provide useful insights – definitely a topic I’d recommend reading up on.”
When it comes to tracking ecommerce performance, these are 19 tips that you can use to figure out what is and isn’t working.


