


Table of contents
Hello everyone. Welcome to another episode of Data Snacks. I’m Monja, the product marketer at Databox.
Today, we’re going to talk about conversion rates, with a special focus on sources. After all, you want to know which of your marketing investments is driving the most conversions so you can double down or make adjustments.
In this episode of Data Snacks, I’m going to show you:
- How to track contact and customer conversions by source
- Other metrics that matter when it comes to conversions
- What you can do to increase your conversion rates by source
Below, you can view the full episode or keep reading for a fully transcribed version of the episode, complete with relevant screenshots.

Let’s start!
Let’s Choose the Right Source Metrics
We are starting in Databox and using HubSpot Marketing as our data source.
First, we will navigate to the Databox Designer. Adding metrics is easy. Simply choose the data source from the Metrics Library here on the left and drag-and-drop some of the available pre-built metrics.
Since I am using all basic metrics in this video, I am just going to drag and drop the following – Contact Conversion Rate by Source and Customer Conversion Rate by Source to see which sources are bringing the most conversions. Now, for those conversions to actually happen, visitors need to stay on our landing pages and not bounce. So let’s add two more metrics, Average Time on Page and Bounce Rate by Source, so we can track these leading indicators here, too.
In Databox, you can easily choose which visualizations to use to best depict your data. On this databoard, I have chosen the table, pie chart, and gauge visualization to clearly show the data I want to see and interpret.
Now, before we start interpreting our dashboard, I want to distinguish between contacts and customers. Simply put, a customer is assigned to transactions like estimates, invoices, and sales orders, while the contact is assigned to CRM interactions like activities and cases. We need to track conversions by source for both types of records since the information we are looking for is which source drives the most total conversions.
Pro Tip: Your Go-To Dashboard For Doing a Deeper Dive on Website Traffic and Conversion Sources
Struggling to find an easy yet effective way to gain a comprehensive understanding of your traffic sources, user behavior, and revenue generation?
You can do all that and more with our plug-and-play GA4 Acquisition dashboard template:
- Understand user acquisition: See where users come from, tailor outreach, and track new user growth;
- Focus on high-performing channels: Identify top channels, optimize resource allocation, and adjust underperformers;
- Track revenue & engagement: Monitor revenue growth, active users, and the effectiveness of your campaigns;
- Go beyond traffic & conversions: Gain deeper insights into demographics, sales, customer journeys, ARPU, and more;
- Optimize marketing & drive results: Make data-driven decisions to improve your marketing strategy and achieve business goals.

You can easily set it up in just a few clicks – no coding required.
To set up the dashboard, follow these 3 simple steps:
Step 1: Get the template
Step 2: Connect your Google Analytics 4 accounts with Databox.
Step 3: Watch your dashboard populate in seconds.
So, What Does The Data Tell Us about Our Sources
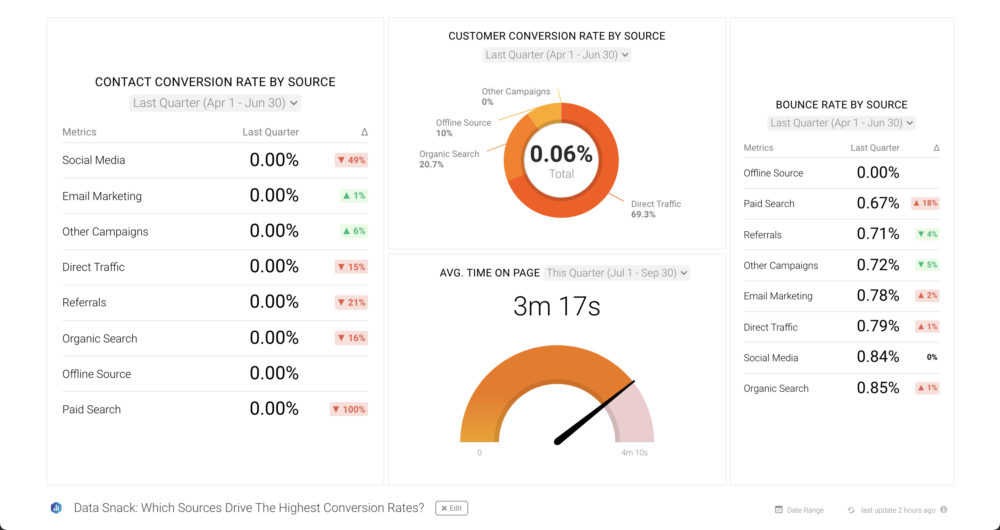
Now let’s look at the data. I have set the date range to the last quarter so I can cover more campaigns from different sources. That is something you also need to consider, as you might have had marketing campaigns on some channels and not on others, which can cause a difference in conversion rates.
In this case, for Contact Conversion Rate by Source, the sources driving the most conversions are social media, email marketing, and referrals. In contrast, for Customer Conversion Rate by Source, the data tells a different story. We can see overlap when it comes to social media and referral. At the same time, direct traffic is responsible for most of our conversions. The overlap still lets us know which sources are the ones that are more consistently performing well.
Now let’s look at Bounce Rate by Source. Here we can see that referrals have the lowest bounce rate out of the overlapping sources we just analyzed.
As you can see, the data tell a story when it comes to discovering which sources bring in the highest conversion rate, but it might not always correlate with other metrics that you choose to measure, such as bounce rate.
When it comes to increasing your conversion rates in general, you might want to consider different tactics. Conversions happen when visitors come to your landing pages, so the source does its job and attracts visitors, but it is your landing page optimization and effective CTAs that convert them. That is why we have the Average Time on Page metric included in this dashboard, as you want to know if people stay long enough to convert.
Time to Track Our Sources
Achieving high conversion rates from different sources is often a matter of testing and analysis. But by having the right data available for visualization and using data insights to frame your strategy, you can formulate a more reliable, repeatable approach when it comes to investing time and money into specific marketing sources.
If you need help tracking and visualizing which sources drive the highest conversion rates, our Support team can actually help build your first dashboard for free.
Just create your free Databox account and reach out to our team either via chat or email.
See you next time.


