


Table of contents
Hi there, Vimeo OTT users 👋
Today we’re excited to announce our new integration with Vimeo OTT, allowing you to track and visualize the performance of your streaming videos in Databox.
With this new integration, you’ll be able to monitor your most popular videos, track video completion rates, see which channels are generating the most traffic, and more.
Also, you can use the Goals feature to track and visualize your progress toward specific response targets to ensure you’re staying on track. You can even automate Alerts so that you’re notified whenever important milestones are met.
At launch, there are 24 default Vimeo OTT metrics available. This means that there are 24 pre-built visualizations for some of the most popular metrics available in Vimeo OTT.
There are also 5 calculated metrics available, too. These are custom metrics that are commonly created by Vimeo OTT users that we’ve created using Data Calculations. These are also pre-built, meaning all you need to do is drag-and-drop them into your dashboard to visualize your performance. No code or design necessary.
Also, in addition to having the ability to quickly drag-and-drop your most important Vimeo OTT metrics into your dashboards, you can easily customize your dashboards to include data from other integrations that your business relies on, too.
For the purposes of getting started in tracking your Vimeo OTT data quickly, let me show you how to easily get started with a pre-built Vimeo OTT dashboard template.
Getting started with a Vimeo OTT template
Want a quick way to visualize your video performance with Vimeo OTT?
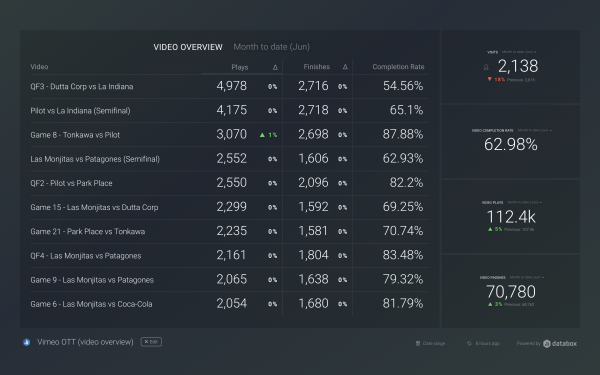
First, download this Vimeo OTT Video Overview template.
Next, you’ll be prompted to connect your Vimeo OTT account.
Then, voila! Watch as your dashboard automatically populates with all of your video performance KPIs.
In addition to the Video Overview Template, we also have 2 other pre-built templates ready to plug-and-play with your Vimeo OTT data:
- The Account Overview template: This template will provide you better insights into your account visits, video views and finances. Allowing you an overview of your entire Vimeo OTT account.
- The Traffic Overview template: This template will enable you to track and manage your Vimeo OTT account’s traffic in detail. It slices your traffic in different ways to help you determine all the filters that lead to quality visits.
How to create custom dashboards with Vimeo OTT
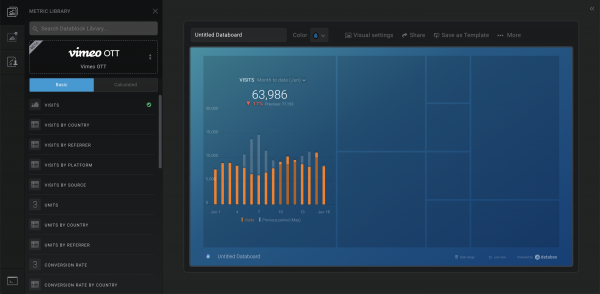
In the dashboard designer, search for the Vimeo OTT integration on the left side menu.
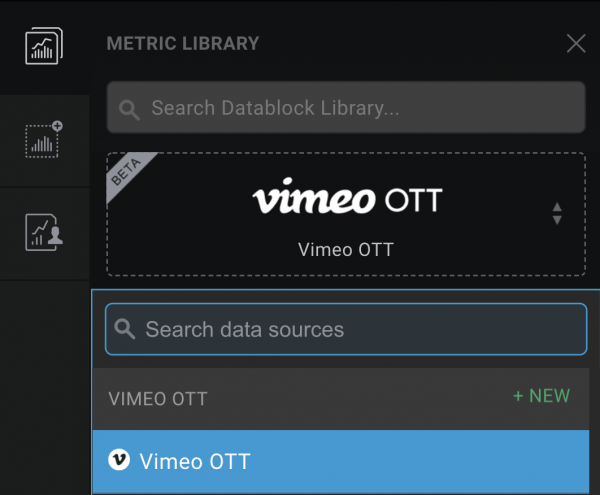
From there you’ll be prompted to connect your Vimeo OTT account (if you haven’t already).
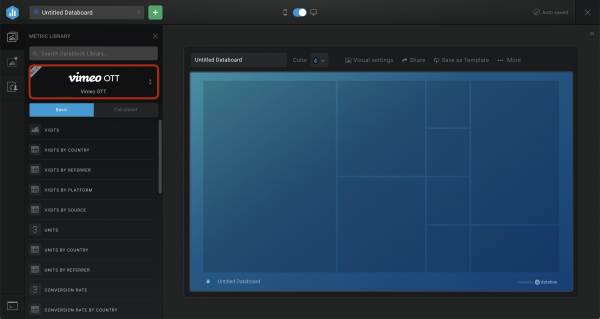
Now, you’ll see a menu consisting of 24 default Vimeo OTT metrics, as well as 5 calculated metrics (these are custom metrics commonly used by Vimeo OTT users that were created using Data Calculations) available to drag-and-drop directly into your dashboard.
Drag and drop the desired metric anywhere you’d like in your dashboard. You can resize these Datablocks or even rearrange them once you’ve added more.
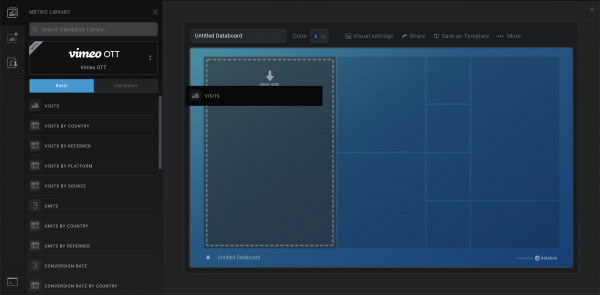
Then, your Vimeo OTT data will automatically populate.
Now, if you’d like to add KPIs from other tools into this dashboard in order to create a comprehensive view of performance across your team, simply click back into the left side menu to search for the desired integrations you’d like to pull from.
Getting started with Vimeo OTT + Databox
Existing users can view all of the available Vimeo OTT metrics here or download the Video Overview template here.
New to Databox? You can create a free-forever account here.


