Table of contents
Data Snacks is a new video series from Databox that shares bite-sized tips to help you be more data-driven.
Last month we increased referral traffic from LinkedIn by 281%.
We didn’t spend money on advertising.
We only posted eight times on our company page.
We posted far less than we did on Facebook or Twitter, and yet traffic from LinkedIn grew at more than double the rate of Facebook, while also outpacing Twitter’s traffic growth by 35%.
We’ve been trying a lot of different things on LinkedIn over the last couple of months. It’s become a more interesting place to engage our customers. It’s not as transient as Twitter, it’s not pay-to-play like Facebook, and the addition of video sharing (and other sweeping UI changes) has quietly turned it into a formidable alternative to other channels.
In the latest episode of Data Snacks, I’m sharing what we’ve learned after experimenting with several different tactics over the last few months, what’s worked, and how we’re tracking it.
Want the free template featured in this episode? Get it here.
LinkedIn’s algorithm change
In 2017, LinkedIn made significant changes to its algorithm wherein it now relies on machine learning to determine the quality of your posts before it even shows them to your network.
And while the specifics around the criteria of LinkedIn’s algorithm remain unknown, here’s how it generally works.
The initial filter
Through LinkedIn’s automation system, anything you post will be instantly classified under one of the following three buckets:
- Spam
- Low-quality
- Clear
You obviously want to fall into that third bucket.
As mentioned earlier, while the specifics around how LinkedIn categorizes “spam” or “low-quality” is unknown, a general rule I follow is to avoid overly-promotional language like “free”, “discount”, “offer”, etc. This is typically good practice and similar to the way ESPs flag certain words in your subject line which increases your spam score.
Pro Tip: Your Go-To Dashboard For Doing a Deeper Dive on Website Traffic and Conversion Sources
Struggling to find an easy yet effective way to gain a comprehensive understanding of your traffic sources, user behavior, and revenue generation?
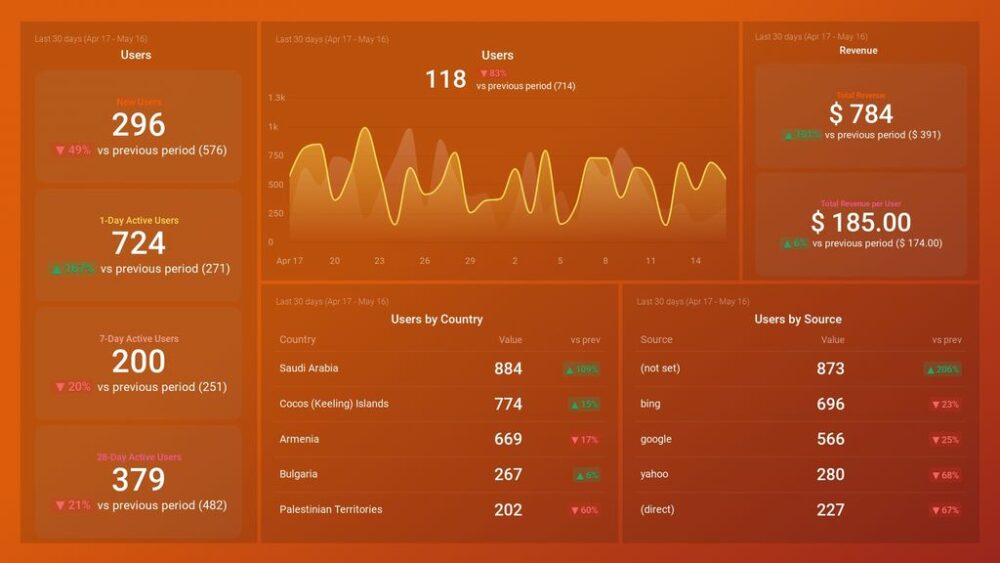
You can do all that and more with our plug-and-play GA4 Acquisition dashboard template:
- Understand user acquisition: See where users come from, tailor outreach, and track new user growth;
- Focus on high-performing channels: Identify top channels, optimize resource allocation, and adjust underperformers;
- Track revenue & engagement: Monitor revenue growth, active users, and the effectiveness of your campaigns;
- Go beyond traffic & conversions: Gain deeper insights into demographics, sales, customer journeys, ARPU, and more;
- Optimize marketing & drive results: Make data-driven decisions to improve your marketing strategy and achieve business goals.
You can easily set it up in just a few clicks – no coding required.
To set up the dashboard, follow these 3 simple steps:
Step 1: Get the template
Step 2: Connect your Google Analytics 4 accounts with Databox.
Step 3: Watch your dashboard populate in seconds.
The audience test
Next, your post is then shown to a small segment of your audience in order to gauge engagement quality before determining whether or not to show your post to a larger subset of your network and beyond.
(This is why you might notice it takes a bit for your posts to pick up steam.)
The scoring system
During the audience testing phase, specific engagements (likes, comments, shares) are scored in order to determine whether or not to:
- Demote your post because it’s low-quality
- Show your post to even more people because it’s high-quality
At this stage, automation yields to human intervention.
The assessment
When your post starts picking up traction through natural engagement, it’s passed along to actual humans who work at LinkedIn in order to further assess your post and whether or not it should be shown to more people.
Depending on the level of engagement your post is seeing, this assessment could even result in your post being shared with users that are outside your network, either through “trending content” or through the natural flow of the newsfeed.
What it all means
It sounds trite, but natural conversation wins the day.
While shares are great, LinkedIn’s algorithm values a long thread of engagement on your posts. It’s not enough to seed a bunch of likes from your coworkers anymore. If you want your content to be exposed to more people, you need to inspire conversation on your posts.
Treat every post as a conversation-starter. Ask questions. Solicit feedback on your content. Tag people that had a hand in the success of the post, like contributors, customers, vendors, etc. Respond to everyone that leaves a comment.
If anything, this should inspire your content strategy to include more collaboration with your customers, vendors, industry friends, coworkers, or whoever else could play a hand in improving the scope and balance of your content.


![Here’s How We Increased LinkedIn Traffic by Almost 300% in One Month [Data Snacks] Here’s How We Increased LinkedIn Traffic by Almost 300% in One Month [Data Snacks]](https://cdnwebsite.databox.com/wp-content/uploads/2018/02/08165433/linkedinengagementbg.jpg)


