Table of contents
Google Analytics (GA) helps measure the website data you need to inform a digital marketing strategy that helps you meet your business goals. But when you track and act upon data without proper scrutiny, you risk informing the wrong decisions. A Google Analytics audit will help make sure you collect and report on the right data.
In this article, we explore:
- What is a Google Analytics Audit and Why Is It Important?
- How Often Should You Perform an Audit of Your Google Analytics Account?
- 12 Best Practices for Performing Google Analytics Audits
Let’s dig in!
What is a Google Analytics Audit and Why Is It Important?
A Google Analytics audit is a thorough assessment of the current configuration of a Google Analytics account done in order to find either a problem to solve or opportunities to improve the quality, relevance, and accuracy of the insights gathered. The aim of a Google Analytics audit is to help you get purified data that tells you what you need to know in order to improve your business.
Data from a misconfigured Google Analytics account may contain internal traffic, spam sessions, and even inflated data from pages with duplicate tracking codes.
Needless to say, this kind of data is flawed and untrustworthy.
And just imagine hiring a conversion optimization expert based on inflated data to help raise conversion rates for a landing page that in fact, converts within range for its real traffic numbers.
In order to make good business decisions, it is critical to have precise, reliable, and actionable data.
How Often Should You Perform an Audit of Your Google Analytics Account?
According to results from our survey, you should perform an audit of your Google Analytics account once a month. 42% of the people we surveyed said that they conduct a Google Analytics audit.
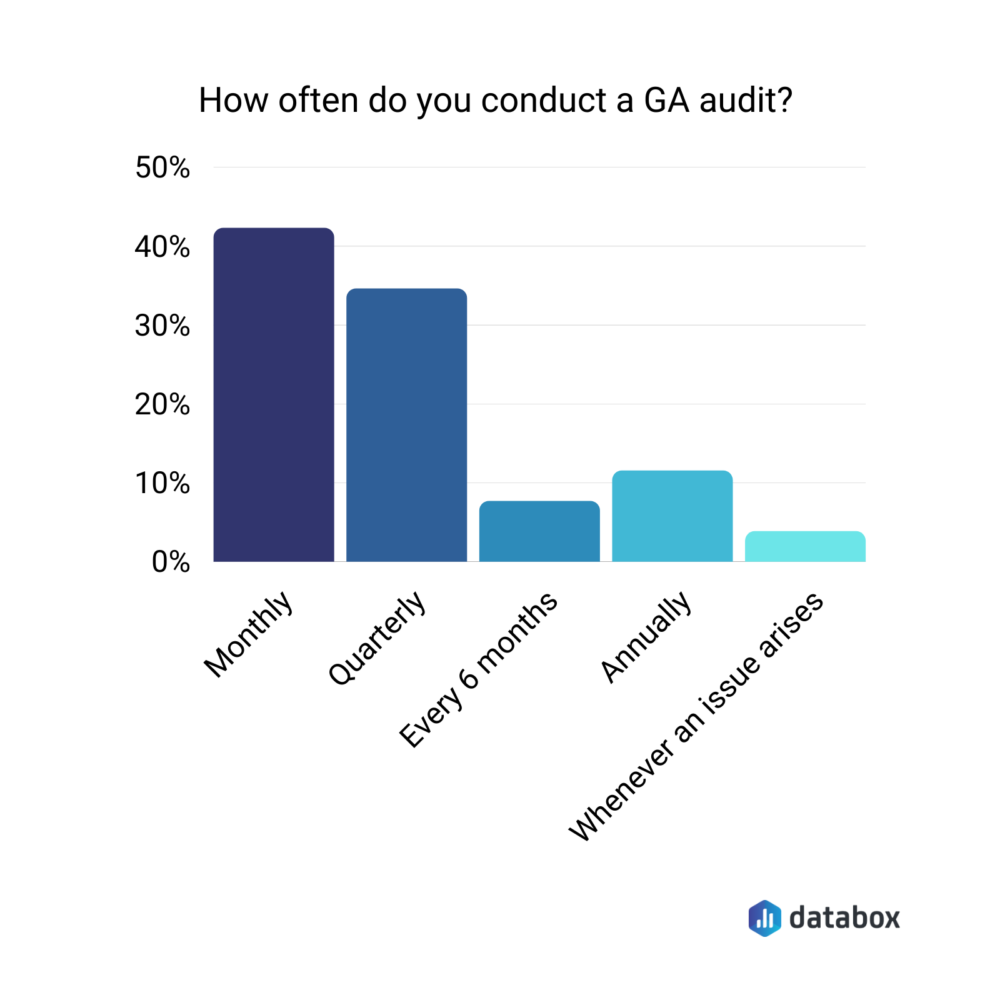
But not everyone is in favor of a once per month cadence. Alex Birkett of Conversion.ai recommends that you “audit your data once per quarter on a formal basis, and you’ll clean up the major issues that affect decision making.”
Just like Birkett, 33% of people who participated in our survey admitted to performing a GA audit quarterly. That’s easy to understand if you consider that it takes up to eight hours for most people to complete an audit.
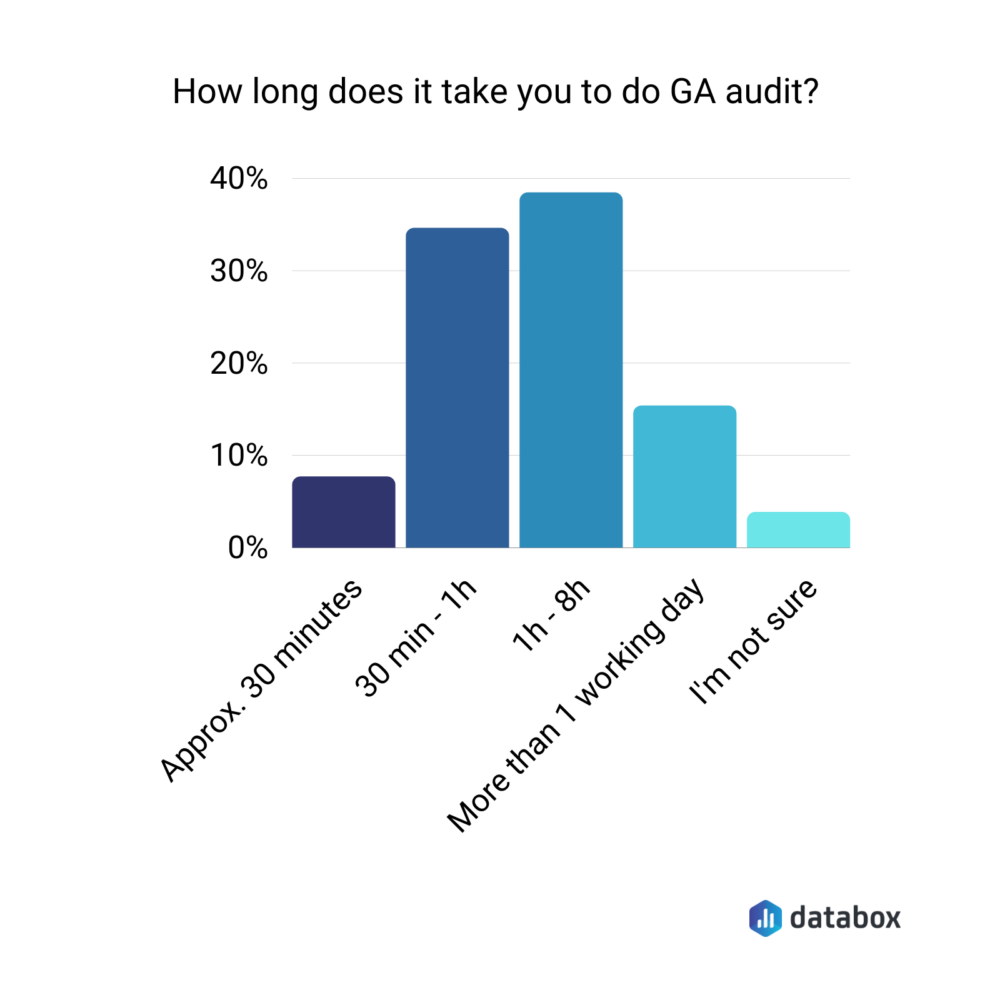
But there are also no strict rules as to how often you should perform a Google Analytics audit. Instead of putting off audits infinitely because you can’t form a regular cadence, experiment and stick with what works for you.
In our survey, we found that some people like to have a regular audit schedule, while others prefer performing ad-hoc audits. About 10% of people said they do an audit whenever an issue arises.
That said, some scenarios that definitely call for a Google Analytics audit include:
- When you launch a new website
- After making significant changes to your website
- After CMS and plugin updates
- Whenever the website or business goals change
Best Practices for Doing a DIY Google Analytics Audit
If you want to do Google Analytics audits that help your end goal, thorough is the word. Consider every factor, every metric, every piece of data in your report. “Don’t look at one data set in isolation,” Daniella Pozzolungo of PupDigital advises. “You need to look at the bigger picture to understand the true implication of that metric.”
Unfortunately, it’s not always easy to be thorough with an audit. Less than half of the marketers in our survey say they perform a full analytics audit that includes at least health checks, data integrity, and data accuracy checks.
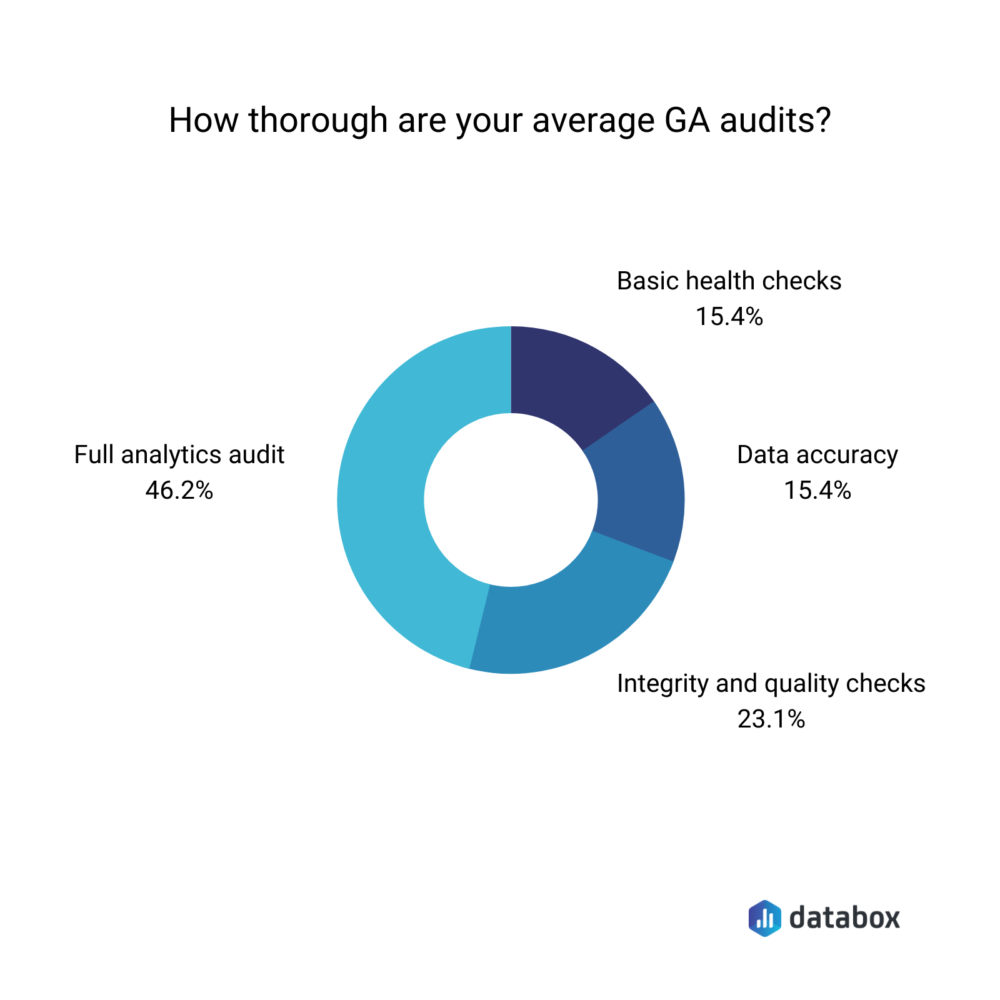
For marketers who aren’t doing full audits yet, a checklist may be the thing you are missing. Natasha Rei of Explainerd explains “When performing a GA audit, it’s wise to create a checklist where you can get back at a time. With so much data you need to monitor, it can be exhausting to complete the list without knowing your goal,” Rei says. “You may as well get lost in analyzing your problems without having a chance to troubleshoot them… the checklist will help you point out which data is missing from your list.”
Want to create a Google Analytics audit checklist that reduces the overwhelm and makes sure you have all bases covered? We asked 20 marketers to share the most important things to do in a GA audit and here’s what we learned:

Now let’s dig into the tips:
- Check your tracking code implementation
- Enable Demographics and Interest Reports
- Create three basic data views
- Use Google Chrome extensions and plugins
- Filter internal and bot traffic
- Enable site search and category search
- Review and exclude URL query parameters
- Integrate and exclude AdWords account
- Set goals and goal tracking
- Configure Acquisition Reports
- Configure Behavior Reports
- Configure Conversions Reports
PRO TIP: How Are Users Engaging on My Site? Which Content Drives the Most Online Activity?
If you want to discover how visitors engage with your website, and which content drives the most engagement and conversions, there are several on-page events and metrics you can track from Google Analytics 4 that will get you started:
- Sessions by channel. Which channels are driving the most traffic to your website?
- Average session duration. How long do visitors spend on your website on average?
- Pageviews and pageviews by page. Which pages on your website are viewed the most?
- Total number of users. How many users engaged with your website?
- Engagement rate. Which percentage of your website visitors have interacted with a piece of content and spent a significant amount of time on the site?
- Sessions conversion rate. How many of your website visitors have completed the desired or expected action(s) and what percentage of them completed the goals you’ve set in Google Analytics 4?
And more…
Now you can benefit from the experience of our Google Analytics 4 experts, who have put together a plug-and-play Databox template showing the most important KPIs for monitoring visitor engagement on your website. It’s simple to implement and start using as a standalone dashboard or in marketing reports!
You can easily set it up in just a few clicks – no coding required.
To set up the dashboard, follow these 3 simple steps:
Step 1: Get the template
Step 2: Connect your Google Analytics account with Databox.
Step 3: Watch your dashboard populate in seconds.
1. Check the tracking code implementation
To track traffic, Google Analytics requires a tracking code on each page. It is important to install this code correctly. If it isn’t or if some pages are missing, you will not be able to see the full journey of a user on your site. Therefore, always start with a check for properly implemented tracking codes.
We Invoice’s Eden Cheng says, “The best way to begin a DIY GA Audit is to check if the tracking code implementation is done correctly. Make sure that all needed properties are being tracked. Change the property name as per your campaign and set the right default URL.”
While there are different ways to check your tracking code implementation, Hannah Wiginton of Hannah Winginton Consulting prefers to employ the help of Google Chrome extensions. “First, use Google Tag Assistant to verify you have the correct tracking codes on your website and you don’t have multiple codes accidentally,” Wiginton says.
The process is simple.
Download Google’s Tag Assistant. It’s an extension developed by Google that lets you check if your Google Analytics is collecting your site’s data. Once the extension is installed, enable it manually and refresh your website.
Run the program. After the run, it will give you one of three icons: a Blue icon, a Green icon, or a Yellow icon. If you get a Blue or Green icon, it means that your data is being collected. With a Yellow icon, it means that some information is missing.
If you get a Yellow icon, click on it and read the Where to Optimize section, and you’ll find out exactly what is wrong. When it says No tags found, this means that your code isn’t tracking at all. To fix this, add the missing tracking code to your site and run Google Tag Assistant again until you see the Blue or Green icon.
Sometimes, you might have multiple tracking codes on a page. You need to look out for that as it could mean that you’re gathering more data than you need. Make sure there’s only tracking code installed, and delete the other ones.
You should also ensure that your tracking code is present on all 404 pages and server 500 pages.
2. Enable Demographics and Interest Reports
“If you are doing a business that requires traffic from particular regions or that is affected by the location or other details of your visitors, make sure to enable Demographics and Interest Reports too,” Wiginton adds.
Alina Clark of Cocodoc believes that “an audit shouldn’t start with your own interpretations. Instead, it should start with introspection into user needs which are based on how users interact with the site. Understanding what the users need, and how that translates to the Google Analytics Data is a crucial facet of any audit.”
Clark continues, “The website users have no relationship with your data. They sometimes don’t even know what they want. As such, one first has to understand the user intent, before setting any new parameters for the data.
If anything, having a firm grip of user intent gives you better insights into the end data, and a better path to creating valuable objectives for your audit.”
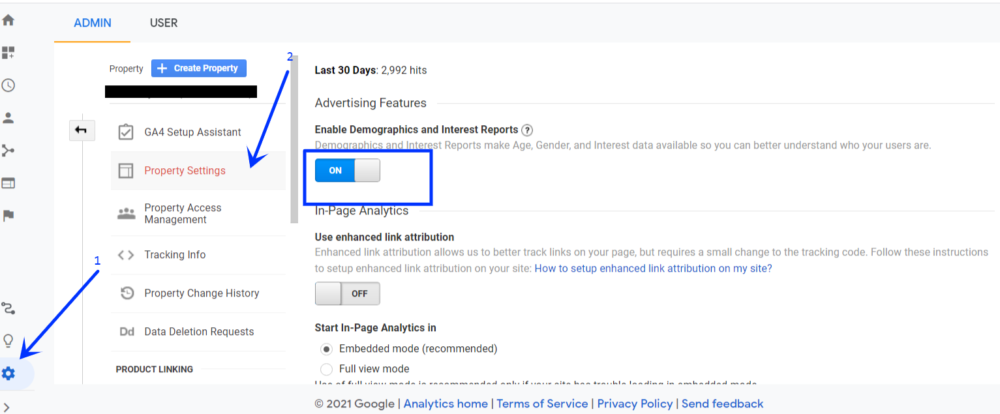
To access this data, manually enable Demographic and Interest Reports. Demographic and interest reports provide additional data about the age, gender, and interests of your audience. While you can’t gather this data on all visitors, it can help you better understand who engages with your content.
Here’s how you can do this:
Sign into Google Analytics and select Admin.
Choose the account and property for which you want to enable Demographic and Interest Reports. Under Property, click Property Settings. Scroll down to find Advertising Features, and the Enable Demographics and Interest Reports under it. Select ON.
3. Create three data views
Eden Cheng of We Invoice adds another tip: “Make sure to have 3 views in your Google Analytics Account, i.e. test, raw data, and master view.”
Raw data view is the untouched view that carries all your data. In this view, you will not make any modifications. No exclusions, no filters, no nothing. There will be no settings that can alter the data collected in this view. To get your Raw data view, you can just rename Google Analytics’ default page All Website Data to Raw.
Andre Oentoro of Milkwhale says you should “always have a “Test” view and a “Raw” view created to avoid making the mistake of changing your site permanently. If you have doubts about the filters or views, you can always refer to your “Raw” view which is your original settings.”
The Test view is very crucial and serves as an environment to test and try new things out. Whatever changes you have planned, try them out in your Test view. If you need a new filter, try it out in your Test view first. Once you’re sure that the filter is correct and will improve the quality of data you collect, only then can you implement it safely on your Master view (the main view).
Your Master view is your working view. It is in this view that you apply the filters and other custom configurations/settings that you tried out in the Test view. Your Master view gathers the most accurate data, use that to gain insights and analyze traffic.
Since you will change the settings and configurations of the Test and Master views, you might, at some point, get confused about these views. When this happens, you can always refer to the Raw data view as Oentoro pointed out.
Related: 17 Common Google Analytics Tracking Mistakes (and How to Avoid Them)
4. Filter out internal and bot traffic
Did you know that every time you visit your website, Google Analytics tracks it by default? This can greatly inflate traffic and the number of sessions, which is not good for data. In fact, a page that is reported as really popular might actually be the one you visit most.
Another thing that can inflate traffic is bots.
Bots can drive traffic up and cause you to make decisions based on distorted data. They also inflate the Bounce Rate and send imprecise data that can mess your stats up real bad.
To get the most accurate data, you want to measure the visitors that are relevant. You don’t want to measure all the times your employees and teammates are visiting the site. That’s why you should set up filters–for bots, necessary IP addresses, and referrals.
“Be sure to look at any unusual spikes in traffic, especially those that happen on one certain day,” says Brooke Logan of Sagefrog Marketing Group. “In 2021, bot traffic has been popping up in Google Analytics in different channels and it’s important to keep on top of this to include in reporting and to create filters to potentially stop that bot from hitting again in the future!”
Steve Lys of Simple Machines Marketing believes that people should “always make sure bots and spam IP addresses are filtered out of your data. That unnecessary clutter could cause you to change your marketing tactics based on inaccurate information.”
And so does Hannah Wiginton of Hannah Wiginton Consulting. Wiginton says that “it is good to create an exclusion list that filters out referrals and other such sources of traffic being generated. Exclude your IP too. This way you will be able to track fair data.”
Lys and Wiginton are right: Filtering out spam IP addresses and internal/external IP addresses you don’t want to track is very important to avoid self-generated traffic.
Here’s how you can do that.
Login to Google Analytics. Go to Admin > View > View Settings.
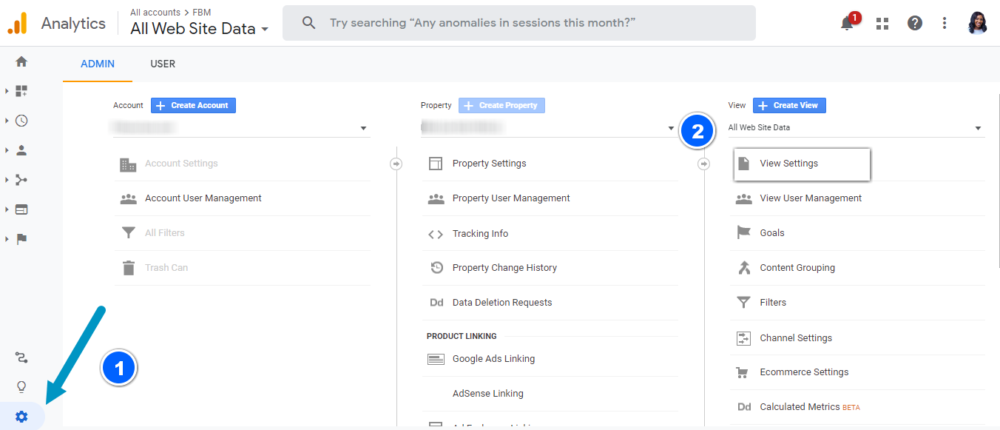
Turn on Bot Filtering, which will filter out the bots and spiders from Reporting.

The steps for filtering internal traffic are similar too. Under View Settings toward the left, click on Filters. Select Add Filter and give your filter a name. Scroll to Filter Type and follow this sequence: Pre-defined > Exclude > traffic from the IP addresses > that are equal to
Find your IP address, enter it into the bar, and hit the Save button.
Repeat steps 4 – 7 for any other IP addresses you don’t want to track, such as your team members, marketing agency, sales team, or Virtual Assistants, from other locations. If you have enabled any IP-blocking filters, make sure they are up-to-date.
5. Use Google Chrome extensions and plugins
Phil Wiseman of Analytics That Profit believes that the Google Chrome extension is a very important part of a google analytics audit. Wiseman says, “
One of the benefits of the extension is that you don’t have to have access to the Google Analytics account to see if analytics is installed correctly.
Beyond the Google Chrome extension, you should also download and use Chrome plugins like Chrome Tag Assistant and Google Analytics Debugger to make your work easier.
“Chrome Tag Assistant is one of the most popular plugins to help in a Google Analytics audit. The plugin quickly spots common issues with Google Analytics code configuration and setup. Using this plugin, you can also check if the changes in the code instantly fires the code as intended,” Jordan Brannon of Coalition Technologies says. “The other plugin which we recommend is Google Analytics Debugger. It also helps to check and debug the code, and at the same time it gives you the detailed breakdown of each tracking beacon.”
6. Enable site search and category search
Site search and category search can provide key insights into how users behave on your website, and help you qualify your leads better. It can also help you identify the content your users are searching for but cannot find. If you have a search bar on your site, you should enable site search and category search.
To get this function to work, you have to instruct Google analytics on what query parameters it should look for.
Here’s how to do this:
Login to your Google Analytics account. Go to Admin > View > View Settings. Scroll down and set Site Search Tracking to ON.

Input the query parameter for a site search. Right below that, set Site Search Categories to ON. Enter the category parameter for a category search. Click Save or Apply.
7. Review and exclude URL query parameters
Each time a query parameter is added to a URL, it is reported as a separate page in Google Analytics. This can result in thousands, if not millions, of pages being reported, making it more difficult to get accurate data. You have to decide which parameter changes the page enough to really matter. Any parameter that does not change the page enough should be excluded.
Similar to how you would filter for site search, login to your Google Analytics account. Go to Admin > View > View Settings. In the Exclude Query Parameters box, list all the terms you want to exclude.
Note that the box is limited to 250 characters but that should be enough. If you need to remove more parameters, you should use a filter instead.
8. Integrate and configure Adwords account
Linking your AdWords account to Google Analytics allows site performance and ad data to be reported directly inside the Google Analytics Adwords report. You can also import metrics and goals and tie them into the ecommerce reports (if you have an eCommerce store). This way, you will be able to use Google Ads multi-channel funnel reports and remarketing data.
Go to Admin > Property > Google Ads Linking. Click + New link group. Select the Google Ads group you want to connect and click Continue. Add a link group title. Set each view in the property to which you want to add Google Ad data to ON. Select Link accounts.
Related: 11 Tips for Creating a Custom Google Ads Dashboard to Track PPC Performance
9. Set goals and goal tracking
It is extremely difficult for a business to thrive without having clearly defined goals. The kind of goals you can set depends on the type of business and website you are running. Goal-setting cannot quite be explained in a general manner because you’re the only one who has the necessary knowledge about the needs of your businesses.
Although every business is different, it is compulsory that you set goals (tailored to your business) in Google Analytics. This will help you measure the most important data and metrics, and assess if you’re on the right track.

“When performing a Google Analytics audit yourself, my top tip is to learn about Goals and how to set them up in analytics,” says Jettproof’s Michelle Ebbin. “Using Goals is the best way to automate measuring your ROI, regardless of whether you’re monitoring sales conversion or leads captured.”
However, it is not enough to just set goals. You have to track them too. Nate Rodriguez of LIFTOFF Digital says this: “I’ve seen countless websites implement GA and then forget to set goal tracking. It’s a hugely underrated feature that doesn’t get enough attention.”
Goal tracking allows you to measure how often your site visitors complete a predefined action, such as downloading a lead incentive, submitting their contact information, or making a purchase. Rodriguez continues, “Don’t skip on setting up goal tracking within GA because, without it, you’ll never know if your traffic is converting – you’re essentially flying blind.”
Related: 24 Underrated Google Analytics Features You Should Use More Often
10. Configure Acquisition Reports
In your Acquisition Reports in Google Analytics, you can learn about where your visitors clicked from i.e. the sources of your site traffic. Google divides traffic and puts it into some categories (channels) which include: direct, organic search, email, social, paid search, display, referral, affiliates, other advertising, and other.
These traffic stats may be a little confusing to navigate but one thing you should definitely check is your (direct)/(none) traffic. Apart from the users that visited your website by typing the URL address directly or clicking on a bookmark, your (direct)/(none) traffic also consists of visits to your site made through links that Google has zero information about.
In your Google Analytics account and click Acquisition towards the left. On the drop-down menu, select All traffic. Then click on Source/Medium. Scroll down a bit and you will find your (direct)/(none) traffic in the table.
Check if your (direct)/(none) traffic is larger than 25%. If it is, this means that over one-fifth of your traffic comes from Neverland, and this is a situation that needs to be fixed. Triodox’s Ruslan Konygin says: “Make sure the percentage of the (direct)/(none) traffic in your reports doesn’t exceed 20-25%. Otherwise, check your traffic sources tracking (and attribution) thoroughly.”
While you cannot stop users from visiting your site directly or through a bookmark, you certainly can limit visits to your site through shadow links by correctly tagging the links that you (or your team) share with people.
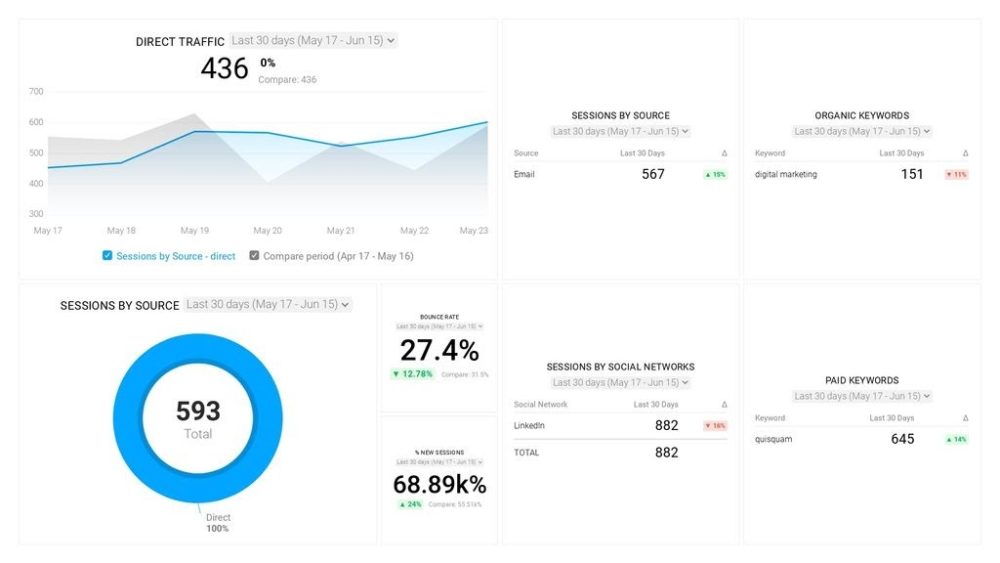
Editor’s Note: Do you want to easily monitor user behavior, identify your top-performing campaigns and keywords (paid and organic), and more? You can download this free Google Analytics Acquisition Snapshot Dashboard Template to dig deeper into your traffic sources.
11. Configure Behavior Reports
The Behavior Reports section of your GA account gathers data about how your site visitors behave on certain pages in your site. It is in this section that you can see the number of page views, the landing and exit pages, the time spent on each page, the bounce rate, and many other metrics.
Some of the most important things you should look out for in this section are your most valuable pages. “Prioritize your high-value articles, whether those are lead generating, key landing pages, or the like,” Katrina Dalao of Referral Rock explains. “It’s so easy get caught up in overall drops or rises in your numbers, and then devote resources where they might not make a big difference. But if you know what articles or pages are pulling the most weight for your company, those are the ones to keep your eye on.”
When you know the pages and articles that offer the most value to your businesses, you will have an idea of what kind of content to create and offer to your users.
Another metric you should focus on in this section is your bounce rate. An unusually low or high bounce rate is a reason to worry. To be clear, a bounce rate of exactly 100% means that all the visitors that landed on a particular page did not visit any other page on your site. They just viewed that page and left.
“Very low bounce rates are an easy indicator that there is an issue with your tracking setup,” Rebecca Bowden of HelloMetrics says. “One of the most common issues I uncover in a Google Analytics audit is that the GA tracking tag is added to the site multiple times. This is especially common on WordPress sites where you may have multiple plugins to manage scripts and header tags, or the tag is added directly to the website and via Google Tag Manager. This results in a very low bounce rate that is not accurate and skewing your data.”
Check if your top pages have a bounce rate lower than 5% or higher than 95%. In both cases, it is advisable to check the Tracking Code implementation on them. These numbers could mean that you have a very small number of non-interaction events set up for those pages (low bounce rate) or too many of them (high bounce rate).
Bowden continues, “If your bounce rate is low – less than 5%- use the Google Analytics Debugger Chrome extension to help verify if you have multiple instances of the GA tracking tag added to your site.”
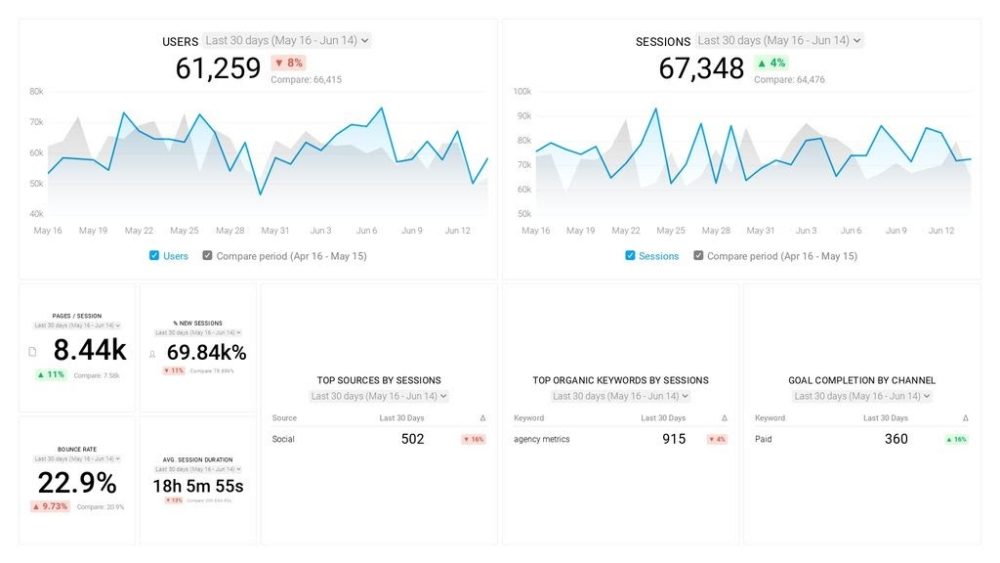
Editor’s Note: Want an easy way to track your most important website engagement metrics, including average time on page, bounce rate, average session duration, the number of unique visitors to your website and % returning visitors and goal conversion rate? Google Analytics users can download this free Google Analytics Website Engagement Dashboard Template to get started.
12. Configure Conversions Reports
In your Conversions Reports section, you can check how your site is performing based on the goals you have set. As mentioned earlier, goals are very important in GA and you should have them clearly defined.
In the Goal Overview area, you can check if your visitors are meeting your goals or not. This section will show you whether your goals are too specific or too general. If they are on the extreme sides of this scale, you can review them, tweak, remove or add some goals.
Your goals should be balanced so that you can easily analyze the condition of your business or site, as the case may be. Robert Huebert of HBT Digital Consulting shares this sentiment. “One tip to performing a Google Ads audit is to check conversions and tags. Make sure that they’re active and firing appropriately,” Huebert says.
If you have an ecommerce store, then you should compare your online transactions with the goals you have set in Google Analytics. These two do not have to align perfectly, but they have to correlate to a very sizable extent. 90 – 95% is a good range. If the number is markedly lower than that, you should triple-check your ecommerce implementation, transaction and other settings.
Xavier Harley-Rudd of Novos recommends enabling event-tracking to make sure that your goals are being met. Harley-Rudd says, “Working with eCommerce only clients, my one tip when performing a DIY GA audit would be to ensure that key events and goals are working as expected, as these can be easily broken when the website is updated. Without proper event tracking, we are unable to understand & adapt to our visitors’ engagement.”
In addition to event tracking, setting custom alerts can also help you keep a close eye on your data to avoid data loss and identify any problems that need troubleshooting.
“Set up custom alerts that detect big negative changes in your most important metrics. This will alert you of any significant changes before you would likely have detected them through a scheduled manual audit,” explains Perrill’s Nate Tower. “For example, a custom alert on revenue drops of 25% helped us almost immediately detect an issue with a client’s order confirmation page not loading correctly. Custom alerts shouldn’t replace regular audits, but they will make you better at catching issues earlier.”
Custom alerts can cover anything from a goal flatline to a marked increase in conversions and more.
Collect More Accurate Data
Perform Google Analytics audits frequently to collect accurate data. Then visualize your data in a Google Analytics reporting tool to help you make better decisions on where your team should put focus. In just a few clicks, build comprehensive reports that prove ROI and turn numbers into a narrative.
Not sure if your Google Analytics account is set up correctly in the first place? Let our Google Analytics experts do a free audit and help you build dashboards from your Google Analytics data that will help you analyze any data irregularities, website engagement, and more. Getting started is simple — just send us an email or a chat message.




![How to Leverage Your Website Analytics to Acquire New Customers? [Research Findings Based on 100+ Companies]](https://cdnwebsite.databox.com/wp-content/uploads/2022/10/10044001/google-analytics-4-metrics-and-dimensions-guide-1000x563.png)

![High Shopping Cart Abandonment Rate: Causes and Potential Solutions [Insights from 65+ Experts]](https://cdnwebsite.databox.com/wp-content/uploads/2022/01/17041843/ecommerce-challenges-1000x563.jpg)


