Table of contents
So your Facebook ad costs are shooting for the stars and you just can’t rest well until you bring those costs down, isn’t it?
We can help you with that. But, first, ask yourself: is your ad spend really high compared to the revenue generated from each campaign you run?
To answer that for yourself, you need to start tracking your Facebook advertising costs.
There are certain Facebook metrics that can tell you exactly how much you’re spending for each conversion, whether your return on the ad spend is enough, and how much you are paying to get your audience to click, among other things.
So a good place to start to reduce Facebook ad costs is by tracking the same five Facebook ad metrics that our expert contributors track. In addition to these metrics, we also show you how to set up and track your Facebook ROAS to effectively track the performance of your ad campaigns.
- How Often Should You Check Facebook Ads Costs?
- 5 Facebook Cost Metrics for Keeping Advertising Costs Low
- How to Visualize Your ROAS from Facebook Ads in Databox
How Often Should You Check Facebook Ads Costs?
Before we dive into the details, you might be wondering how often you should monitor your Facebook ad costs to optimize your ad spend.
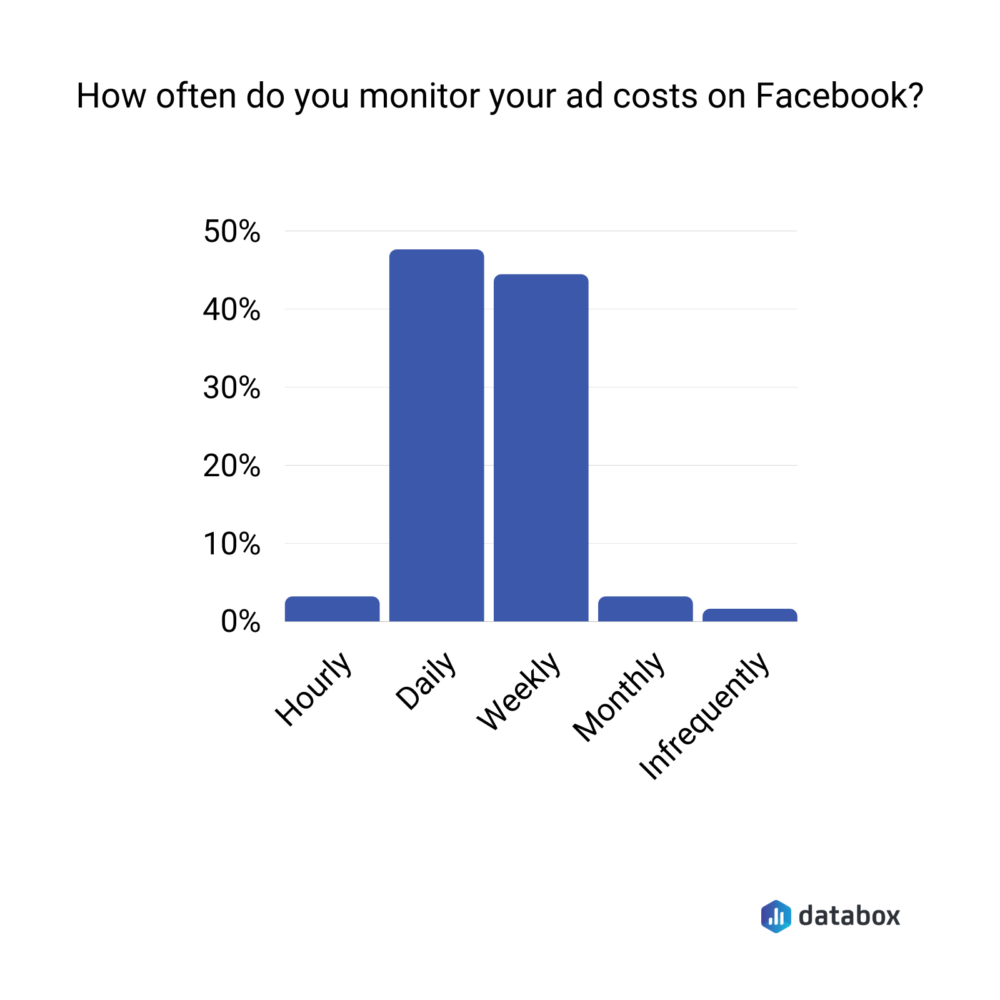
According to our research, the answer is either daily or weekly since almost 50% of the marketers we surveyed monitor ad costs daily and approximately 45% track them weekly. Less than 5% make this a monthly affair.

Related: How Much Do Facebook Ads Really Cost? (And 8 Ways to Maximize Ad Spend)
5 Facebook Cost Metrics for Keeping Advertising Costs Low
Now, for the exact metrics that you should monitor:
- Cost Per Result (CPR)
- Return on Ad Spend (ROAS)
- The Cost per Purchase/Acquisition (CPA)
- Click-through rate (CTR)
- Bid/Cost Cap
PRO TIP: What’s the overall engagement of your ad campaigns?
Want to make sure your Meta ads are performing and trending in the right direction across platforms? There are several types of metrics you should track, from costs to campaign engagement to ad-level engagement, and so on.
Here are a few we’d recommend focusing on.
- Cost per click (CPC): How much are you paying for each click from your ad campaign? CPC is one of the most commonly tracked metrics, and for good reason, as if this is high, it’s more likely your overall return on investment will be lower.
- Cost per thousand impressions (CPM): If your ad impressions are low, it’s a good bet everything else (CPC, overall costs, etc.) will be higher. Also, if your impressions are low, your targeting could be too narrow. Either way, it’s important to track and make adjustments when needed.
- Ad frequency: How often are people seeing your ads in their news feed? Again, this could signal larger issues with targeting, competition, ad quality, and more. So keep a close eye on it.
- Impressions: A high number of impressions indicates that your ad is well optimized for the platform and your audience.
- Amount spent: Tracking the estimated amount of money you’ve spent on your campaigns, ad set or individual ad will show you if you staying within your budget and which campaigns are the most cost-effective.
Tracking these metrics in Facebook Ads Manager can be overwhelming since the tool is not easy to navigate and the visualizations are quite limiting. It’s also a bit time-consuming to combine all the metrics you need in one view.
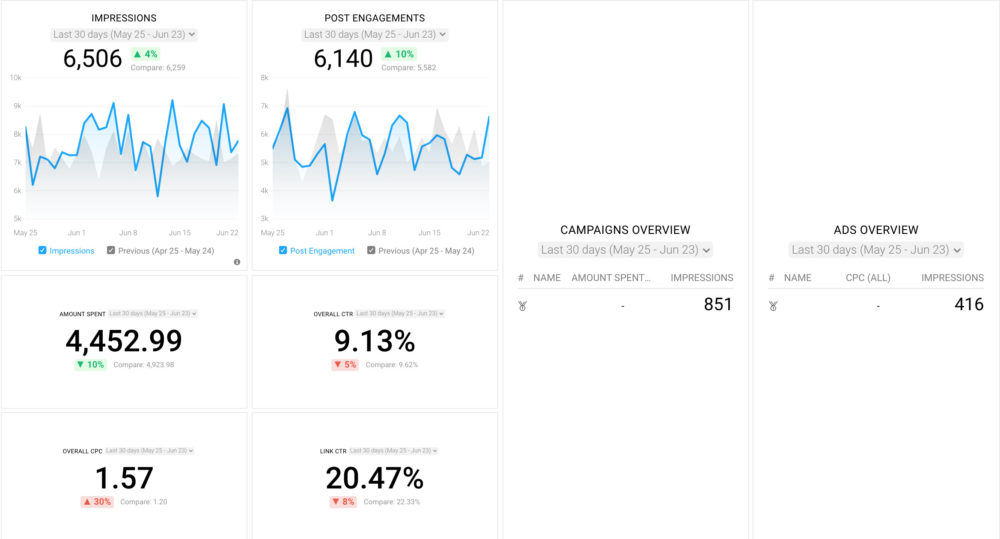
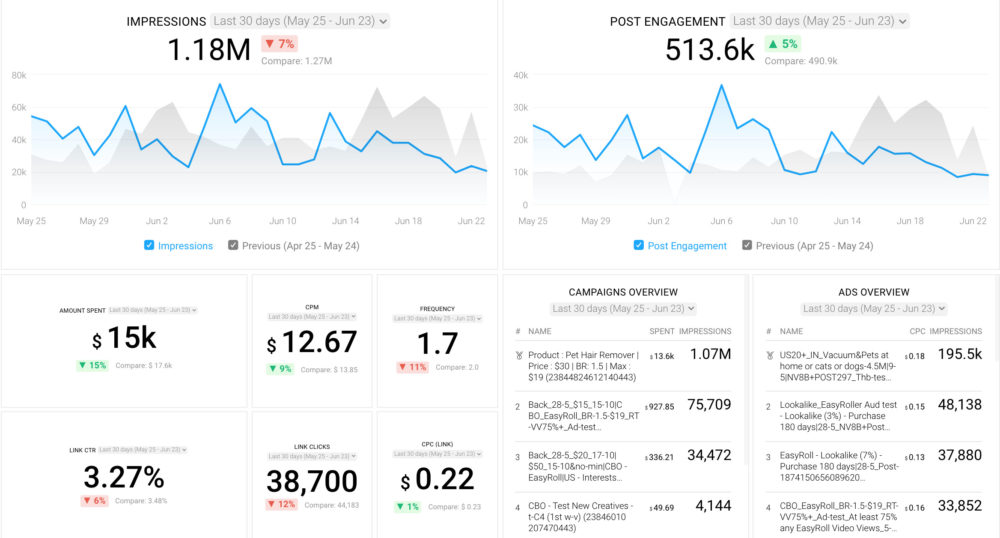
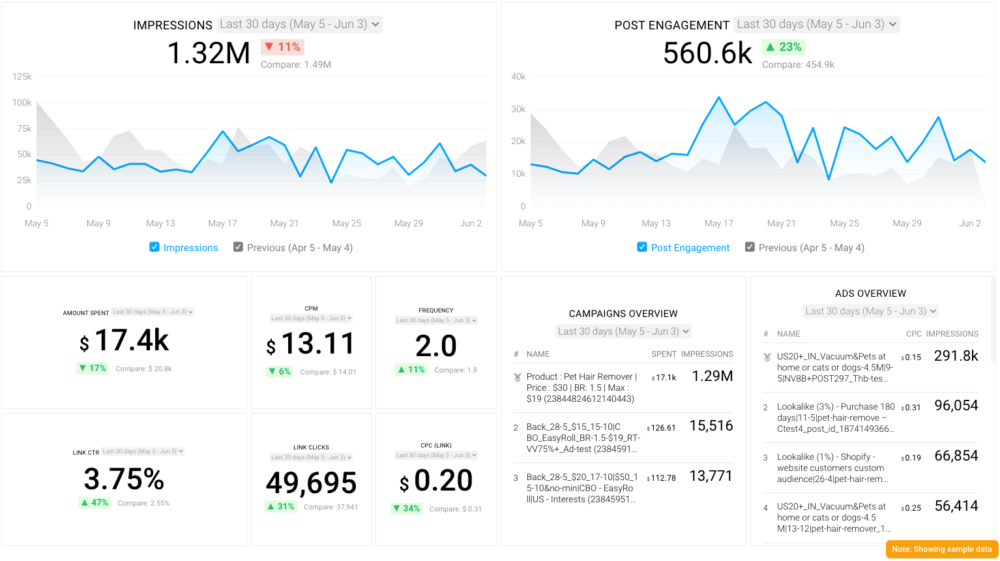
We’ve made this easier by building a plug-and-play Facebook Ads dashboard that takes your data and automatically visualizes the right metrics to give you an in-depth analysis of your ad performance.
With this Facebook Ads dashboard, you can quickly discover your most popular ads and see which campaigns have the highest ROI, including details such as:
- What are your highest performance Facebook Ad campaigns? (impressions by campaign)
- How many clicks do your ads receive? (click-through rate)
- Are your ad campaigns under or over budget? (cost per thousand impressions)
- What are your most cost-efficient ad campaigns? (amount spent by campaign)
- How often are people seeing your ads in their news feed? (ad frequency)
And more…
You can easily set it up in just a few clicks – no coding required.
To set up the dashboard, follow these 3 simple steps:
Step 1: Get the template
Step 2: Connect your Facebook Ads account with Databox.
Step 3: Watch your dashboard populate in seconds.
1. Cost Per Result (CPR)
This Facebook cost metric is pretty self-explanatory – it’s the amount it takes to drive each result.
“This is the total amount you spent divided by the number of results,” explains Cloom’s Abby Drow.
“Of course, the lower, the better,” Drow notes.
Vincent Bradley from Proper Wild also points out, “Keeping CPR low means I can keep my Customer Acquisition Cost (CAC) low, which is why it’s so important. Usually, these spikes happen because the audience changes, the ad itself becomes less timely, or our ad was being seen too many times by the same people.”
And what if your CPR is on the rise? Drow has the answer for you: “Once you see this metric rising, you have to optimize your settings.” Here are some suggestions:
- “You can either check your ad placements and just choose the one that generates the most
- Or you can look at scheduling your ads at certain times to maximize exposure.
- You can even accelerate it at peak hours but always make sure you’re monitoring your spending so you can stop it at certain levels.”
In short, “you can always use your cost per result as a barometer to know when to start tweaking your ads,” in Drow’s words.
Editor’s note: Get a complete overview of your Facebook ad campaign’s performance with this Facebook Ads Campaign Review dashboard template. You can study all the essential metrics like click rates, impressions, CPC, and other campaign-specific metrics on one dashboard.

2. Return on Ad Spend (ROAS)
ROAS is an indicator of how much you are making from Facebook ads in comparison with the budget you’ve allocated to it.
Since it shows the ‘return,’ it’s one of the best Facebook advertising cost metrics to track for determining if you need to reduce the costs of your ad campaign. And it’s no wonder that 60% of agencies set goals around ROAS according to our recent Facebook ads research.
In fact, Joe Whiteside from Honey & Roses Coffee thinks this metric is a “key” to track.
“Keeping ad cost low should not necessarily be the goal,” Whiteside recommends. “If an ad is generating sufficient return to pay for itself, then it does not matter if it costs $10 or $1000.
Instead, you should be focusing on how much return you are getting on the money you do spend and ‘trimming the fat’ where it is a cost that is not providing returns.”
Related: 18 Ways to Optimize Your Facebook Return on Ad Spend (ROAS)
3. The Cost per Purchase/Acquisition
Another closely related metric that you should be watching to cut back on your Facebook ad spend is the cost per purchase. It also goes by the name of cost per acquisition (CPA) or cost per conversion.
“After deducting your ad spend budget, cost per purchase is a simple approach to determine if you’re selling individual goods at a profit or a loss,” points out CocoFax’s Olivia Tan. “It informs you how much money you’ll have to spend on advertising to sell a single unit of merchandise. It may also be used to quickly compute individual item profit margins.”
Daphne Tse from seoplus+ agrees, “CPA is one of the most valuable cost metrics to track to maintain low costs on Facebook Ads and achieve a successful ROI.”
Tse also thinks it’s valuable as it indicates conversion. “For some advertisers, the CPA represents the amount spent on generating a website purchase. For others, the CPA reflects the cost of achieving a qualified lead that has now entered the B2B sales funnel.
Regardless of the specific ‘conversion’ metric, monitoring your Facebook Ads CPA closely and optimizing your campaign to drive down the CPA will allow you to achieve more conversions at a lower cost.”
Here’s how the calculation works according to Tan:
- Positive profit margin
“Your advertising expenditures are earning more income than the amount spent on advertising when your profit margin is positive (higher than 0). In other words, you’re making money.”
- Negative profit margin
“When your profit margin is negative (less than zero), you’re spending more money on advertising than you’re making. You’re losing money, to put it another way.”
To wrap it up, Tse shares a tip to maintain a low CPA: “focus on ad relevance. By structuring a campaign with relevant ads serving a defined audience within a specific area of the marketing/sales funnel, the more your ad will resonate with users, resulting in more conversion activity.”
Editor’s note: Take also into consideration 10 tips on how to reduce Facebook Ad CPM and save your campaign money.
4. Click-through rate (CTR)
“The Click-through rate (CTR) is a very crucial cost to calculate,” opines InVideo’s Sanket Shah.
Essentially, “Facebook CTR is the percentage of time a number of people who saw your ad and clicked on it. You can calculate CTR by taking total number of clicks and divide it by total number of impression on your ad,” Shah explains.
The metric helps you by telling “you are targeting the right audience or not, is your campaign or offer compelling enough, and how well your creative is performing.”
It’s also one of the most important metrics for measuring Facebook advertising cost the “the less clicks you get on your ad, the more expensive it gets,” highlights Mike Kolb from Xwerks.
To this end, the Xwerks team is “always adjusting our ads in order to maximize clicks, whether it by targeting a more specific audience or location,” says Kolb. “The bigger the area you are targeting (geographically speaking), the more you have to spend on your ad in order to get the visibility and clicks you need.”
Editor’s note: Get your eyes on how engaging your Facebook ad campaign is with this free Facebook Ads Campaign Performance Dashboard Template. You can monitor ad CTR, link clicks, impressions by ads as well as campaigns, and a lot more here.

5. Bid/Cost Cap
“It allows you to understand the cost that will be incurred when setting up ads,” DiscountReactor’s Andrew Priobrazhenskiy outlines.
“One of the significant advantages of using this metric is that you can employ huge campaign budgets with a more restrictive expenditure approach using cost controls (bid caps).”
It’s for this reason that “cost capping improves cost efficiency by ensuring that you obtain the most results, such as purchases or installs, for the least amount of money,” elaborates Priobrazhenskiy. “Cost capping streamlines campaign administration and allows you to increase the effects while keeping expenses under control,” which makes it an essential metric to add to your list of Facebook cost metrics.
How to Visualize Your ROAS from Facebook Ads in Databox
Are you looking for ways to visualize your ROAS from Facebook Ads?
In the video below, our product experts show how you can use Databox to set up and track your ROAS alongside other metrics that are vital for measuring the performance of your ads.
Editor’s note: Want our help setting this report up? Start a chat with our dashboard experts and they’ll help build this report for you. Just create your free Databox account and reach out to our team either via chat or email.
With this post, you’ve got five Facebook ad metrics that you should be tracking to reducing your ad spend. But, remember, the best way to go about cutting costs is by aiming to maximize profit or the return on the investment you make. It’s only then that you can say that you’re investing your budget right and making the most of Facebook ads.


