


Table of contents
Hey everyone, and welcome to another episode of Data Snacks. I’m Monja, product marketer here at Databox, and today we’re going to talk about return on ad spend by Facebook ads. Specifically how to track other metrics alongside ROAS in order to better understand why certain ads are more profitable than others.
In this episode of Data Snacks, I’m going to show you:
- How to visualize your ROAS from Facebook ads.
- How to track metrics like CPM, CPC, and CTR by ad alongside ROAS.
- And, how to analyze the data, so you know which adjustments to make.
Let’s get into it.
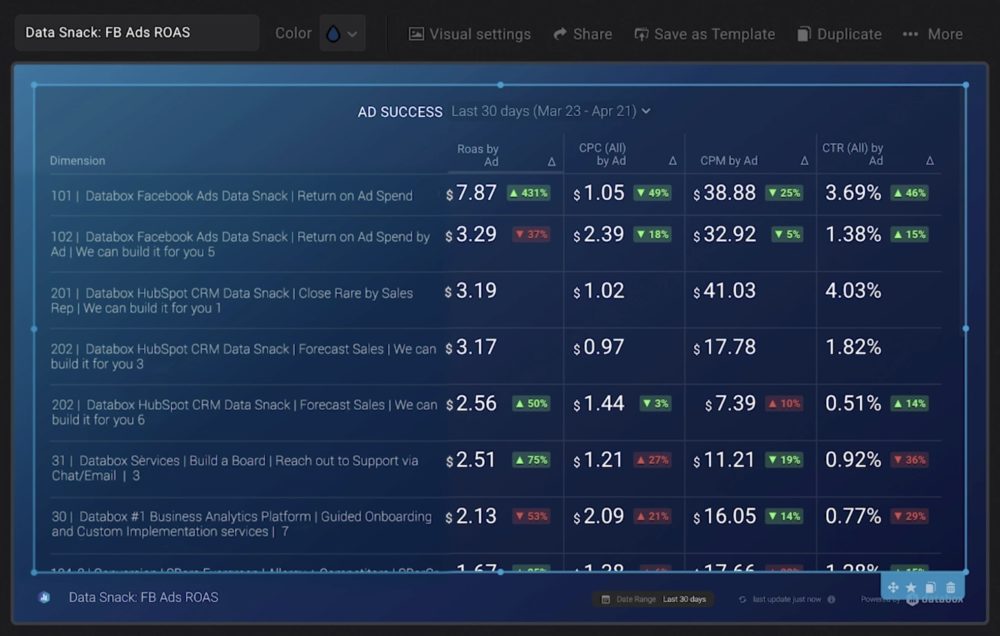
Here’s what I want to see. I want to track return on ad spend by ad to pinpoint my most effective ones in terms of ROI. But I also want to include other custom metrics like cost per click, cost per thousand impressions, and click-through rate so that I have the ability to analyze and understand why certain ads might be more profitable than others.
To do this, I’m going to drag and drop the Advanced table visualization into my dashboard. From there, I’m going to select the metrics I need making sure all metrics include the ‘by Ad’ dimension for each column in my table.
I’m also going to select ROAS by Ad as the column that the entire table should be sorted by. I’m doing this because I want to order the ads from highest to lowest in terms of ROAS in my table, which makes it easier to analyze the rest of my cost metrics by my most or least profitable ads.

Interpreting the ROAS Table
Once I’ve got my table put together, you can see that it’s very easy to interpret. I’ve got my ads ordered from highest return to lowest return, and I can also track the CPC, CPM, and CTR of each of these campaigns too. This will make it so much easier to dig into the why behind the performance of your ads.
Here are some things I’ll be looking for. First I’ll be checking for ads with a low ROAS and a higher CPM. A high CPM is typically a sign that the targeting you selected was too narrow. It was too small of an audience, therefore you had fewer overall impressions, which drove the price of your ad up. And typically if your CPM is high, your ROAS will be low. For these ads, you might want to look at adjusting your targeting in order to broaden the audience a bit, which will drive down the cost for impressions. An acceptable ROAS is influenced by profit margins, operating expenses, and the overall health of the business. Generally, an acceptable ROIs benchmark is a four to one ratio. So $4 revenue to $1 in ad spend.
Don’t Forget About CPM
I’ll also be looking at the ads with a high cost per click. In these cases, I’m specifically looking for ads that have a reasonable CPM, but a high CPC. Now this means that enough people are seeing my ad, but they are not clicking, which is driving my costs up yet resulting in a lesser return. It could be a targeting issue; so are the people seeing my ad the right audience? It could be an ad quality issue; is my copy engaging enough, is the ad creative enough to stop people from scrolling? Or it could be a placement issue; would this ad work better in the newsfeed or on the sidebar? Now digging into CPC in relation to CPM and ROAS will help me better understand the answers to these questions.
Finally, I’ll be looking for ads with a low click-through rate. We want our ads to have a low CPC, but a high CTR. If you’re not seeing that you can track CTR by ad to better understand which ads are actually resonating with the audience you are targeting.
PRO TIP: What’s the overall engagement of your ad campaigns?
Want to make sure your Meta ads are performing and trending in the right direction across platforms? There are several types of metrics you should track, from costs to campaign engagement to ad-level engagement, and so on.
Here are a few we’d recommend focusing on.
- Cost per click (CPC): How much are you paying for each click from your ad campaign? CPC is one of the most commonly tracked metrics, and for good reason, as if this is high, it’s more likely your overall return on investment will be lower.
- Cost per thousand impressions (CPM): If your ad impressions are low, it’s a good bet everything else (CPC, overall costs, etc.) will be higher. Also, if your impressions are low, your targeting could be too narrow. Either way, it’s important to track and make adjustments when needed.
- Ad frequency: How often are people seeing your ads in their news feed? Again, this could signal larger issues with targeting, competition, ad quality, and more. So keep a close eye on it.
- Impressions: A high number of impressions indicates that your ad is well optimized for the platform and your audience.
- Amount spent: Tracking the estimated amount of money you’ve spent on your campaigns, ad set or individual ad will show you if you staying within your budget and which campaigns are the most cost-effective.
Tracking these metrics in Facebook Ads Manager can be overwhelming since the tool is not easy to navigate and the visualizations are quite limiting. It’s also a bit time-consuming to combine all the metrics you need in one view.
We’ve made this easier by building a plug-and-play Facebook Ads dashboard that takes your data and automatically visualizes the right metrics to give you an in-depth analysis of your ad performance.
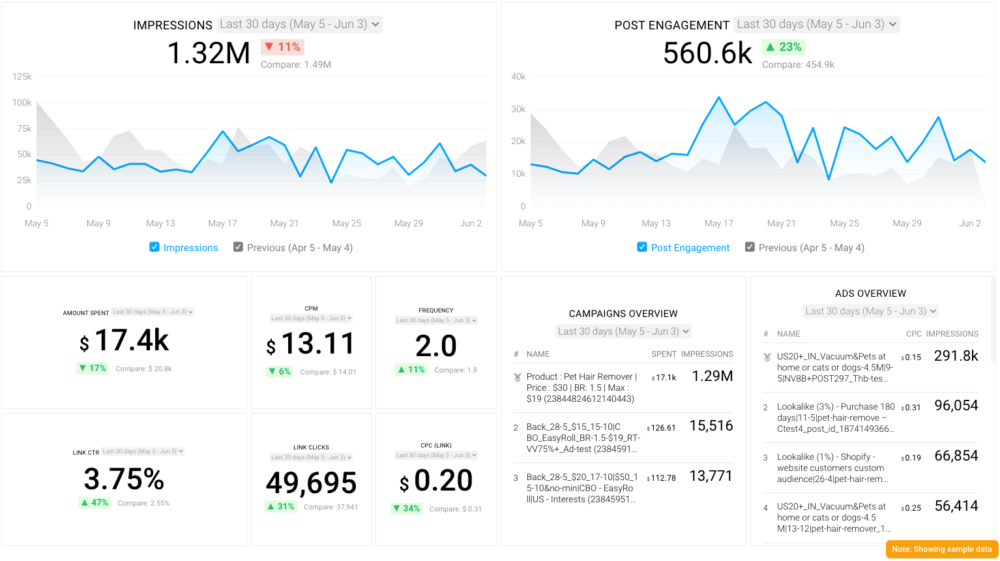
With this Facebook Ads dashboard, you can quickly discover your most popular ads and see which campaigns have the highest ROI, including details such as:
- What are your highest performance Facebook Ad campaigns? (impressions by campaign)
- How many clicks do your ads receive? (click-through rate)
- Are your ad campaigns under or over budget? (cost per thousand impressions)
- What are your most cost-efficient ad campaigns? (amount spent by campaign)
- How often are people seeing your ads in their news feed? (ad frequency)
And more…
You can easily set it up in just a few clicks – no coding required.
To set up the dashboard, follow these 3 simple steps:
Step 1: Get the template
Step 2: Connect your Facebook Ads account with Databox.
Step 3: Watch your dashboard populate in seconds.
Additional Insights into Facebook Ads
There are certainly more insights you can pull from this visualization. These examples were just a few to get you started. Considering 60% of agencies set goals around ROAS according to our recent Facebook ads research, it is valuable to track your ROAS as highlighted above to help you draw a correlation between impressions and clicks by ad and your overall return on your ad spend.
Want our help setting this report up? Start a chat with our dashboard experts and they’ll help build this report for you.
Just create your free Databox account and reach out to our team either via chat or email. See you next time.


