Facebook (Page Insights) Dashboard Template

Template created by Databox Databox
Use this Facebook (Page Insights) Dashboard Template to uncover key insights about your Facebook page. Keep track of important metrics such as page views, click actions on the page, total page likes, follower stats and demographics, and so on.

Uses one-click integrations:

  • Facebook Pages Facebook Pages

If you don’t use Facebook Pages, you can pull data from any of our 100+ one-click, native integrations or from spreadsheets, databases and other APIs.

Get this dashboard for free

What you’ll learn from this Facebook (Page Insights) Dashboard Template

Learn about your Facebook followers and how they’re interacting with your page and the content you post. Use this information to optimize your Facebook marketing strategy and measure your ROI. Connect your Facebook account and learn:

  • What are the demographics of the people who visit my Facebook Page? Get detailed demographic data about your Facebook followers, such as their gender and geographic location. Use this information to better tailor your messaging and Ads towards your current customer demographics.
  • How do I track likes and unlikes on my Facebook page? See how many people have liked and unliked your page within a specified period of time. Also, view the total number of likes your page has gathered over time.
  • How are my recent posts performing? Analyze and measure your most recent posts’ performance based on the total number of clicks and reach they gathered during a period of time. Dig deeper to learn why some of these posts performed better than others.
  • How do I see insights about my Facebook posts? Evaluate your Facebook posts’ success by tracking key metrics such as post count (the total number of posts on your Facebook page) and post reach (the number of people who saw your post on their timeline within a specified time period). Also, see in detail how many people saw your post on their screen at least once via paid, organic, and viral distribution
  • What actions do people take on my Facebook page?See what people do when they’re on your Facebook page. View the total number of people that clicked on your call-to-action button, as well as those that clicked on getting direction, contact information (phone number), and website.
  • How do I measure the reach of my Facebook posts? Get actionable data on the total number of people that have seen your posts on their screen at least once, either through paid, organic, or viral means. Visually monitor your post reach daily to ensure your target audience is seeing your posts, and if not (or if your post reach is significantly low), find out why.
  • How do I assess the performance of my Facebook page?Track your most valuable Facebook page metrics at a glance, such as page reach, page impressions, page engagements, page clicks, page reactions, comments, and shares. Use this wealth of data to evaluate your Facebook page’s performance and effectiveness of your Facebook marketing strategy.
  • Can I track the number of visits my Facebook page gets? View the total number of people that visited your Facebook page within a given time period. Compare the total number of page visits for the currently selected time period to the same period last week, last month, or last year.

Pull additional data using our deep integration with Facebook pages.

What other campaign metrics can you track and visualize with our integration with Facebook pages? Almost anything:

  • Engagement, reach, and impressions
  • Page likes & follows
  • Video views, engagement, and retention
  • Post actions and reactions
  • Facebook messaging insights
  • Reviews/recommendations

In Databox, there are almost 100 Facebook metrics already built and ready for you to visualize in a variety of different ways. With Query Builder and Data Calculations, the range of different metrics and metric combinations you can track from Facebook widens.

Read more about Databox’s Facebook Pages integration..

Facebook Pages Facebook Pages metrics included in this template
  • Phone Number Clicks

    Number of Unique People who logged in to Facebook and Clicked the Call Now button during the specified Date Range.

  • Action Button Clicks

    Unique number of Clicks on the Page CTA button by People who are logged in to Facebook during the specified Date Range.

  • Page Unlikes

    Number of Page Unlikes during the specified Date Range.

  • Get Direction Clicks

    Number of Unique People who logged in to Facebook and Clicked the Get Directions button during the specified Date Range.

  • Post Reach - Organic

    Number of People who Saw Unpaid Posts from your Page in News Feed or on Visits to your Page during the specified Date Range.

  • Post Reach - Paid

    Number of People who Saw your Page Posts in an Ad or Sponsored Story during the specified Date Range.

  • Post Reach

    Number of People who Saw any of your Page Posts during the specified Date Range.

  • Post Reach - Viral

    Number of People who Saw your Page Posts via a Story from a Friend during the specified Date Range.

  • 3-Second Video Views

    Number of times your Page's Videos were Viewed for 3 Seconds or more during the specified Date Range.

  • Page Views

    Number of times a Page's Profile has been Viewed by logged in and logged out People during the specified Date Range.

  • Website Clicks

    Number of Unique People who logged in to Facebook and Clicked the Go to Website CTA button during the specified Date Range.

  • Post Reach by Post

    Number of People Reached split up by Posts published in the specified Date Range. Posts include Statuses, Photos, Links, Videos and more. Daily totals are not available for this metric. Instead, the total current value of this metric will be visualized cumulatively.

Customize this dashboard with Databox

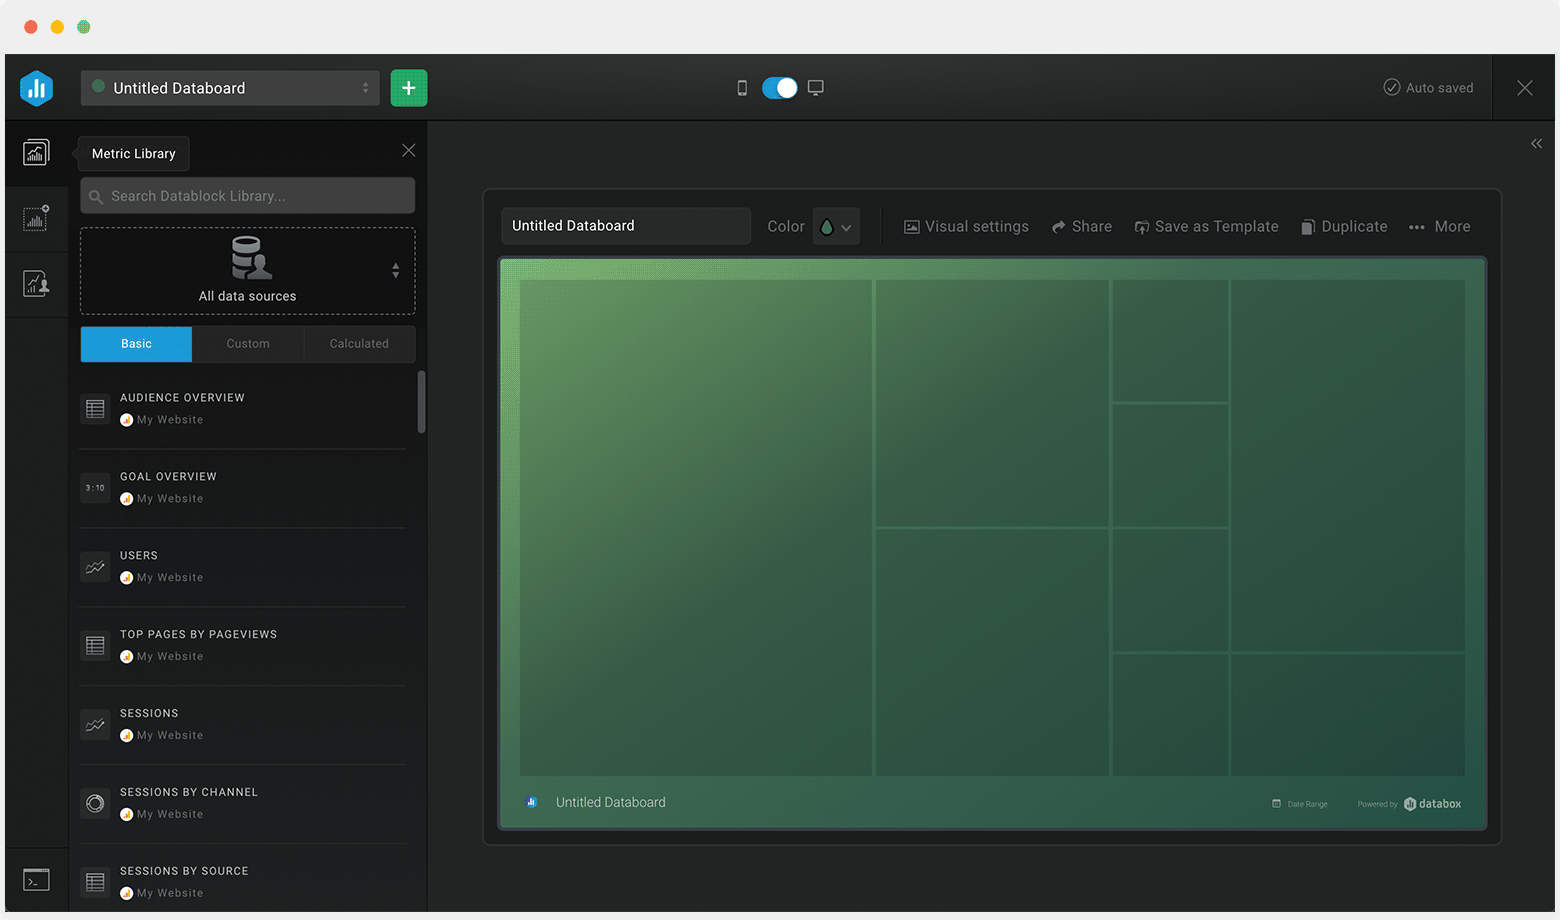
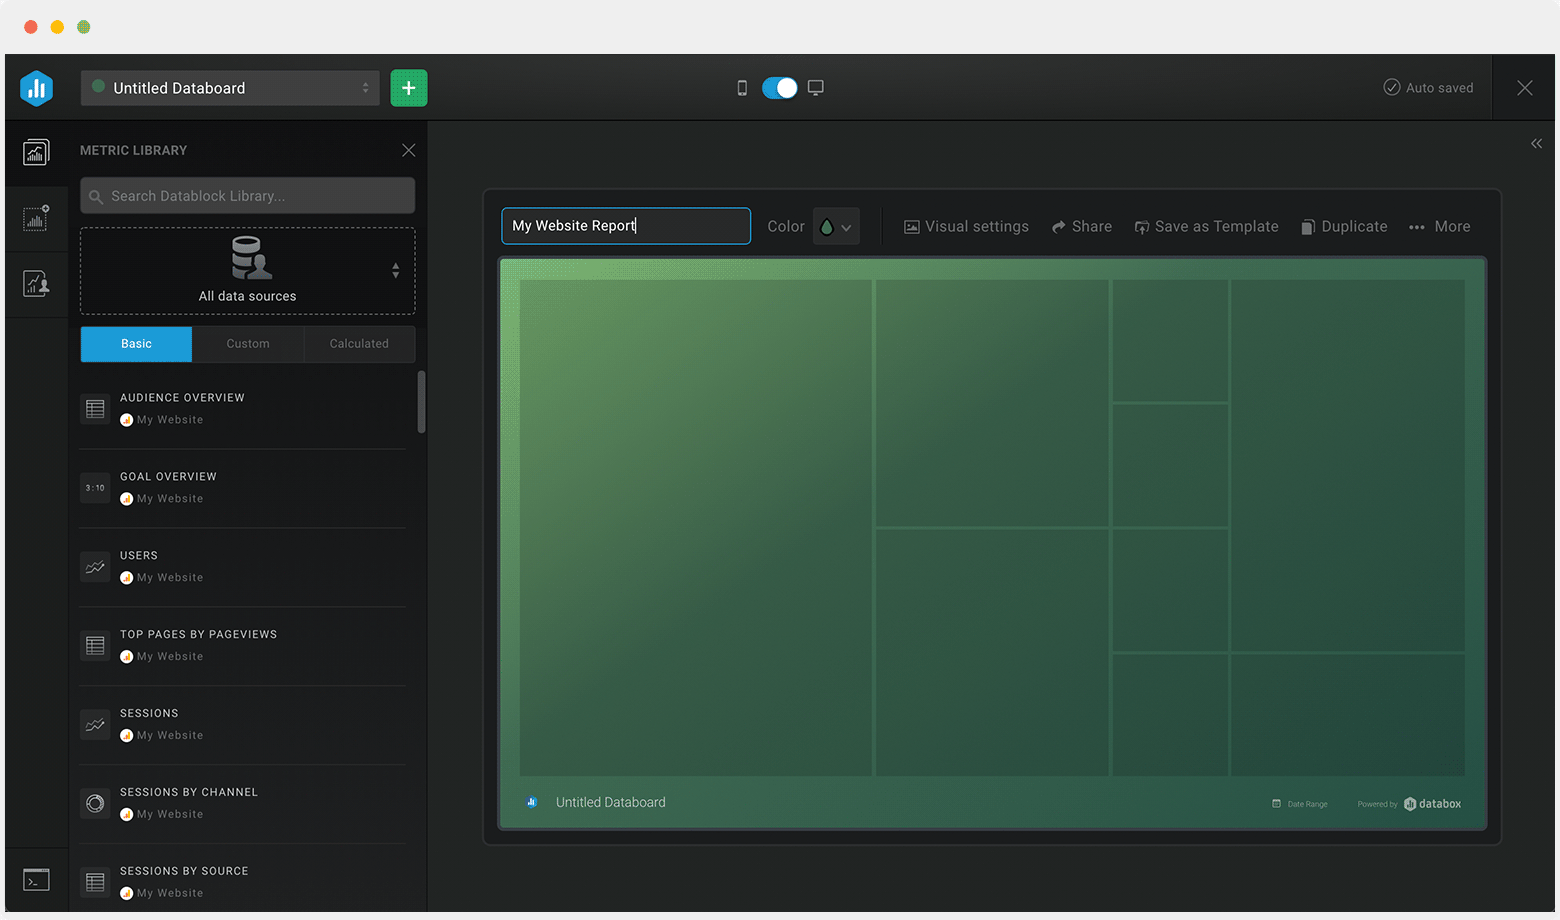
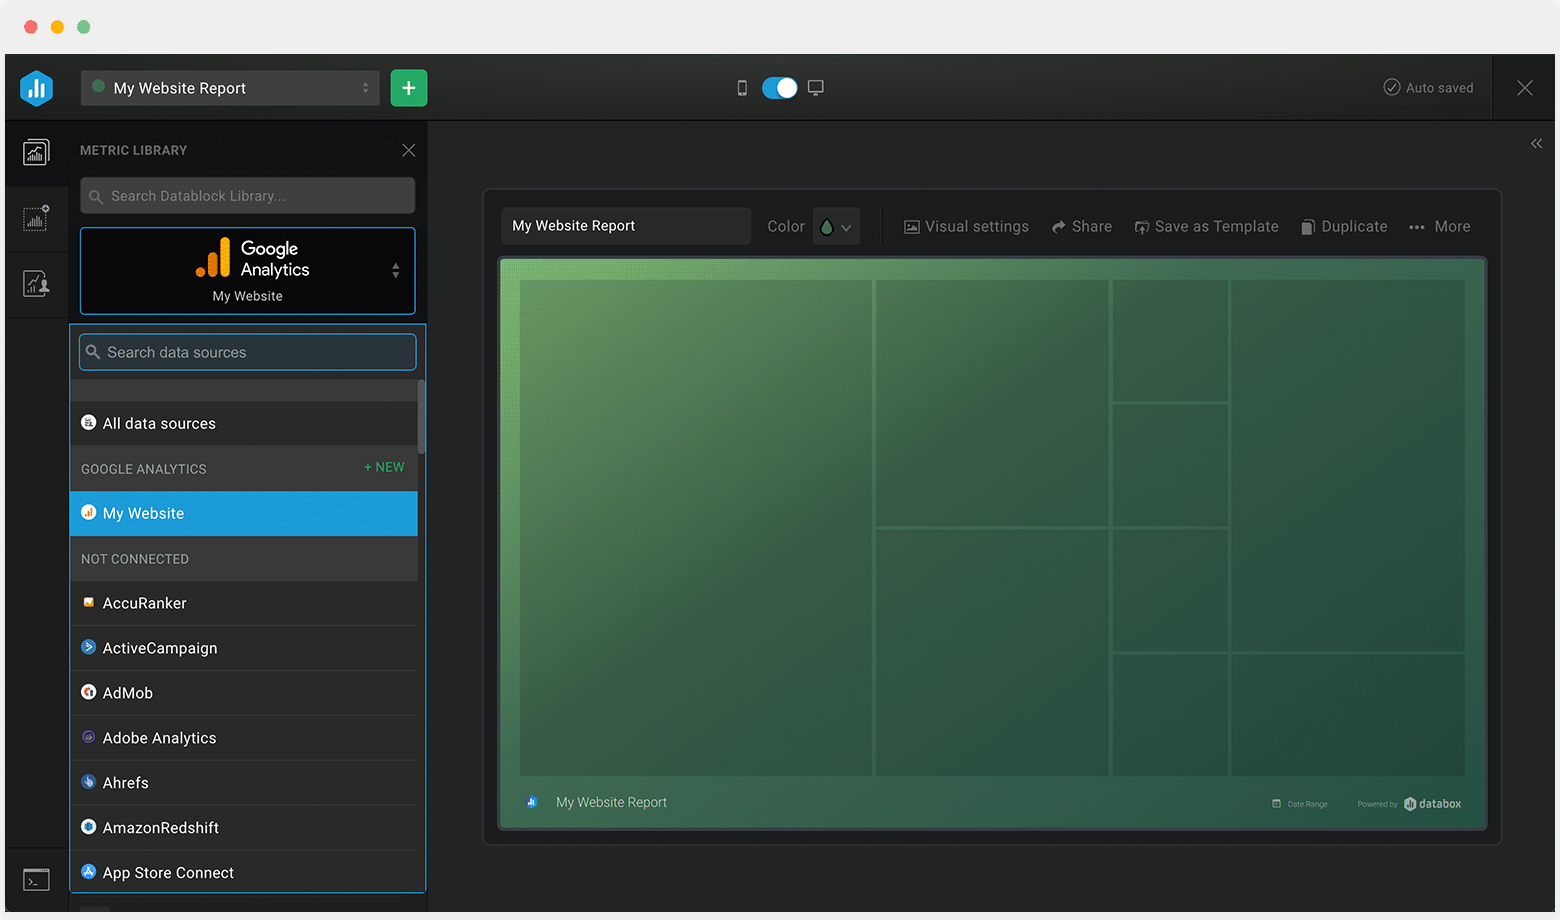
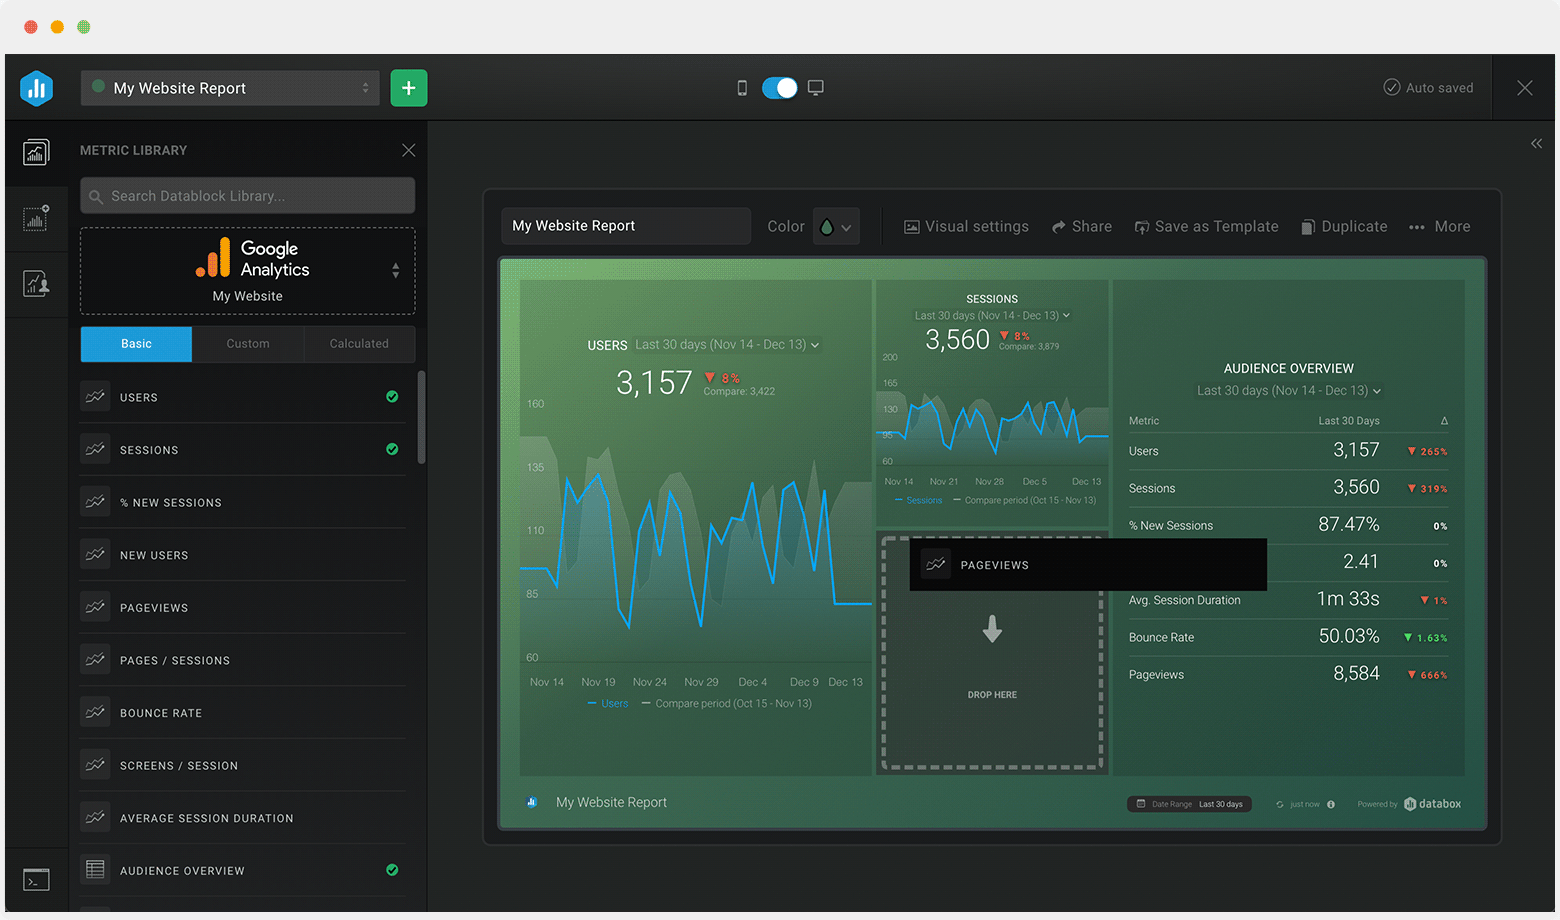
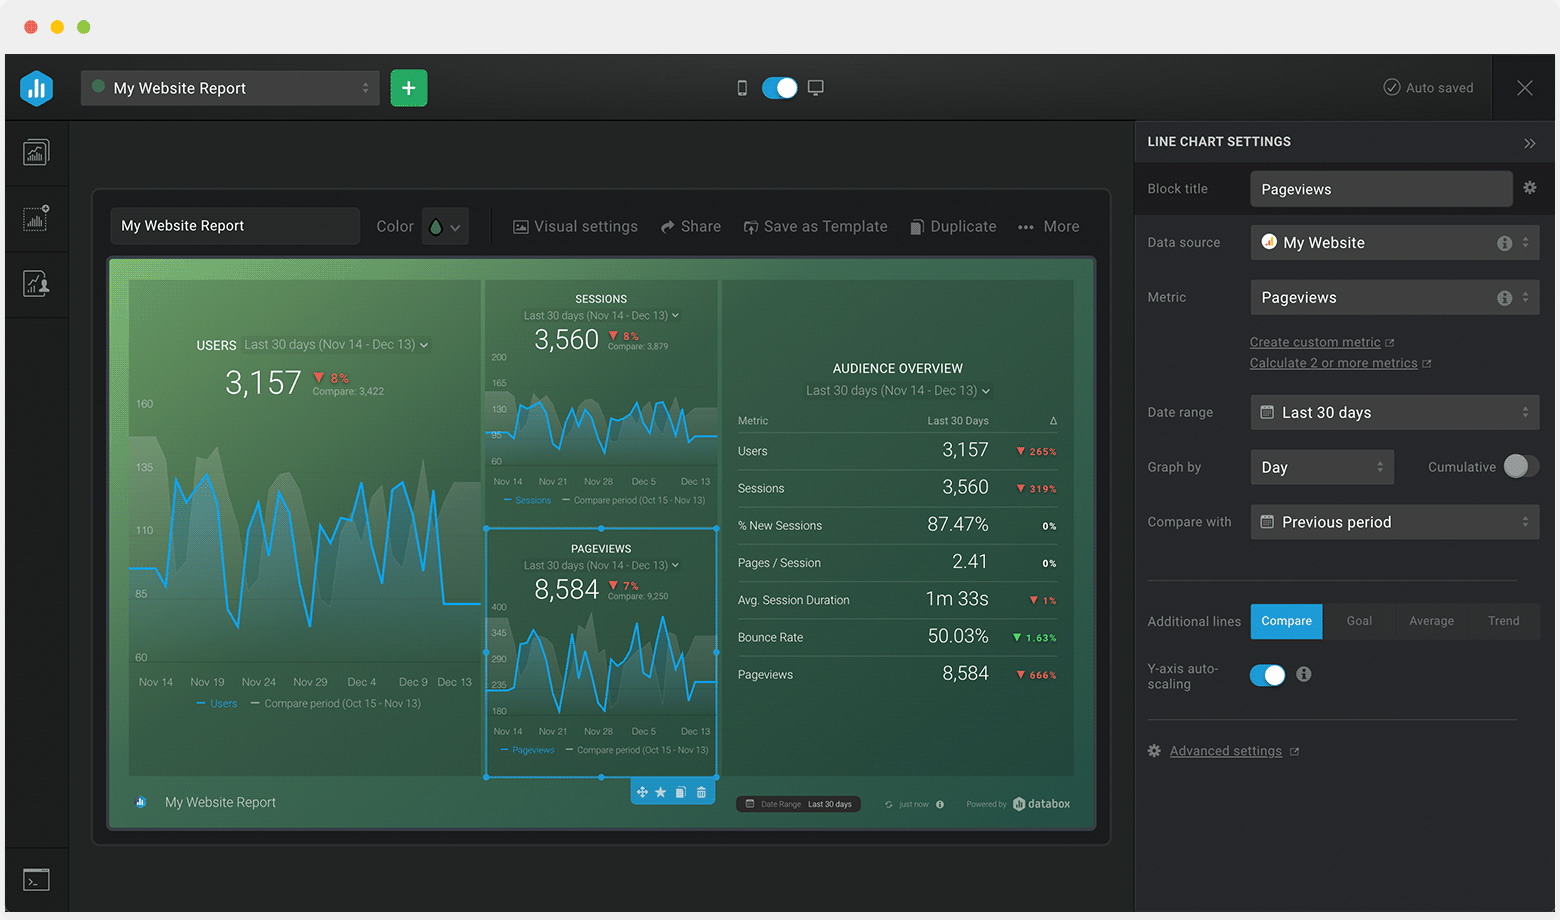
Sometimes, you’ll want to dive deeper into performance. When you need to customize this template (or any other dashboard) to include different metrics, add metrics from different sources, etc., you can do so by using Databox’s Dashboard Designer.

The Designer allows you to easily drag-and-drop metrics and visualizations from any data source right into your dashboard.

Get Started