


")
Table of contents
Here’s the thing: no amount of best practices, tips, and tricks can ready you for creating your business intelligence report like a BI report example can.
Pushing you to move forward without these examples is a surefire recipe to not only waste your time and resources but also slow decision-making for the reports’ audience.
It’s why we’ve done the legwork for you by reaching out to the experts and talking to them about business intelligence reporting.
So, in this post, we bring you business intelligence reports examples to set you on the straight (and productive) track of creating useful reports.
Overall, here’s what we’ll cover:
What is a Business Intelligence Report?
Let’s begin with a quick recap: business intelligence reporting is the process of using business intelligence tools to process data into actionable insights.
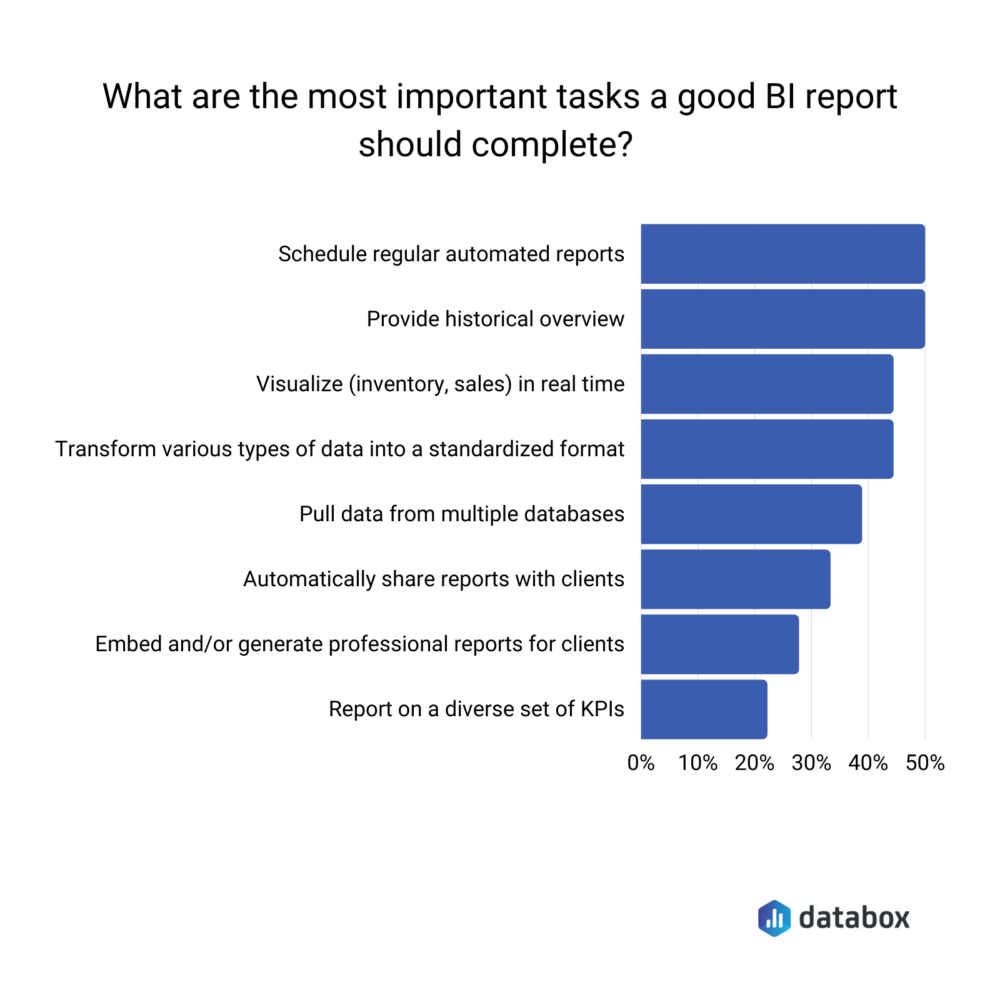
The goal? Analyze current and historical data to improve decision-making and, with it, business performance. In fact, a BI report’s role of providing a historical overview of data is the top factor this reporting accomplishes alongside scheduling regular automated reports, our contributors say.
Apart from these two top tasks, a good BI report also visualizes sales and inventory in real-time, transforms various data into a standardized format, pulls data from multiple databases, and automatically shares reports with clients (in that order).
The last two things that a good BI report should do include generating professional reports for clients and reporting on a diverse set of KPIs.
Ultimately, business intelligence reporting is an effective way to provide businesses a competitive advantage.
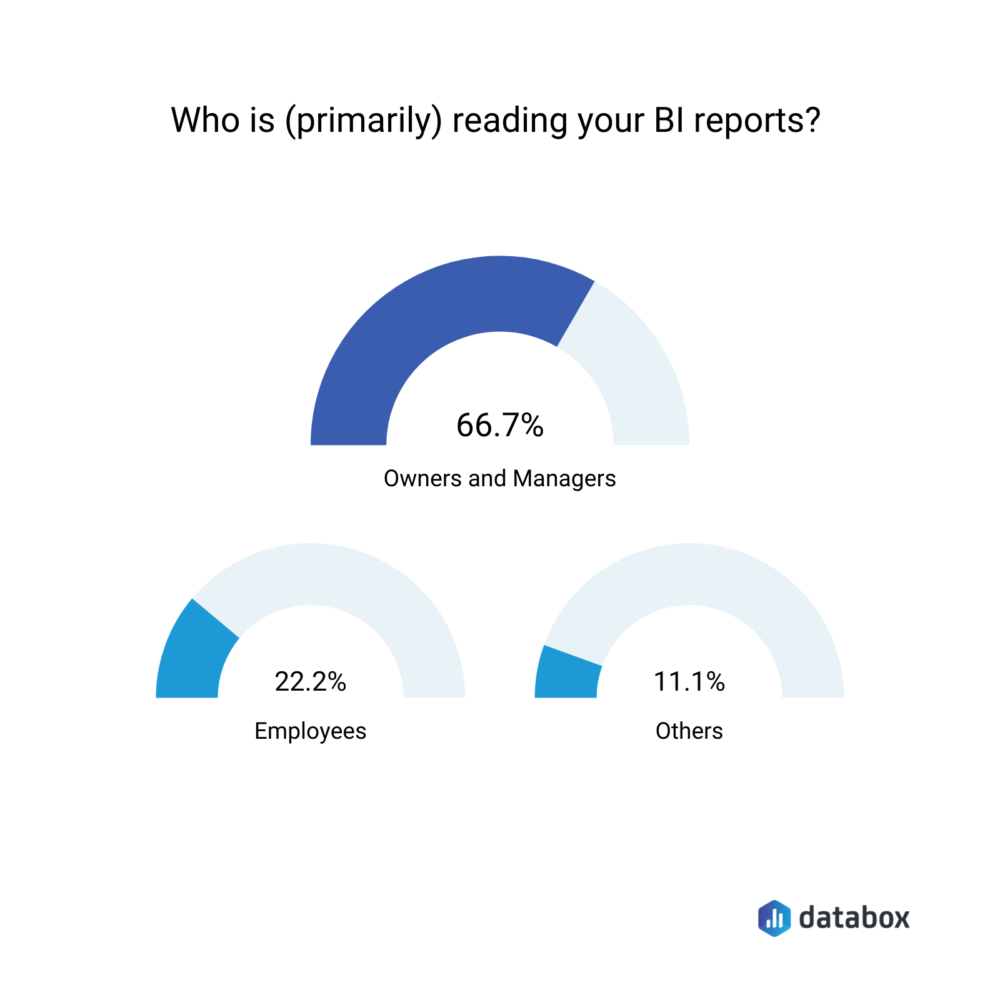
The question now is: who reads these reports? Mainly, key decision-makers.
Our respondents confirm this agreeing that 66.7% of their readers are managers and owners. 22.2% are also employees while the remaining 11.1% are others.
Build automated reports and make better decisions
Report what happened, what changed, then talk about what to do next.
No matter which BI report format you choose, decision-makers often need help interpreting what the numbers actually mean. Instead of manually cross-referencing multiple dashboards and exports, teams now use AI data analysts, like Databox MCP, to ask straightforward questions about performance and get answers grounded in their real metrics, definitions, and historical data. This makes it easier to explain trends, connect KPIs to business outcomes, and move from reporting what happened to understanding why it happened and what to adjust next.
Business Intelligence Reports Examples
Now for the business intelligence reports examples that we promised. Here’s a list followed by the details:
- Department-segmented business intelligence report
- Employee performance-based business intelligence report
- Interactive business intelligence report example
- KPIs-based scorecard report example
- Embedded business intelligence reports
- Predictive analytics-based business intelligence reports
- Google Data Studio business intelligence report
1. Department-segmented business intelligence report
“We have different metrics per department, so we segment reports for each department,” writes Jordan Brannon from Coalition Technologies.
Their daily reports dashboard, therefore, shows the following data that Brannon shares:
- “Monthly Revenue and Expenses
- Trailing Twelve Months (TTM) Revenue
- TTM Revenue Retention
- Monthly New Sales Revenue
- Monthly Revenue Retention in %
- Monthly Revenue per Service Line
- Accounts Receivable
- Applicants, New Hires, Terminations
- Lead Volume”
Note that these metrics are useful for different departments.
The accounts receivable data, for instance, is handy for the finance department but other departments can also view it (if needed) as it’s on the same dashboard.
Similarly, lead volume is important data for the sales department but stakeholders can also view it for a quick idea of how healthy the sales pipeline is.
Interested in collecting data to create such a business intelligence report? Brannon explains their process that you can swipe: “We collate data and organize them in a manner that is actionable to us. Our analysis is straightforward: we look at the trend on a monthly and sometimes, rolling 6-month basis so that we can benchmark our performance against historical data.”
Related: 100+ Free Business Dashboard Examples and Templates
2. Employee performance business intelligence report example
“At Spyic, we keep track of employee performance. To make it easier to track performance, we use business intelligence reports to find trends in our business data,” highlights Spyic’s Katherine Brown.
Such reports help the team offer as good customer service as they can, says Brown.
Hence, a business intelligence report example of an employee-focused report according to Brown is one that shows:
- “The number of new customers who came into our company every month over the last year
- How many employees are now servicing
- Employees’ average revenue per customer and how much that has increased each month over time
- How many sales reps have onboard and their average revenue per rep.”
Brown adds, “We use this report to determine which sales teams are performing well and which ones aren’t. We can also see any overlap in the clients our sales reps are servicing, which could help us consolidate them under one person, so we don’t duplicate work or miss opportunities to upsell.”
Such a report is useful for both customer service and sales teams. In fact, tracking each rep’s performance does the clients they serve is a great way for sales managers to grow sales by:
- Setting effective sales goals for each rep and
- Encouraging them to build relationships with clients to cross-sell and upsell them.
Now for how you can create such employee-centered BI reports. Brown shares two things that work: presenting data that is consistent and presenting it in a format that’s easy to use.
“Once we get the data, it’s up to us to get it into the format that will make it easy to use in the reports.
Brown lays out their process in three steps:
- Step 1: “It starts with making sure all of our data is consistent. If we collect data from multiple sources, we ensure that they’re consistent in how they record the information in their systems.”
- Step 2: “Then we make sure that all of the information is neatly organized in an easy-to-read format so that it’s easy to understand at a glance. We perform this task by creating tables and charts, and other visual aids to show our data.”
- Step 3: “Once we’ve organized all of our data, we run our reports and then use these reports to track performance over time. We can also use the information to identify areas where we’re doing well and those where we’re not to adjust accordingly,” Brown explains.
3. Interactive business intelligence reports
At Whizlabs, the team prefers interactive reports. But they’re not alone.
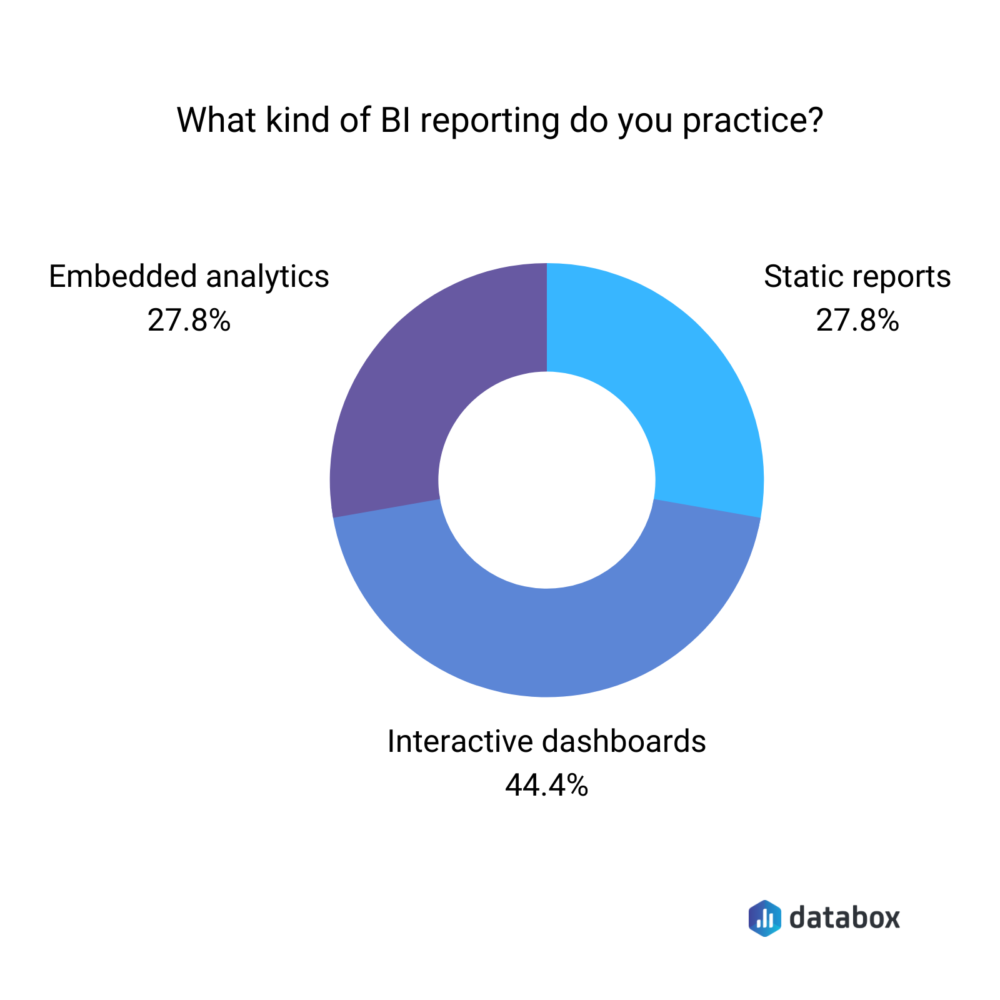
Our respondents share they’re largely dependent on interactive reports themselves as 44.4% of their reporting happens on interactive dashboards. Others, 27.8% each use embedded analytics and static reports.
Circling back to Whizlabs, Girdharee Saran from their team points out: “We usually prefer and use BI reports that have interactive elements and which provide historical and real-time data.”
Here’s a business intelligence report example that Saran shares from one published in the
Microsoft Power BI communities:

“The Coronavirus Outbreak Report JCH displays the real-time Covid-19 propagation globally,” Saran comments. “It is an interactive and insightful dashboard with various sections wherein you will find live updates of COVID cases country-wise. It is updated on a daily basis.”
“The key highlight of this report is the ability to fetch real-time data and it provides an interface,” Saran goes on. “So, I personally feel that for our business such a BI report theme is very useful.”
Want to create an interactive BI report? Replicate what Saran’s team does: “We follow the typical approach to produce or generate BI reports using raw data. These include:
1. Collecting and loading the raw data.
2. Transforming the raw data manually.
3. Testing the transformation with manual queries.
4. Building the BI reports.”
4. KPIs-based scorecard report example
“A scorecard is a type of BI report that presents a detailed overview of different KPIs of a firm,” explains Eva Lerma of My Travel Tripod.
“The KPIs are listed in a table format, and there are green, yellow, and red status icons and trend lines to indicate how each KPI measure is progressing with regard to business targets and objectives.”
These status icons are quick performance indicators, telling the report’s readers how well each KPI is doing at one glance.
As Lerma highlights this report is useful as it “shows organizations their overall progress towards different goals. This allows them to better analyze which metrics need improvements and work on them.”
Needless to say, the better and easier it is to analyze data, the better decisions managers, owners, employees, and the rest can take.
To this end, Lerma recommends data analytics tools such as Google Analytics for you to create this type of business intelligence report. According to Lerma, the tools help process data into usable information.
“These tools are capable of processing huge amounts of data and presenting it in various formats like pie charts, bar graphs, and pictograms,” Lerma shares. “Business users have the option of choosing their preferred formats according to the needs of the business.”
5. Embedded business intelligence reports
Vicky Cano from MealFan shares this example, writing: “Embedded business intelligence reports integrate the BI capabilities within the products, applications, and processes.”
“This reporting method lets employees, suppliers, and employers access important information in the same workflow rather than switching applications and wasting time,” Cano comments.
Much like the colored status buttons in the business intelligence report example above, this type of reporting also prioritizes making it easy to digest data. Most of all, “embedded BI helps in making faster decisions through its connectivity, and insights can be found easily,” says Cano.
As with other respondents, we also asked Cano how to turn raw data into business-ready information for BI reports. Cano summarized the answers: “Replicate, ingest, and transform the available details into a standardized format.
The information can then be stored into data lakes or data warehouses which is the best available categorization and storage option for BI reports.”
Keep in mind that a standardized format for processing and presenting data is great for analysis and reporting consistency. With a standard format, for example, report readers can immediately tell where they can get the information they’re looking for.
In short, always favor a templated, consistent report format over new reporting formats to set and meet readers’ expectations.
6. Predictive analytics-based business intelligence report example
Sue Hirst’s team at CFO On-Call uses BI reports based on predictive analytics.
This type of data analysis uses data mining, machine learning, and predictive modeling among other statistical techniques to predict the future based on past and current data trends.
Listing its benefits, Hirst writes: “It helps you define the marketing and sales goals of your organization, it can assist you to define budget limitations for the following year, etc. Predictive analytics can also be essential to help you build data visualizations and dashboards for the upcoming months.”
“I prefer using this report because it helps you make very precise decisions and plans for the upcoming months,” concludes Hirst.
Essentially, predictive analytics is a useful addition for teams to set and meet their goals.
Take the sales team, for instance. They can use predictive analytics to set challenging yet achievable sales goals. To add, predictive software such as predictive scoring can help them dedicate resources to hot, ready-to-convert leads with a high conversion score rather than cold leads.
Related: SMART Sales Goal Examples from 30+ Sales Professionals
With that out of the way, let’s look at what Hirst suggests for turning raw data into a digestible BI report. Hirst does this in three simple steps:
- Step 1: “Prepare raw data for information is eliminate or remove any useless tables or information.”
- Step 2: “Organize the data to make it easily readable before preparing the report.”
- Step 3: “Transform the data into graphs and charts to make information more visual using the relevant details,” explains Hirst.
7. Google Data Studio business intelligence report
Passport Photo Online’s Leszek Dudkiewicz shares this BI report example.
Dudkiewicz explains why it works so well: “We chose Google Data Studio for a couple of reasons. Firstly, our employees can learn it quickly thanks to its easy-to-use interface. Likewise, since it’s integrated with Google Analytics, Google Sheets, and others, our team has access to well-known tools.
To add, Dudkiewicz says, “it meets all our needs as small business owners, but it’s free at the same time.”
So how do you turn raw data into a BI report in Google Data Studio? Dudkiewicz has the answer: “Since we are a small business, the data we collect through the available features of Google Analytics (integrated with Google Data Studio) is enough for us.
In most cases, we use a ready-made dataset or implemented connectors (i.e. Facebook, LinkedIn). Whenever we need more information, we simply put it into Google Sheets. One click converts them into a report. Afterward, we adjust a design, change views, and apply filters, and there we have it!”

Found a favorite business intelligence report example? Get to work today.
Remember: perfecting your BI report isn’t limited to making sure it’s embedded or interactive. Instead, a useful business intelligence report is one that your readers find useful.
So once you’ve worked out a report format, be sure to ask for feedback.


