





Table of contents
On its own, gen AI runs your performance analysis without a trusted data foundation, without your business context, and without built-in analytical methods, and that leaves its answers open to mistakes. Databox grounds AI tools in all three.
TL;DR
- 66% of business users believe ChatGPT or Claude could replace their company’s BI tools, per Databox’s Using AI You Don’t Trust survey, and 74% of the same population have shipped a decision or report on an AI-generated number that later proved wrong.
- General-purpose LLMs cover three of the five capabilities Gartner lists for agentic analytics platforms (natural language query, agent workflow orchestration, automated insights); data source connectivity and data preparation are the two they lack out of the box.
- Without a trusted data foundation beneath it, AI answers from snapshots and slices: uploads arrive frozen at download, MCP servers return a page of results. Only 9% of business users run AI on a unified data layer.
- Without business context (shared metric definitions in a semantic layer, plus your goals and history), the same question returns different numbers and no number carries meaning. 59% of users have re-run the same question through generative AI and received a different answer.
- Without built-in analytical methods, a forecast or an anomaly check is a prediction rather than a computation, and the model may calculate it differently on every run. In our error-detection test, 5% of respondents caught all three planted errors in an AI-generated analysis.
- The Databox MCP server grounds Claude, ChatGPT, and other AI platforms in trusted data, business context, and built-in analysis, so teams keep the chat interface they already work in. The Databox workspace runs the same grounded analysis on its own, on schedules.
“What does Databox do that Claude or ChatGPT doesn’t?” has become the most common competitive question our prospects ask. The question makes sense. On the surface, the products look alike: a chat interface, skills a team creates and stores, routines that run analysis on a schedule, and connections to MCP servers that act on the analysis Databox produces.
The people asking are in good company. In our Using AI You Don’t Trust: How Business Users Actually Run Analytics in 2026 survey, 66% of business users agreed that ChatGPT or Claude could replace the BI tools their company uses. Only 12% disagreed. The same survey found that 74% of those users have shipped a decision, report, or shared output built on an AI number that later turned out to be wrong. Among daily users, the figure reaches 91%.
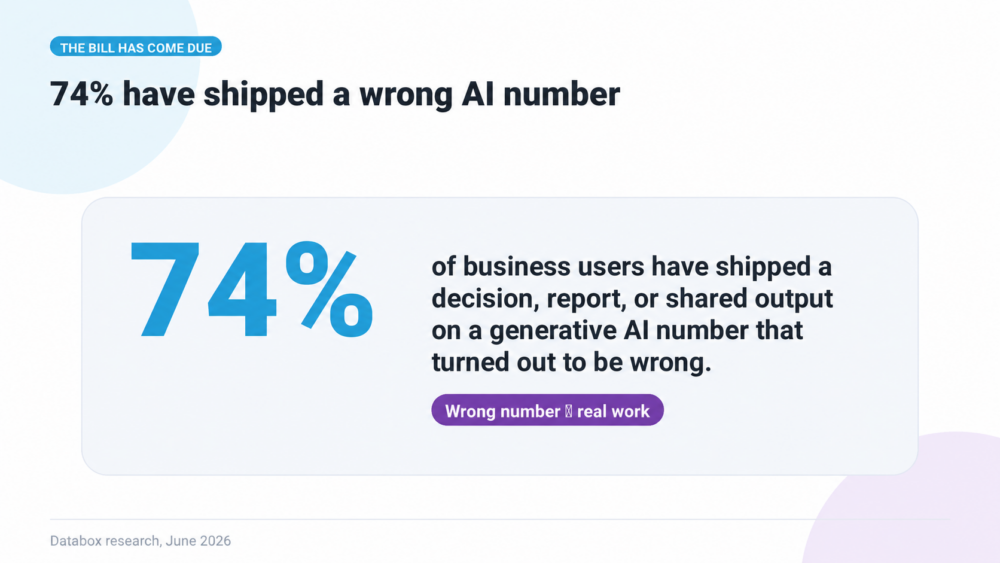
Gen AI feels like it can replace an analytics platform, and the analysis keeps failing in ways people discover only after they hit send. The distance between those two numbers is the answer to the prospect question: gen AI lacks a trusted data foundation, business context, and analytical intelligence, the three things that decide whether a team can act on an AI-produced number. Databox grounds AI tools in all three.
What Databox does that Claude and ChatGPT don’t comes down to three capabilities below the model
Let’s begin with what the general-purpose tools do well, because the concession is real. Claude and ChatGPT reason about data well. They visualize well. They remember across sessions and work with whatever context someone feeds them. For exploratory questions on data you paste in, they are genuinely good.
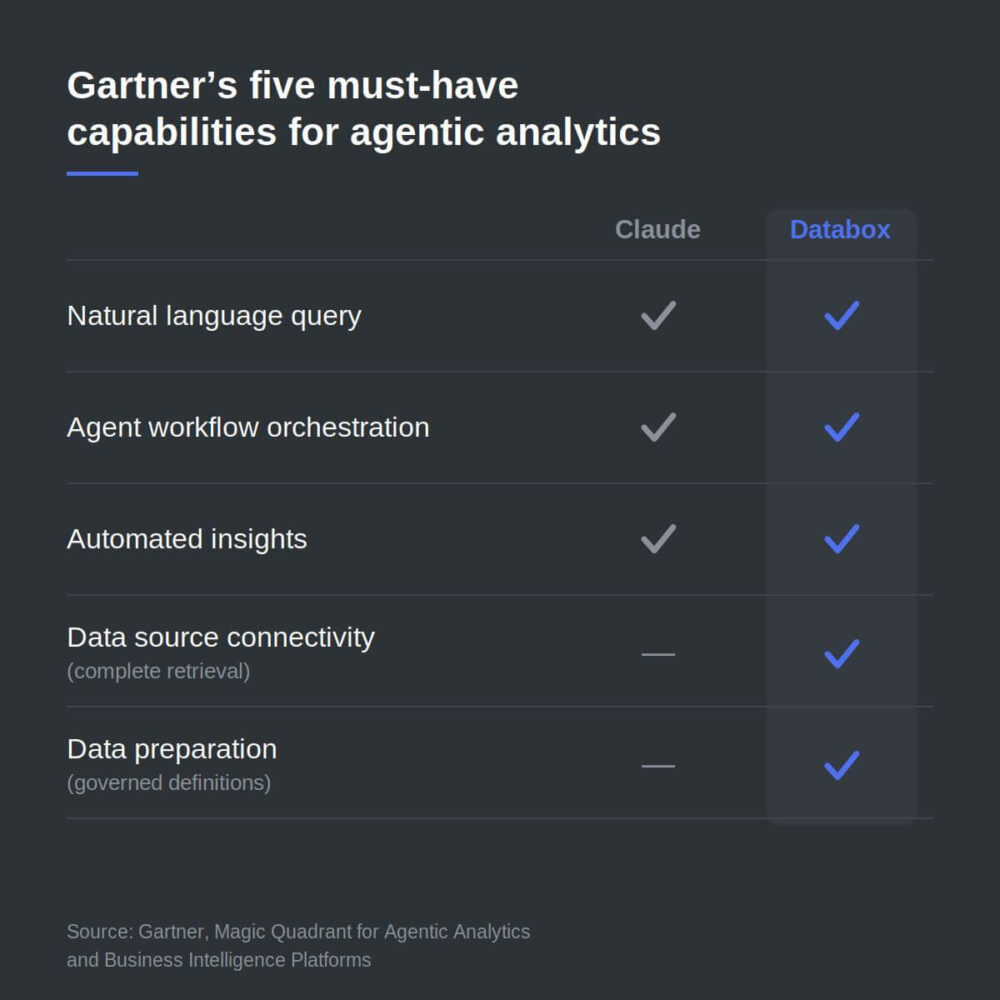
But Claude and ChatGPT are general-purpose LLMs. Databox is an agentic analytics platform. Gartner defines this category as software that applies AI agents across the data-to-insight workflow and lists five must-have capabilities: natural language query, agent workflow orchestration, automated insights, data source connectivity, and data preparation. The general-purpose tools ship with the first three. The missing two are data source connectivity and data preparation.
Capability lists read as analyst scorekeeping until you translate them into what a business user experiences. Data source connectivity builds the trusted data foundation: complete, live data, so the AI sees your whole business and anyone can trace where a number came from. Data preparation feeds AI your business context: the metric definitions, relationships, goals, and history that keep the same question returning the same number, and give the answer its meaning. A third capability hides underneath both, and no checklist captures it: analytical intelligence, the built-in methods that compute a forecast, an anomaly check, or a correlation the same way on every run. An analysis a team can trust and act on needs all three, and nearly every failure our survey respondents described maps to one of them.
Without access to a trusted data foundation, the AI never sees your whole business
Business data reaches Claude or ChatGPT in one of two ways: someone pastes or uploads it, or someone connects a source through an MCP server or plugin. In our survey, that covers nearly everyone. 66% of business users feed AI by pasting, uploading, or connecting one tool at a time, and only 9% said their AI can query a unified layer of their business data. Then they ask questions an analyst would need the full dataset to answer. Each path breaks in its own way.
Pasted and uploaded data arrives as a snapshot. The export is frozen at download and trimmed by row limits or the context window, and it is missing whatever changed since. The model treats what arrived as the whole truth. Attaching data you trust does not close the gap, because trust at the source does not survive the trip. A foundation is something you can’t attach to a prompt.
Connected data arrives as a slice when the connector is a thin pipe to a source API, and most are. The server returns the first page of results, a sampled range, whatever fit under a rate limit, and it rarely holds history the API no longer returns. Neither the model nor the person reading the answer can see that the slice happened. What an MCP server returns depends entirely on what sits behind it, and behind most sits a live API call and nothing else.
Underneath both paths sits the same failure. The model does the math itself on whatever arrived, predicting a plausible result the same way it predicts the next word. The output carries the same fluency whether the input was complete or a fragment.
Complete data is unglamorous engineering. Someone has to paginate through millions of rows, handle rate limits, backfill gaps, and hold onto history after the source API stops returning it. We have spent a decade on that work across 130+ integrations, plus databases, warehouses, and spreadsheets. A number in Databox traces back to a complete, stored dataset, the trace is visible to the person reading it, and the calculation never depends on what happened to fit in a prompt. The answer is grounded.
Without business context, the same question returns different answers, and even the right number means nothing
People define metrics differently. Your CFO’s “revenue” excludes deferred; your sales VP’s includes it. Systems calculate the same metric differently. Every metric also needs an aggregation choice (sum, average, median, count, unique count), and the choice changes the number without changing the question. Feed all of that ambiguity to a model, and two people asking the same question get different answers. The Monday meeting becomes an argument about whose number is real. The decision waits.
Users already live with the symptom. 59% of respondents in the Using AI You Don’t Trust survey have re-run the same question through a generative AI tool and received a different answer, and one in five called the difference meaningful.
In Databox, you define a metric once. The semantic layer gives it a shared meaning: how the tables connect, which aggregation applies, and how the metric relates to your goals and history. A verification stamp shows who checked the definition and when. When AI answers a question about that metric, the answer runs through the stored definition, so the number your CFO sees on Monday matches the number your RevOps lead pulled on Friday.
Definitions settle what a number is. Goals and history settle what it means. A churn rate of 4.2% reads as a crisis or as a best quarter depending on the target it was supposed to hit and the trend it sits inside, and gen AI knows neither unless someone types it in fresh each session. In Databox, your goals, targets, and performance history live next to the metrics, so when AI reports a number it can also say whether you are ahead or behind and whether the movement is new. Business context covers all of it: the definitions, the goals, and the history behind every answer.
Without analytical intelligence, the analysis gets more wrong as it gets more ambitious
Answering what happened is arithmetic. Deciding what to do next takes methods: period comparisons and trend analysis to show how performance is changing, anomaly detection to separate a real shift from normal variation, correlation to find what drove it, forecasting to project where it lands, and scenario modeling to show what would have to change to hit the target. Each one is a computation, and a computation has to return the same result on every run.
Gen AI produces these outputs by prediction. Ask for a forecast and the model generates a plausible one the same way it completes a sentence, and it may calculate the answer differently from one prompt to the next, which makes the result difficult to verify. The damage scales with ambition: a quarterly summary built on guesswork is mildly wrong, while a forecast or a pace-to-goal calculation built on it is confidently wrong, and an LLM delivers a wrong forecast with the same fluency as a correct one. In the error-detection test we ran inside the Using AI You Don’t Trust survey, 5% of respondents caught all three planted errors in an AI-generated analysis.
In Databox, the analytical methods are built in and run directly on governed metrics. Anomaly detection flags a mid-quarter dip as unusual, correlation points to the lead source that likely caused it, a forecast shows where the quarter lands if nothing changes, and a scenario model shows how many additional deals, or how much more close rate, would make up the shortfall. The same question runs the same method and returns the same answer, and a person can check how it was computed.
Conclusion
The three gaps compound. A number pulled from sliced data, run through an assumed definition, and fed into a predicted forecast arrives looking exactly like a right answer. Confidence passes through the model. Verification does not.
The practical answer to the prospect question is a division of labor, and Gartner expects the market to settle there: its 2026 Market Guide for Agentic Analytics predicts that by 2028, 60% of self-service analytics users will run ad hoc and exploratory analysis through general-purpose LLMs, while production-grade reporting stays on analytics platforms. The chat interface supplies speed and convenience. The trusted data, business context, and built-in analysis underneath supply numbers a team can act on. You need both.
We built the Databox MCP server for exactly that split. 86% of the business users we surveyed reach for ChatGPT, Claude, Gemini, or Copilot before any other tool for analytical work, so the grounding has to meet them there. Connect the Databox MCP server to Claude, ChatGPT, Cursor, or n8n and the split becomes clean: the model interprets the question, and Databox executes the query, the calculation, and the analytical methods against complete, stored data and verified metric definitions. Behind this server sits the foundation; behind most others sits a single API call. The model never does the math. Teams that want the analysis to run on its own, on schedules, get the same grounded layer inside the Databox workspace.
We relaunched Databox around exactly that layer. You can read more about how our agentic analytics system works here: databox.com/rethinking-analytics-agentic-era
Frequently Asked Questions
Can Claude or ChatGPT replace a BI tool like Databox for business analytics?
Both handle natural language querying, reasoning, and visualization well, which covers the analysis layer. They lack a trusted data foundation, business context, and built-in analytical methods, so they work from whatever slice of data they receive, apply no stored metric definitions, and compute analysis by prediction. Teams that ground them through the Databox MCP server close all three gaps without leaving the chat interface.
What does the Databox MCP server add when I use Claude or ChatGPT for analysis?
It grounds the AI tool in trusted data, business context, and built-in analysis: complete data pulled and stored across 130+ integrations, databases, warehouses, and spreadsheets; a semantic layer where each metric is defined once, verified, and aggregated correctly, alongside the goals and history that give answers meaning; and analytical methods that run as computations on those metrics. The AI interprets the question; Databox executes the query and the calculation.
What does it mean to ground AI analysis?
A grounded AI tool queries a live, governed data source and calculates answers through metric definitions the team has already agreed on and verified. An ungrounded tool predicts a plausible answer from whatever slice of data reached it, doing the math itself and assuming a definition on each run. The difference shows up when someone asks where a number came from or asks the same question twice.
Which agentic analytics capabilities do Claude and ChatGPT lack out of the box?
Of the five must-have capabilities Gartner lists for the category, general-purpose LLMs ship with natural language query, agent workflow orchestration, and automated insights. They lack data source connectivity (complete, historical, traceable data from your systems) and data preparation (stored metric definitions with the correct aggregation applied every time). Beneath both sits a third gap no checklist captures: built-in analytical methods that compute forecasts, anomalies, and correlations the same way on every run.
Why can’t Claude or ChatGPT produce a dependable forecast from my data?
A forecast is a computation over complete history, and gen AI predicts one instead: it generates a plausible projection the same way it completes a sentence, and it may calculate differently on each run, which makes the result difficult to verify. Databox runs forecasting and scenario modeling as built-in methods on governed metrics, so the projection comes from the same computation every time and can be checked.
Why does Claude or ChatGPT return a different number when I ask the same analytical question twice?
Without a stored metric definition, the model re-decides on each run which tables to use, how they connect, and which aggregation to apply. Each of those choices can change the number without changing the question. In Databox’s Using AI You Don’t Trust survey, 59% of business users had experienced a different answer on a re-run.
How does Databox keep a metric’s definition consistent across teams?
Each metric is defined once, with the semantic layer holding how the underlying tables connect and which aggregation applies. A verification stamp records who approved the definition and when. Every query against that metric, whether from a dashboard, a scheduled routine, or an AI conversation, runs through the same stored definition.