

TL;DR
- Databox leads the cross-source category for SaaS teams that need revenue, marketing, and product metrics analyzed together under governed definitions. Amplitude and Mixpanel lead deep product analytics. ChartMogul leads subscription revenue metrics.
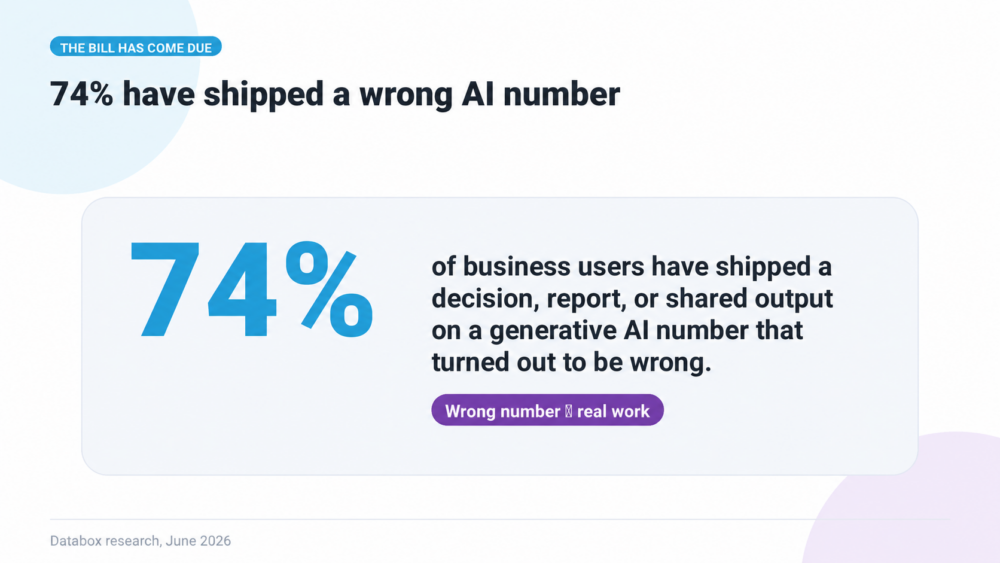
- Among business users who run generative AI for analytical work, 86% reach for ChatGPT, Claude, Gemini, or Copilot before any other tool, and 74% have shipped a decision or report on an AI-generated number that later proved wrong, per Databox’s 2026 study “Using AI You Don’t Trust.”
- The evaluation question for SaaS executives in 2026 is architectural: whether a tool’s AI reads answers computed by a real query engine or produces the math itself. Every tool on this list runs real computation; ChatGPT with a pasted CSV does not.
- Pick the category before the vendor. Product behavior questions belong in a product analytics tool. Board-level revenue questions belong in a cross-source layer where the CFO and the AI read the same verified metric definitions.
SaaS companies need analytics for three jobs: cross-source business reporting, product analytics, and subscription revenue metrics, and no single tool is best at all three. The best analytics tools for SaaS companies in 2026 are Databox for cross-source reporting and AI analysis across revenue, marketing, and product data; Amplitude, Mixpanel, PostHog, and Heap for product analytics; Power BI for Microsoft-stack teams with a data function; and ChartMogul and Baremetrics for subscription revenue metrics. Eight tools, three jobs. Which job is yours decides the shortlist, and the tradeoffs below decide the pick.
The 2026 caveat comes before the reviews, because it changes what a list like this is for. The first stop for analytical work now has no dashboards. Databox surveyed 100+ business users who run generative AI for analytical work (Using AI You Don’t Trust: How Business Users Actually Run Analytics in 2026) and found 86% reach for ChatGPT, Claude, Gemini, or Copilot before any other tool. In the same study, 74% had shipped a decision, report, or client deliverable built on an AI number that later turned out to be wrong. Among daily AI users, that figure reaches 91%.
Those two findings belong together. A language model reading a pasted CSV predicts what an average looks like. It does not compute one. Sometimes the prediction lands close. But, as we all know, revenue, churn, and ROAS decisions cannot run on close.
So, an analytics tool in 2026 carries one job the older comparison articles never tested for: giving that AI-first behavior a computation layer worth trusting. When a vendor advertises AI features, one architectural question separates the platforms from the demos: does the language model produce the numbers, or does it read numbers a query engine computed? Every tool reviewed below passes that test in its core product. The differences live in what data each tool computes over, who it serves, and what it costs you in setup, headcount, and blind spots.
Comparison table
| Tool | Category | Best for | AI approach | Pricing model |
|---|---|---|---|---|
| Databox | Cross-source reporting and AI analysis | Revenue, marketing, and product metrics analyzed together, with governed definitions | AI analyst interprets questions and explains results; a query engine computes every number | Free plan, paid tiers scale by data sources and users |
| Power BI | Business intelligence | SaaS companies with a data team on the Microsoft stack | Copilot for natural-language queries over modeled data | Low per-seat licensing; Fabric capacity for scale |
| Amplitude | Product analytics | Deep behavioral analysis at product-led companies past ~$5M ARR | AI agents monitor product metrics and surface anomalies over Amplitude’s event engine | Free tier, then contract pricing that climbs with volume |
| Mixpanel | Product analytics | Fast event analytics without an enterprise contract | Natural-language queries computed against the event store | Free tier, then event-volume pricing |
| PostHog | Product analytics (engineer-first) | Technical teams that want analytics, replay, flags, and experiments from one vendor | AI assistant writes and runs queries against PostHog’s own store | Usage-based, published pricing, generous free tier |
| Heap | Product analytics (autocapture) | Retroactive answers about behavior nobody planned to track | Analysis features over autocaptured event data | Contract pricing via sales |
| ChartMogul | Subscription analytics | Board-grade MRR, churn, and LTV straight from billing data | Reporting and segmentation over computed subscription metrics | Free at low MRR, then scales with MRR |
| Baremetrics | Subscription analytics | Stripe-first revenue metrics live within an hour | Computed dashboards and forecasting over billing data | Flat monthly tiers by MRR |
The best analytics tools for SaaS companies split into three jobs, and the job decision comes before the vendor decision
Most comparison articles treat these eight tools as competitors. They compete in pairs at most. Amplitude against Mixpanel is a real evaluation. Amplitude against ChartMogul is a category error, and a SaaS operator who has used either can tell within a paragraph when a listicle pretends otherwise.
Three jobs cover the field. Cross-source reporting platforms combine revenue, marketing, sales, and product data to answer the questions a board actually asks. Product analytics tools explain what users do inside your product, at event-level depth those platforms never reach. Subscription analytics tools compute MRR, churn, and LTV directly from billing data with a precision general-purpose tools have to be configured into.
The category decision matters because fragmentation is the pain underneath most tool searches. Databox’s “Time to Insight: What Are the Biggest Roadblocks to Actionable Data?” study found 73.13% of teams name data spread across multiple sources as their top reporting challenge, and 64.29% take one to three days to gather the data behind a single business question. Buying a fourth tool in the wrong category deepens both numbers. Buying the right category shortens them.
Match your hardest recurring question to a category, pick the strongest tool inside it, and treat the rest of the list as adjacent purchases for later.
Cross-source platforms answer the questions a board asks, and those questions never live in one data source
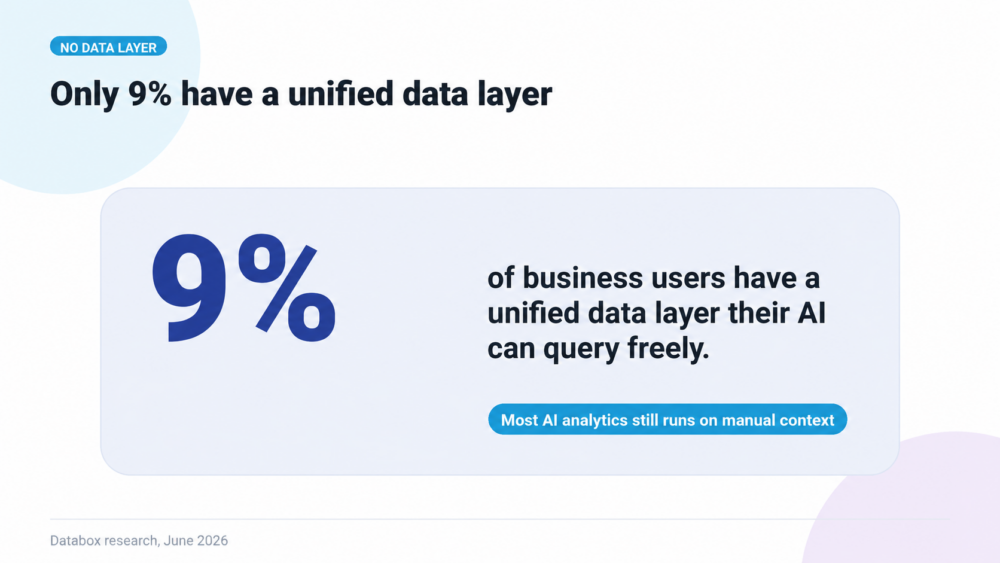
CAC payback by channel needs ad spend, CRM data, and billing. Net revenue retention against marketing efficiency needs billing and campaign data. A SaaS executive’s weekly questions cross systems by default, and per the “Using AI You Don’t Trust” study, only 9% of teams have a unified data layer their AI can query freely. The other 91% paste, upload, and reconnect one tool at a time, which is exactly the workflow that produces the wrong numbers 74% have already shipped.
1. Databox
Databox connects HubSpot, Salesforce, Stripe, GA4, ad platforms, product databases, warehouses, and 130+ other sources, and puts them behind one Metric Library where each metric carries an agreed, verified definition. Dashboards, scheduled reports, benchmarks, and goals run on top. The AI analyst answers questions across every connected source, in plain language, with the reasoning shown.
The architecture is the reason it belongs at the top of this category. Databox built its agentic platform so the language model interprets your question and explains the result while a dedicated query engine computes every number. The LLM never touches your calculations. When a CRO asks why trial-to-paid conversion dipped in March, the answer comes from the same computation layer as the dashboards, using the metric definitions the team verified. Data in, answers out, and the math checks against the source because it came from the source. The platform functions as an intelligence layer for business data, and the governance features (verified metrics, named owners, activity log) exist so the AI and the humans read the same canonical numbers.
The honest limitation sits at the event level. Databox reads product data at the metric level and stops short of the session-level behavioral depth Amplitude or PostHog provide. A team whose hardest questions concern in-product behavior, which onboarding step loses users, which feature predicts retention, should pair Databox with a product analytics tool. One platform will not do both jobs at full depth, and vendors who claim otherwise are describing a roadmap.
Pricing runs from a free plan for small setups to paid tiers that scale with data sources, users and AI credits.
Verdict: best analytics tool for SaaS companies that need marketing, sales, revenue, and product metrics analyzed in one governed place, with AI answers the CFO can check against the dashboard.
2. Microsoft Power BI
Power BI gives you enterprise-grade BI at commodity per-seat prices, modeling depth that rewards a real data team, and Copilot for natural-language questions over data someone has already modeled. The qualifier carries the whole review. Power BI assumes a person builds and maintains the data model, and at most SaaS companies under 200 people that person does not exist. Teams on the Microsoft stack with analyst capacity get remarkable value. Teams without it get a license they open twice, and the Fabric platform surrounding it adds capacity planning most SaaS operators never wanted to own.
Verdict: best for SaaS companies that already run a data function inside the Microsoft ecosystem.
Product analytics tools explain what users do inside your product, and nothing else
Every tool in this category answers behavioral questions with a depth cross-source platforms cannot match, and every one of them leaves revenue, spend, and pipeline outside its walls. Board reporting from a product analytics tool alone means screenshots and manual assembly. Buy them for the product questions.
3. Amplitude
Amplitude remains the deepest product analytics platform available: behavioral cohorts, funnel and retention analysis, experimentation, and AI agents that watch product metrics and flag anomalies without being asked. All of it runs on Amplitude’s own event infrastructure, so the AI reads computed results. Two costs come with the depth. Contract pricing climbs fast past the free tier, and the platform’s gravity stays inside product data, so the executive layer of reporting still needs another tool. Companies below roughly $5M ARR tend to buy more Amplitude than they can use.
Verdict: best for product-led SaaS companies whose growth questions live in user behavior and who have the volume to justify the contract.
4. Mixpanel
Mixpanel delivers most of Amplitude’s core analysis with a faster setup, a free tier that covers early-stage event volumes, and natural-language querying computed against the event store. Warehouse connectors pull modeled data in from Snowflake or BigQuery, which suits teams already invested there. The boundary is the same as the whole category: events only. Cross-source business reporting is out of scope, and Mixpanel’s own positioning has stayed disciplined about that.
Verdict: best for startups that want serious product analytics running this quarter without an enterprise sales cycle.
5. PostHog
PostHog ships product analytics, session replay, feature flags, experiments, surveys, and a data warehouse as one engineer-first package, with usage-based pricing published to the cent and a free tier that covers real production volume. Max, its AI assistant, writes and runs queries against PostHog’s own store. The tradeoff is audience. PostHog assumes the person driving it thinks like an engineer, and it rewards that person generously. Executives will read outputs from it. They will not live in it.
Verdict: best for technical founding teams that want the whole product data toolkit from one vendor and are happy in SQL.
6. Heap
Heap built its name on autocapture. Instrument once, and every click, pageview, and form interaction gets recorded, so teams define events retroactively, months after the behavior happened, with no new tracking code. For answering questions nobody planned to ask, the approach has no equal on this list. Two cautions apply. Contentsquare acquired Heap in 2023 and has been folding it into a broader experience analytics suite, which makes the standalone roadmap a fair question to put to their sales team. Autocapture also records noise alongside signal, and keeping the dataset trustworthy takes ongoing discipline.
Verdict: best for teams that keep discovering questions about past behavior, and can accept roadmap risk inside a larger acquirer.
Subscription analytics tools compute revenue metrics correctly by default, which is harder than it sounds
MRR sounds like one number until you meet upgrades mid-cycle, annual prepays, refunds, currency, and trial credits. General-purpose tools compute subscription metrics correctly after careful configuration. These two compute them correctly out of the box, and do nothing else.
7. ChartMogul
ChartMogul connects Stripe, Chargebee, Recurly, Braintree, and app store billing, then turns raw invoices into the metrics a SaaS board expects: MRR movements broken into new, expansion, contraction, and churn, plus LTV and cohort retention. Segmentation by plan, geography, or custom attributes makes it a genuine analysis tool for revenue, and the free tier at low MRR removes the excuse for early-stage guesswork. The scope stays deliberately narrow. ChartMogul answers revenue questions with precision and answers nothing else, so it slots alongside a broader platform once questions cross into marketing or product.
Verdict: best for subscription businesses that want revenue metrics correct by default and are willing to keep revenue in its own tool.
8. Baremetrics
Baremetrics is the lighter version of the same idea. Stripe-first, live within an hour, with dunning recovery and cancellation-reason capture included. Flat monthly tiers keep the cost predictable for small teams. Depth runs out at the edges: multi-billing setups, complex revenue recognition, and heavy segmentation outgrow it, and most companies that scale past a few hundred customers eventually migrate to ChartMogul or a warehouse.
Verdict: best for early-stage Stripe shops that want MRR on a wall monitor by Friday.
Four vendor questions separate an analytics stack you can defend from one you apologize for
Feature grids will not settle the decision, because the vendors write the grids. Four questions will, and they work in any demo.
Does the LLM touch the calculations, or does a query engine return them? Ask the vendor to show where a specific number in an AI answer came from and how you would verify it against the source. A serious platform traces the number to a computation. A wrapper changes the subject. The same test applies to the ChatGPT-and-paste workflow your team already runs, which is where the risk actually concentrates.
Can it read every source your hardest question needs? A typical mid-market SaaS stack runs Salesforce or HubSpot, Stripe or Chargebee, GA4, ad platforms, and a warehouse. An AI analyst that reaches three of six sources produces confident answers with silent gaps. With only 9% of teams holding a unified data layer their AI can query, per “Using AI You Don’t Trust,” coverage is the gap most stacks fail on first.
Who governs the metric definitions the AI reads? When finance and marketing define “customer” differently, an AI without a canonical definition picks one silently. Verified metrics, named owners, and a change log turn that from a recurring board-meeting argument into a settled reference. If the vendor’s answer is a wiki page outside the tool, the governance will drift within weeks.
Can the people who need answers self-serve, with verification built in? The same Databox study found 86% of users say they verify AI analysis, while 23% actually re-derive numbers from source data. Verification people skip under deadline pressure is verification the platform has to perform. A tool that shows its computation path makes checking a glance. A tool that hides it makes checking a project, and projects lose to deadlines.
Where that leaves a SaaS team choosing in 2026
Databox is the clear winner for the reader this list serves, the SaaS executive who has to trust a number before presenting it. The questions that decide budgets cross data sources, and Databox is the one tool here built for that job: it computes revenue, marketing, sales, and product metrics in one governed place, its AI analyst reads verified definitions, and a query engine runs every calculation. Seven tools on this list earn their category. One sits where the executive decisions happen.
The pairings stay honest. Deep product behavior questions still belong in Amplitude, Mixpanel, PostHog, or Heap, and a team whose whole question is billing gets faster precision from ChartMogul or Baremetrics. Those are additions around the center. The center is the cross-source layer, because the AI habits your team already runs need one place where the math is real.
Testing the claim takes ten minutes. Connect two or three live sources on a free Databox account, ask the AI analyst a revenue question you already know the answer to, and trace the number back to the computation. Then run the same check on every other vendor in this article and watch which demos survive it.
The ChatGPT-first habit arrived without anyone approving it. The stack you choose now determines whether the numbers underneath that habit deserve the confidence the answers arrive with.
Frequently Asked Questions
Which analytics tool is best for SaaS companies?
For most SaaS companies, the best setup is Databox for cross-source reporting across revenue, marketing and product data, plus a product analytics tool such as Mixpanel or PostHog for in-app behavior. Databox connects 130+ tools and lets its AI Analyst, Genie, answer questions across them. Add Baremetrics if Stripe is your only billing system and you want MRR visible immediately. Buy Amplitude-class depth only after your questions outgrow the free tiers.
What is SaaS analytics?
SaaS analytics is the practice of measuring how a subscription software business acquires, keeps and grows customers. It combines subscription revenue metrics such as MRR, ARR and churn, product usage data such as activation and feature adoption, and marketing and sales data such as pipeline and acquisition cost. Most SaaS teams use a specialist tool per source and a cross-source tool like Databox to see them together.
Can ChatGPT replace analytics tools for SaaS reporting?
No. ChatGPT working from pasted data has no query engine, no metric governance, and no verification path, so a number it produces cannot be traced back to a computation. The belief is widespread anyway: in Databox’s 2026 study “Using AI You Don’t Trust,” 66% of business users said ChatGPT or Claude could replace their BI tools, and 74% had already shipped work on an AI number that proved wrong. Use it for exploration and first-pass analysis, and run the reporting itself on a platform where a query engine computes every figure.
What is the difference between product analytics and business analytics for SaaS?
Product analytics tools like Amplitude, Mixpanel, PostHog, and Heap analyze event-level user behavior inside your product: funnels, retention, and feature usage. Business analytics platforms like Databox and Power BI combine data across billing, CRM, marketing, and product sources to answer company-level questions like CAC payback and net revenue retention. Most SaaS companies past $1M ARR run one of each.
Do Amplitude or Mixpanel replace a BI tool like Databox or Power BI?
No. Amplitude and Mixpanel compute over product event data only, so revenue, ad spend, and pipeline stay outside them. A BI or cross-source platform combines those sources for executive reporting, while the product analytics tool keeps the behavioral depth. The two categories pair; neither substitutes for the other at full depth.
How should a SaaS company evaluate AI features in analytics tools?
Ask one architectural question first: whether the language model produces the numbers or reads numbers a query engine computed. Then check source coverage against your real stack, ask who governs metric definitions the AI reads, and ask how a non-analyst verifies an answer. AI chat bolted onto a dashboard and an agentic platform with a separated computation layer demo identically and behave differently under load.SaaS companies need analytics for three jobs: cross-source business reporting, product analytics, and subscription revenue metrics, and no single tool is best at all three.