")
Table of contents
50+ platform-specific questions drawn from the Databox Prompt Library, plus the framework that separates answers you can act on from answers that sound right.
TL;DR
- Most AI questions about marketing data fail because they lack three ingredients: a time window, a named metric, and a comparison baseline — not because the AI is incapable.
- In Databox’s “Time to Insight” survey of 66 marketing and analytics teams, 64% said answering a basic business question typically takes one to three days. The bottleneck is almost never the tool. It is the question.
- Platform-specific questions produce platform-specific decisions. Cross-platform questions, like connecting GA4 traffic behavior to HubSpot pipeline outcomes to Google Ads spend, produce the decisions that actually move revenue. Most teams never get there because they stop at the per-platform view.
- Every question in this article comes from the Databox Prompt Library, organized by integration and ready to copy. Every prompt is built with all three ingredients already present.
Introduction
Monday morning. A Director of Demand Gen spots a 20% drop in MQLs from the previous week. The analyst queue is two days deep. The paid media team wants a campaign decision by noon.
She screenshots her Google Ads dashboard, pastes it into ChatGPT, and asks: “Which of these campaigns should I pause?”
The model answers immediately:
campaign names, reasoning, and a recommendation. It sounds like an analyst. She acts on it.
What she does not know: the screenshot clipped the date range. The ROAS figures are from the wrong period. The campaign the model flagged for pausing was actually her highest converter last week. The model had no way to know that. It answered from what it could see, filled the gaps it could not, and delivered the result with complete confidence.
Getting an answer from AI is easy. Getting an answer you can trust is a different problem entirely.
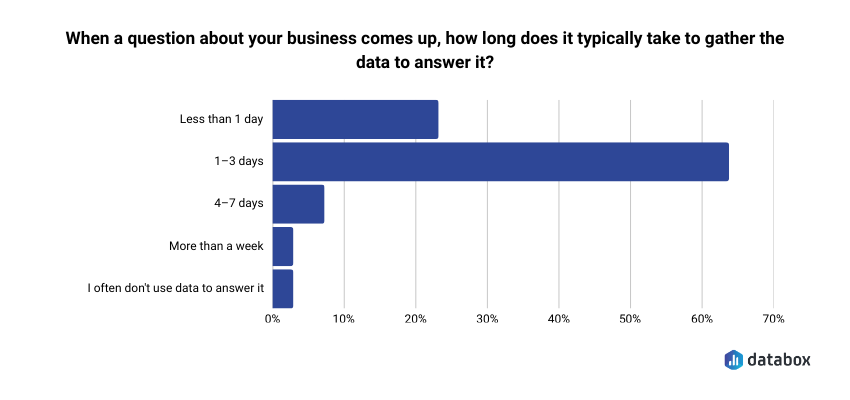
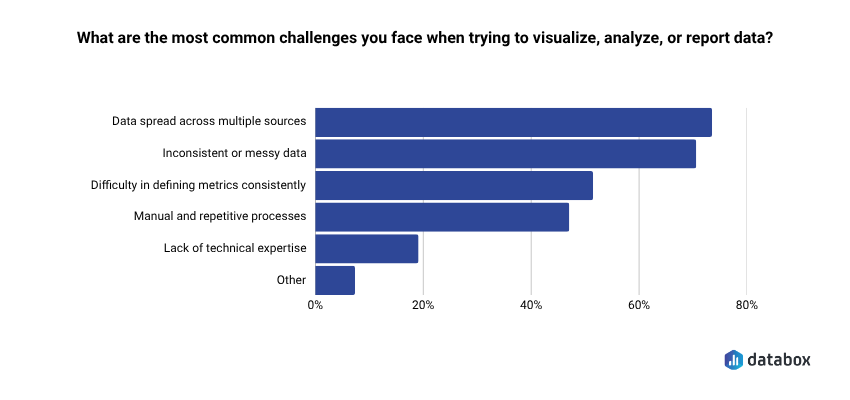
Databox’s Time to Insight survey of 66 marketing and analytics teams found that 64% say gathering data to answer a basic business question typically takes one to three days, and 73% name data spread across multiple sources as their top reporting challenge. The answer to both is not to paste more screenshots; it is to ask questions specific enough that the model has nothing left to interpret or invent.
That is what the question bank in this article is for. Every prompt below comes from the Databox Prompt Library — free to use, organized by platform, built with the three-ingredient framework already applied. The cross-platform questions near the end are where the most valuable decisions live.
Weak questions hand the interpretation to the model; strong ones keep it with you
The difference between a question that produces an answer worth acting on and one that produces a confident-sounding guess is not sophistication. It is three missing ingredients.
A time window. Last 30 days, this quarter vs. last quarter, the past eight weeks. Without one, the model picks one. You do not know which.
A named metric. ROAS, MQL-to-SQL rate, cost per conversion, click-to-open rate. “Performance” is not a metric. Name the number you need.
A comparison baseline. Vs. target, vs. prior period, vs. a different campaign. A metric without a baseline is a number without meaning.
Compare these two questions directly:
Weak: “How are our email campaigns doing?”
Strong: “What is the click-to-open rate trend for my weekly newsletter over the past eight weeks, and which send week had the steepest drop?”
The strong version removes every assumption the model would otherwise make. It also tells you exactly what decision it feeds, whether to change the subject line, the send time, or the list segment. That decision frame is the fourth element worth adding: an implicit “so I can decide…” that keeps the answer operational rather than exploratory.
The model fills every gap in a vague question with an assumption it does not disclose. A specific question removes the gaps, which is why specific questions also produce more reliable answers, not just more useful ones.
Every question in the Databox Prompt Library is built with all three ingredients present. That is why the prompts return answers you can take to a meeting rather than answers you need to qualify first. The sections below pull directly from that library. Start with the platform where your highest-stakes decision lives this week. The cross-platform section at the end is where the biggest decisions hide.
HubSpot questions that surface pipeline problems before the quarterly review does
HubSpot connects marketing activity to revenue outcome more directly than any other platform in a marketing stack. The questions worth asking are not the ones that count leads; they are the ones that reveal whether leads become pipeline and where the handoff to sales quietly breaks.
MQL volume without conversion context is the most common vanity metric in marketing reporting. A campaign generating 500 MQLs at a 3% MQL-to-SQL rate is losing to a campaign generating 200 MQLs at 15% and most teams discover that in a pipeline review after the quarter closes, not in time to do anything about it.
On lead generation and pipeline:
- “How many new contacts did we generate this month, and which sources are producing the most leads?”
- “How many deals were created this month, and how does that compare to last month and our target?”
- “What is the current total value of our open pipeline, broken down by stage?”
- “How many deals did we lose this month, and at which pipeline stage are we losing the most deals?”
- “Which sales reps have the highest closed-won revenue this quarter, and which are behind pace?”
- “How has our closed won amount trended over the last six months?”
- “What is our average time to close a deal, and how does that vary by pipeline?”
On email and nurture performance:
An unsubscribe spike at email seven in a nurture sequence signals list fatigue. A spike at email two means the audience does not belong in the sequence at all. The number looks the same in both cases. The position tells you which problem you have and which fix to reach for.
- “What is the open rate and click rate for our email campaigns this month, and which campaigns are performing best?”
- “How many new email subscribers did we add this month, and how does that compare to last month?”
On sales-marketing alignment:
“Which marketing campaigns are generating contacts that sales is not engaging within 48 hours?” is the question neither team wants to own in a review, which is exactly why it matters. Pair it with pipeline stage drop-off data and you can name the specific breakdown point instead of pointing at the general gap between teams.
- “Which pipeline has the highest win rate, and which has the most deals stalling in early stages?”
- “Which paid social sources are driving the most website sessions?”
GA4 questions that get past session counts to the behavior that predicts conversion
The gap between traffic data and conversion insight is where most marketing analytics stalls. Session counts tell you how many people arrived. They do not tell you why traffic is not converting or which content moves people toward a form, and those are the questions that feed actual decisions.
Databox’s “Time to Insight” survey found that 62% of marketing teams want to make data more accessible to non-technical users.
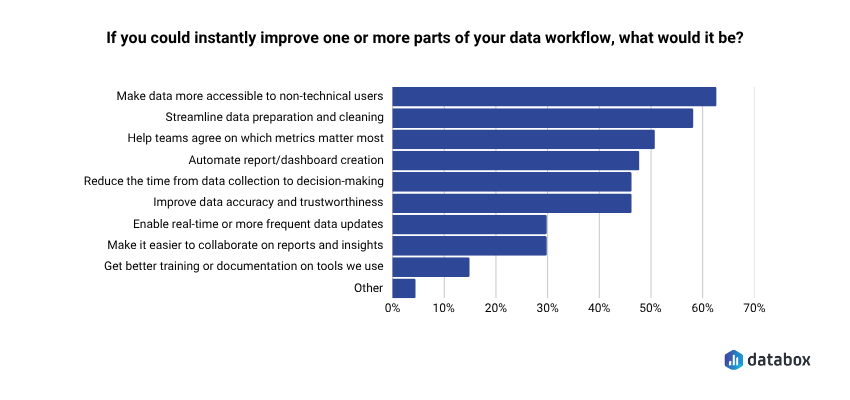
Better GA4 questions are one of the most direct routes there. A marketing manager who has never written a query can ask “which pages are generating the most conversions, and what is the conversion rate for each?” in plain language and get a precise answer; no SQL, no analyst queue, no two-day wait for a number that should take sixty seconds.
On traffic and acquisition:
- “Which traffic sources drove the most sessions last month, and how has that mix shifted compared to the previous month?”
- “How has our organic search sessions trended over the last 90 days?”
- “How do mobile users compare to desktop users in terms of sessions, engagement rate, and average session duration?”
- “What are our top pages by views over the last 30 days, and how do those views compare to the prior period?”
- “Which pages have seen the biggest drop in clicks or impressions recently?”
- “How has our average position changed over the last six months?”
On behavior and engagement:
“Which blog posts have the highest engagement rate but the lowest conversion rate?” is one of the most useful diagnostic questions in content marketing. The follow-up that makes it actionable: “What is the average scroll depth on those posts, and do they have a CTA above the fold?” High engagement with low conversion almost always points to a broken conversion path, not bad content. Scroll depth tells you whether readers ever reach the ask.
On conversion performance:
When organic traffic rises 15% and form submissions stay flat, the real question is not “why is traffic up?” It is “which pages received that traffic, and are any of them conversion pages?” Traffic growing on informational content while conversion pages stagnate means the wrong audience is arriving, or arriving in the wrong place.
- “Which pages are generating the most conversions, and what is the conversion rate for each?”
- “How has our total impressions and clicks from organic search changed over the last 90 days?”
Google Ads questions that separate productive spend from spend that just looks active
Budget misallocation in Google Ads compounds weekly. A campaign draining spend on irrelevant search terms or starving its best-converting ad groups does not announce itself in a dashboard. The numbers show activity. The questions below find what that activity is actually producing.
On spend and efficiency:
“Which campaigns exceeded their daily budget more than three times last week?” becomes a real decision when you add: “And which of those had a conversion rate above target?” Overspending on a high-converting campaign is a signal to raise the budget ceiling. Overspending on a low-converting campaign is a waste that aggregate reporting obscures. One question separates them.
- “What is our overall conversion rate and cost per conversion this month compared to last month?”
- “Which campaigns are generating the most conversions, and which have the highest cost per conversion?”
- “What is our search impression share this month, and where are we losing share to budget versus rank?”
- “How has our average CPC changed over the last quarter, and which campaigns are driving the increase?”
- “How has our click-through rate trended over the last 90 days, and which campaigns are dragging it down?”
- “How do our link click rates compare across campaigns, and which have dropped significantly?”
On keyword and creative performance:
Most accounts bleed budget to search terms that no one has added to the negative keyword list. “Which keywords are driving the most conversion value, and which are consuming budget with low results?” run monthly surfaces that gap faster than any manual audit and make the conversation with a paid media agency considerably more specific.
On budget allocation:
High-performing campaigns that could scale but are not getting budget are the most common missed opportunity in paid search. A quarterly audit catches them after the quarter has run. A weekly question catches them while there is still budget to reallocate.
- “Which campaigns have the lowest CPM, and which are getting the most efficient reach?”
- “Which individual ads have the highest purchase ROAS, and which are overspending relative to results?”
- “What is our total spend this month, and which campaigns are accounting for the largest share?”
Cross-platform questions are where the decisions that move revenue actually live
Every section above produces answers within a single platform. But the decisions that actually move revenue, whether to shift budget from paid to organic, whether traffic growth is building pipeline or inflating a dashboard number, whether a 20% spend increase bought proportional pipeline growth, require connecting data across all three.
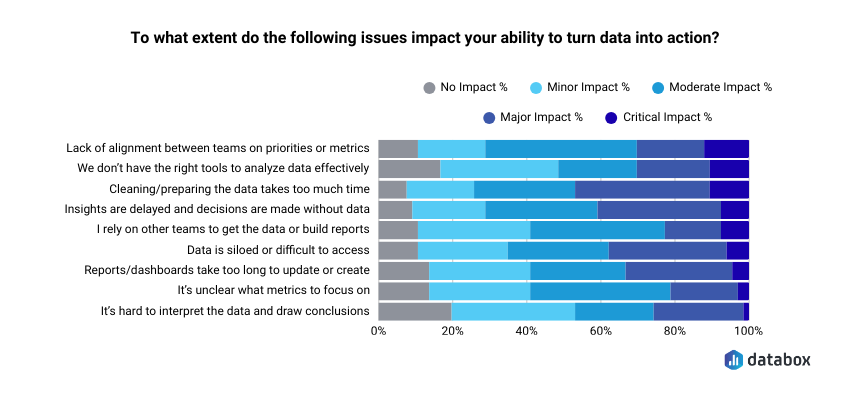
Most teams never get there. Not because the questions are hard to ask, but because pulling from three dashboards, reconciling the numbers by hand, and arriving at a single defensible answer takes longer than the meeting where the decision gets made. Databox’s Time to Insight survey found that roughly seven in ten respondents said delayed insights and time spent preparing data meaningfully get in the way of turning data into action.
Cross-platform analysis is not an exotic analytics capability. It is the most common reporting bottleneck and the one with the highest cost when it goes unresolved.
The questions most teams leave on the table:
“My GA4 organic traffic is up 18% this month, but HubSpot form submissions are flat. Which pages are receiving the organic traffic increase, and are any of them conversion pages?” Traffic growing while conversions stay flat almost always means informational pages are capturing the gains while conversion pages see nothing. Per-platform reporting makes both numbers look fine. Cross-platform questioning shows the gap.
“Which Google Ads campaigns drove the most HubSpot contacts that reached SQL stage within 45 days?” Lead volume from paid channels is a vanity metric without pipeline velocity behind it. One question closes that gap.
“My Google Ads spend increased 20% last quarter. Did pipeline from paid channels increase proportionally in HubSpot?” If spend is up and pipeline is not, the money went to the wrong campaigns or the attribution model is covering for it.
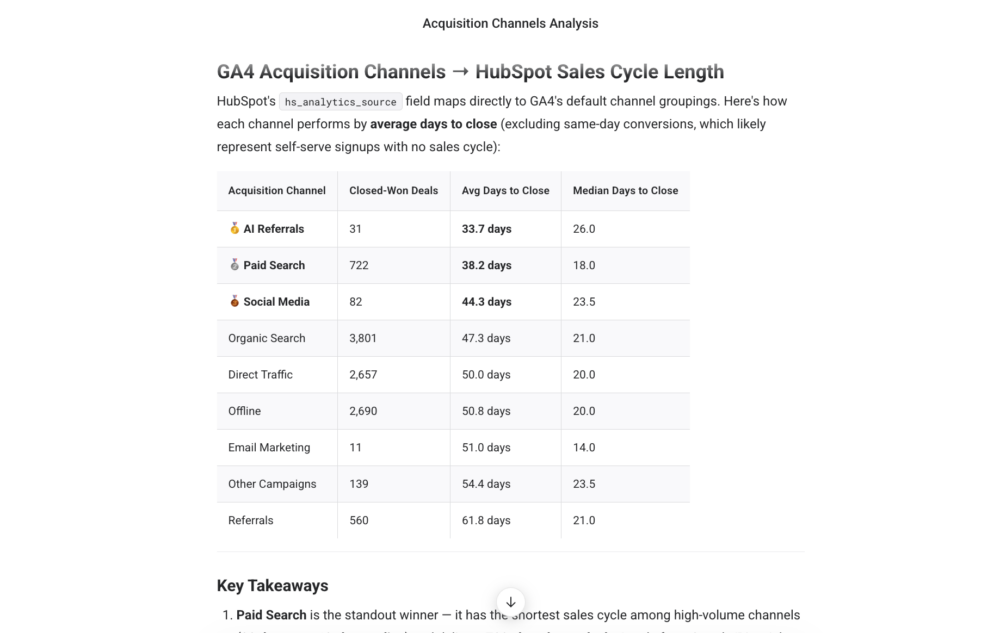
“Which acquisition channels in GA4 are producing the leads in HubSpot with the shortest sales cycle?” Speed to close is often a sharper channel quality signal than volume, and it is almost never visible inside a single platform.
“Across all paid channels, which has the lowest cost per HubSpot MQL this quarter?” Not cost per click. Not cost per conversion event. Cost per actual lead in the CRM — the number that connects ad spend to pipeline.
If you want to run any of these cross-platform questions against your live data without stitching exports together manually, Genie handles them directly, which is worth knowing when the decision has a noon deadline and the analyst queue is two days deep.
The question is the fastest lever you control
In Databox’s Leveraging AI for Business Growth survey 89% reported actively implementing AI in business operations. The gap between teams that get useful answers and teams that generate confident-sounding noise almost never comes down to which AI tool they chose. It comes down to whether they asked a question with all three ingredients: time window, named metric, comparison baseline, or handed the interpretation to the model.
Fixing the question is the fastest lever a marketer controls today. Faster than switching tools. Faster than waiting on an analyst. Faster than a data infrastructure project that will take quarters.
Every question in this article is available in the Databox Prompt Library — organized by platform, filterable by department, and built with all three ingredients already present. Start with the two or three questions that cover your highest-stakes weekly decisions. Refine the time window and baseline to match your reporting cadence. Add the “so I can decide…” frame.
The model handles the retrieval. The decision stays with you.
Browse the full Prompt Library →
Frequently Asked Questions
What makes a marketing data question strong enough to get an AI answer worth acting on?
Every strong marketing AI question has three components: a time window (last 30 days, this quarter vs. last quarter), a named metric (ROAS, MQL-to-SQL rate, cost per conversion), and a comparison baseline (vs. target, vs. prior period, vs. another campaign). Without all three, the model fills the gaps with assumptions it does not disclose. A useful test: read the question back and ask whether the model needs to make any assumptions to answer it. If it does, add specificity until the assumptions disappear.
Why do cross-platform questions produce better marketing insights than single-platform ones?
Single-platform questions answer single-platform questions. “Which GA4 pages get the most traffic?” tells you about traffic. “Which pages get the most traffic but generate zero HubSpot form submissions?” tells you where the conversion path is broken. The insight lives in the gap between platforms — and a question that crosses both surfaces it in one pass instead of two hours of manual reconciliation. Most revenue-affecting decisions in marketing live at exactly that intersection.
What causes AI to give a confident but wrong answer about marketing data?
A confident wrong answer almost always traces back to incomplete input — a clipped screenshot, a stale export, a date range the model could not verify. The model fills every gap with an assumption it does not flag. Specific questions reduce those gaps. But even a specific question fails if the data behind it is incomplete. The question is your responsibility. The data connection is where the tool earns its place.
How specific should a marketing AI question be?
As specific as the decision it needs to feed. “How are our ads doing?” invites the model to decide what matters. “Which Google Ads campaigns had a cost per conversion above $80 this month, and how does that compare to last month?” leaves nothing to interpret. The Databox Prompt Library builds this level of specificity into every prompt by default — time window, named metric, and comparison baseline are all present before you copy and paste.
What is the Databox Prompt Library and how is it different from writing prompts yourself?
The Databox Prompt Library is a free bank of 100+ plain-language questions organized by integration and department, covering HubSpot, GA4, Google Ads, Facebook Ads, LinkedIn Ads, and 16 other data sources. Every prompt is built with a time window, a named metric, and a comparison baseline already present — meaning they return operational answers without revision. Browse by data source, copy any prompt, and run it in whatever AI tool you have connected to your data. Available at databox.com/prompt-library.
Can I use these questions in tools other than Databox?
Yes. The three-ingredient framework applies regardless of which AI tool you use. The prompts in the Databox Prompt Library work in any AI interface connected to your live marketing data. What changes between tools is not the question — it is how fresh and reliable the answer is. A question run against live, connected data returns a fact. The same question run against last week’s export returns an inference. The question is your responsibility. The data connection is where the tool earns its place.