


Table of contents
Many folks who manage data as part of their jobs wish they could perform better reporting. When we asked 59 data pros about their reporting processes, nearly 37% told us they could do better.

If you consider yourself in that boat, what can you do to improve your reporting process?
We consulted those same experts, including the 63% happy with their reporting, about their experiences. They shared their reporting approaches, how frequently they report, what they’ve done to improve their processes, and the mistakes they recommend avoiding.
Here’s how we’ll break it down:
- What Does a Company’s Typical Reporting Process Look Like?
- How Often Do Companies Report on Their Performance?
- 5 Ways to Improve Your Reporting Performance
- 5 Mistakes to Avoid When Performance Reporting

What Does a Company’s Typical Reporting Process Look Like?
Four of the most common ways for companies to report data are:
- Using reporting software: Reporting software automatically brings data together from all sources. So, the reporter can generate real-time dashboards and reports to show key performance indicators (KPIs) to teammates.
- Taking screengrabs from multiple tools: Marketing tools tend to have their own in-app analytics, but the reporter needs to pull that information together themselves. They take screengrabs of each tools’ tables and charts, then paste them into a unified document.
- Collecting data from multiple tools in one spreadsheet: This method works similarly to the previous, except instead of using screengrabs, the reporter directly pulls data from each tool and puts it into a spreadsheet. Then, they make charts and tables based on that integrated data.
- Using individual tools only: Reporters who follow this method open each tool individually and show their charts and tables in meetings. They don’t create any report documents.

When we asked professionals about their reporting processes, almost 68% stated they use the first method — reporting through specialized reporting software. Less than a quarter of respondents each used any of the other methods, with nearly none of them using individual tools only.
In sum, for our respondents, more unified data is better.
How Often Do Companies Report on Their Performance?
The frequency at which a company reports on data depends on the type of data itself.

Interactions with customers were the most important topics for the professionals we consulted to report on. At least half of them report on sales, marketing, or customer success daily or weekly. All respondents report on marketing on at least a quarterly basis. According to Databox’s State of business reporting, Marketing, Sales and Finance are the most monitored and reported operations for performance.
Meanwhile, around a quarter to a third of respondents report daily on internal subjects like finance, HR, operations, and business. HR had the most instances of professionals reporting infrequently or never.
So, what do these patterns mean for your reporting habits? Consider reporting on the topics most important topics at least monthly or quarterly. If you’re focusing on growing your business, sales, marketing, and customer success will be the most important areas to report on.
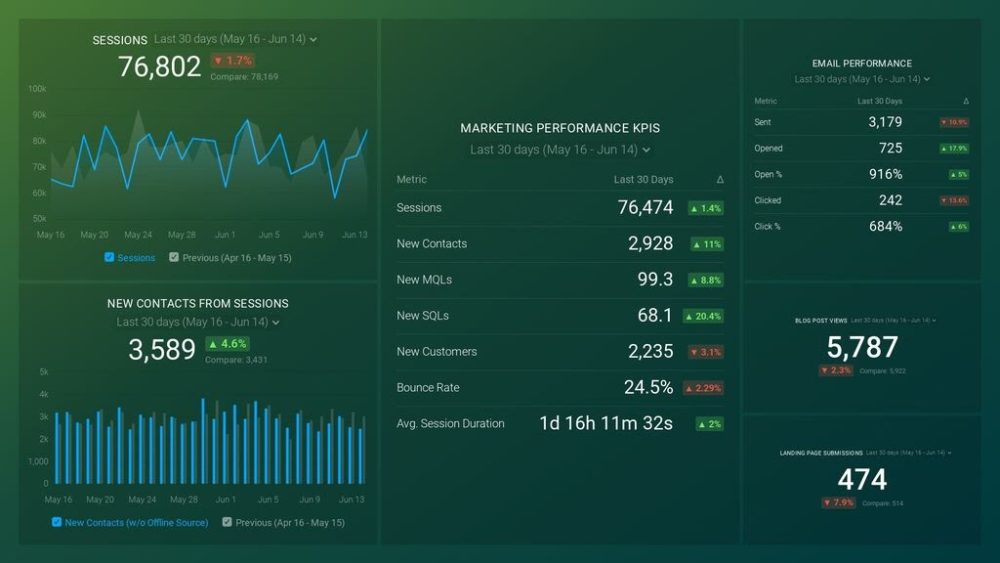
PRO TIP: How Well Are Your Marketing KPIs Performing?
Like most marketers and marketing managers, you want to know how well your efforts are translating into results each month. How much traffic and new contact conversions do you get? How many new contacts do you get from organic sessions? How are your email campaigns performing? How well are your landing pages converting? You might have to scramble to put all of this together in a single report, but now you can have it all at your fingertips in a single Databox dashboard.
Our Marketing Overview Dashboard includes data from Google Analytics 4 and HubSpot Marketing with key performance metrics like:
- Sessions. The number of sessions can tell you how many times people are returning to your website. Obviously, the higher the better.
- New Contacts from Sessions. How well is your campaign driving new contacts and customers?
- Marketing Performance KPIs. Tracking the number of MQLs, SQLs, New Contacts and similar will help you identify how your marketing efforts contribute to sales.
- Email Performance. Measure the success of your email campaigns from HubSpot. Keep an eye on your most important email marketing metrics such as number of sent emails, number of opened emails, open rate, email click-through rate, and more.
- Blog Posts and Landing Pages. How many people have viewed your blog recently? How well are your landing pages performing?
Now you can benefit from the experience of our Google Analytics and HubSpot Marketing experts through a plug-and-play Databox template. It includes key metrics for tracking your leads and can be used as a standalone dashboard or as part of your marketing reports. You can try it during your free trial no setup headaches.
You can easily set it up in just a few clicks – no coding required.
To set up the dashboard, follow these 3 simple steps:
Step 1: Get the template
Step 2: Connect your HubSpot and Google Analytics 4 accounts with Databox.
Step 3: Watch your dashboard populate in seconds.
5 Ways to Improve Your Reporting Performance
To ensure the accuracy of your report, learn how to improve your reporting process. The data experts we surveyed had these five tips to share:
- Establish a Consistent Reporting Schedule
- Work on Your Data Visualization
- Automate Your Data Collection
- Start With Some Goal Metrics
- Centralize Your Data
1. Establish a Consistent Reporting Schedule
If you keep on putting off reporting, your first step might not be to decide how often to report. Instead, you may want to aim for any kind of consistent reporting schedule, whether it’s every quarter or every week.
ClearPivot’s Hannah Buchholz names consistency the most helpful tactic for improving reporting. “If I don’t look monthly at our reporting tools with my clients, it’s easily the first thing to go. So, I keep better reports when I know it’s always going to be part of my monthly things to talk about with clients,” Buchholz explains.
Avinash Chandra of BrandLoom points out how consistent reports contribute to better reporting in the future: “Regular and accurate reporting is crucial to business success because it helps develop future forecasts, marketing plans, guide budget planning, and improve decision-making, enabling any business to make better business decisions, project future results, and drive improvements.”
Having trouble getting a regular reporting schedule together? Go for consistency over perfection. If monthly reporting feels like too much right now, for example, start with quarterly reporting.
2. Work on Your Data Visualization
Do you put your data in a chart and call it a day, or do you have a visualization goal in mind? Visualizing your data with purpose will help you get better insights from it.
Consider putting your data in historical context, as Navarro Paving’s Sonia Navarro does. “Storytelling through visual data is the most effective thing I’ve done to improve my reporting process. What this means is providing data that focuses more on the content, factors, and reasons behind the data gathered,” Navarro says.
Navarro offers examples, explaining, “ Presenting data with the help of historical data and time durations helped me compare data differing from quarter to quarter. Connecting KPIs and metrics by displaying variables such as email signups, revenue and ROI helped deduce the revenue across all departments.”
ClothingRIC’s Chris Nddie highlights that sometimes, all you need is a good tool to do the heavy lifting for you. “Even the most reliable of data is of no use if its visualization is not simple, unambiguous, and easy to understand. Fortunately, the business intelligence dashboards in modern reporting software make this task achievable. They create an accurate visualization of the most important metrics and data so that no one would have trouble analyzing them,” Nddie says.
The ClothingRIC team’s BI tool has done wonders for their data visualization. Nddie concludes, “Ever since taking care of the presentation side of things, there have been no instances of misinterpretation of data in our organization. As a result, we have reduced the time required to make decisions and our productivity has improved a great deal.”
Read our primer on data visualization for more tips on making stellar charts, tables, and graphs.
3. Automate Your Data Collection
One of the most common data quality issues in reporting is human error. Automated data collection tools copy data over exactly as it appears in its original source, helping you reduce mistyped numbers. Plus, it saves you time that you could spend on more detailed analysis.
“Automating the ways in which I collect data was the biggest improvement I made in my reporting process,” Liz Hutz from Cash Home Buyers affirms. “ I was guilty of tracking different metrics through traditional strategies. This was extremely time-consuming, and I could never focus on things that were actually important. This additional burden of collecting data, verifying its credibility, and then creating a report was too much for me to handle.”
Hutz continues, “So, to overcome this problem, I began using business intelligence and data analytics dashboard tools to automate data collection. I even integrated operational and financial information into one database. This reduced my company’s reporting time and human errors and increased overall accuracy.”
4. Start With Some Goal Metrics
With so many metrics available to track in your favorite data tools, it can be easy to forget why you’re analyzing data in the first place. Choose the goal metrics you want to track based on your KPIs, then keep your reports related to those metrics.
Lupo Digital’s Glenn Miller keeps client data in focus by asking them one simple question. “The one most effective thing we’ve done to improve our reporting process is changing the very start of our process, by seeking absolute clarity from stakeholders requiring the reports, to isolate each specific metric they require. Moreover, what improved our process is how we do this. We literally ask each stakeholder regardless of management or level of role: ‘If you were staring at a blank piece of paper with a list of the utopia key metrics you wanted reported, what are they?’” Miller says.
“We then apply a process of reverse engineering to produce the required reporting aligned to output that list of metrics. Usually, we result in additional key metrics leading to the stakeholder’s wishlist of metrics, that were not expected and almost in all cases a value-add in the process. With an ocean of available data to report on, this approach has vastly improved our efficiency, productivity, and professionalism, when it comes to reporting,” Miller concludes.
5. Centralize Your Data
The most popular strategy for improving reporting among respondents is keeping all their data in one tool. A centralized data source helps these respondents keep their reporting efficient and accurate.
“One thing that our company has done to improve reporting is centralizing all of our data to ensure we are working from a single source,” says Bryan Philips of In Motion Marketing. “By storing every element of data in one place, our team can collaborate in a much more effective way. Having one source of data for our reporting is also extremely helpful when filing because we can easily and accurately address when figures change. Additionally, retrieving our data from one source reduces the risk of error and inconsistencies.”
Wethrift’s Nick Drewe recounts a similar experience, adding, “Consolidating relevant and accurate data into a single system is the single best thing we’ve done for our reporting process. Choosing a central hub for all reporting activities ensures that no meaningful data is missed in an attempt to consolidate things at the last minute.”
“The beautiful thing about software is that it also has the capability to automate the creation and sending of reports, taking the manual tedium out of it and allowing you to focus your energy elsewhere. Of course, these systems aren’t magic, and you have to put a lot of work into ensuring your data is accurate and that you’re curating it in a meaningful way, but implementing software can make company-wide reporting a far simpler, more effective process,” Drewe concludes.
For Siva Mahesh of Dreamshala, the benefits of data centralization come from using a Google Analytics reporting tool. “Using a single dashboard to show data helps improve my reporting process. This way, I don’t have to switch from one platform to another when presenting information, which could be both time-consuming and distracting — for me as the speaker, and my listeners,” Mahesh tells us.
Mahesh continues, “A single dashboard allows me to present charts and graphs — which are key elements in reporting, especially when presenting key metrics like clicks, page views, and number of shares, among many for content marketing reports, Likewise, an actionable dashboard can be shared in two ways — either flashed on screen for everyone to see or shared personally with each team member who has the option to go back and forth each information as necessary.”
5 Mistakes to Avoid When Performance Reporting
Now that you know what good reporting habits look like, how about bad ones? These pitfalls could be bringing your report quality down:
- Reporting Without a Strategy
- Measuring Too Many Metrics
- Not Standardizing Your Reports
- Reporting the Same Way to Different People
- Avoiding Automation
1. Reporting Without a Strategy
Just as you should report with goal metrics in mind, you should also build reports with an analytics strategy. You should have reporting goals in place that line up with your overall business goals.
As Remotish’s Adam Stahl puts it, “One of the biggest mistakes a company can make with its reporting process is not having a goal for each report or dashboard that is relevant to their larger business goals. At previous clients, I have seen that lead to over-crowded dashboards with dozens of reports or reports that are so stuffed with different metrics that the value of that report is greatly diminished.”
Stahl explains using a metaphor, “In some ways, going to report on your collected data without a goal or strategy can be like stepping up to a buffet with your empty plate in hand. There are likely loads of appetizing foods offered up at the different stations but you may be unable to decide where to start. Or alternatively, you fill your plate with some of the first options you see and are left too full to eat anymore when you spy a dish you didn’t realize was an option but now really want.”
“By starting off with a goal or strategy in mind, especially one that ties into larger business-wide goals, you’ll have a clearer picture of exactly the data you want to report on, what trends you’re looking to monitor, and how to efficiently build those reports so you’re getting only the most relative information to that goal,” Stahl concludes.
2. Measuring Too Many Metrics
It can be tempting to track as many metrics as you can, especially when you have data centralization tools available. Or, you put too many metrics in your report for it to be understandable. Regardless of the reason, excess metrics can get in the way of quality reporting.
“If you have a complicated dashboard or presenting on various metrics and data, it could be too much detail for the reader,” Sam Cohen of Gold Tree Consulting says. Either the reader is going to dump the report because of too much information or get lost into tiny details which don’t even matter.”
Cohen adds, “The information overload in the report can be overwhelming. It can draw away the attention of the reader from the actual matter. Moreover, it is not a good idea to add irrelevant metrics because this way the analyst will not be able to draw enough insights from the report.”
“Too much detail hides the insights,” Jonathan Zacks of GoReminders affirms. “ If the report is full of statistics and figures, it is too easy to lose track of the reason for the report. Your report should be giving you a clear picture of the health of the business and provide a solid base for decision making. Don’t allow the report to conceal the information you need to guide you through the decision-making process”
Nigel Adams of Nigel Adams Digital reminds us that some of these extra metrics can be vanity metrics with no impact on performance. “Having worked with lots of different businesses on PPC and SEO over the years, I’ve noticed that there is ALWAYS one common reporting mistake that is made… Businesses will spend way too much time analyzing vanity metrics! STOP! Especially if you’re a small business. This can result in lots of wasted budgets and a big downward spiral in ROI. Clicks mean nothing if they aren’t converting at the end of the day!” Adams asserts.
3. Not Standardizing Your Reports
Put yourself in your reporting recipient’s shoes. Imagine getting a report with different formatting and information order every month. You’d have a hard time finding the data you need, right?
Kind House Buyers’ Keith Sant highlights how this issue can happen when you use different templates every month. “One of the biggest mistakes I’ve seen companies make in their reporting process is not standardizing the report template. Reports of all kinds must have a set template to be followed every time,” Sant says.
Sant elaborates, “When you present a report with a different template every time, the reader will have difficulty finding specific information from the report. With a standardized template, they can quickly jump to the section they need the most without wasting time or effort.”
This problem can happen if you change any major aspect of your report’s design, not just the template alone. Constantly changing chart styles or formatting can also throw off the reader.
When in doubt, go for a dashboard instead of a traditional report. Dashboards always present data consistently so you don’t have to worry about formatting.
4. Reporting the Same Way to Different People
While you should present your data consistently in every report, you should also customize your reporting for the people you plan to share it with.
Erik Norsted from Olive & Company puts it like this: “The biggest mistake a company can make with reporting is assuming that all audiences are looking for the same kind of information presented in the same way. At a minimum, you should distinguish between executive-level reporting, management-level reporting, and contributor-level reporting. The KPIs, data visualizations, insights, and report format should all be tailored to align with the perspectives and questions of each unique audience.”
In other words, colleagues from different parts of your business will focus on different aspects of your report. Think of how to prioritize your data for each audience and format your report accordingly. Then, keep that format consistent moving forward to achieve the best of both worlds.
For more tips on building a reporting strategy for multiple audiences, read our guide on the subject.
5. Avoiding Automation
We already covered how automation can help you improve your data reporting. But, it turns out that automation is so critical in modern reporting that avoiding it can set you back. Three respondents cited a lack of automation as a major data reporting mistake.
“Extracting data from independent sources like Microsoft Excel, Word, and even Powerpoint; likewise scouring through different folders from a shared network just to obtain data — are the biggest company mistakes that make data collection tedious and time-consuming,” says Michael Hass of Angry BBQ.
According to eMathZone’s George Tsagas, “The biggest mistake a company can make in reporting is to report manually. Automating reporting is one of the quickest and easiest time-savers and helps you focus more on running and scaling a business and less time on the business’s everyday functions.”
Natalia Brzezinska of PhotoAiD adds, “One of the biggest mistakes a company can make is refusing automation. That means wasting time creating reports that often contain errors and not relying on automation instead. At first, it may seem difficult to find the right tool for your needs and understand how to make the most of it. But then, it will make your life easier.”
Automated reporting brings many other benefits besides automatic data collection. It manages your regular reporting workflows for you so you can work on drawing insights from your reports. You’ll find more benefits in our guide to automated reporting.
Enhance Your Reporting Process With Databox
Some of the most frequently touched-on ways to improve reporting or avoid pitfalls involved centralization and automation through reporting software. If you’re looking to try one for yourself, why not Databox? It offers all five ways to improve reporting that we covered today:
- Consistently reports by updating in real-time
- Improves data visualization with a dashboard designer
- Automates data collection by pulling data from 130+ integrations and custom sources
- Helps you focus on goal metrics with pre-built templates
- Centralizes your data in a looped dashboard report
Start with a free-forever plan to see how it works for yourself. Sign up today for free.


