


Table of contents
As initial downloads start to roll in, you’re feeling excited. You get your first users and it feels pretty awesome.
Well, it’s not victory just yet.
You surely want to continue growing and reach a larger audience with more potential customers, right? In order to do that, it’s crucial you understand what drives downloads and how you can improve.
That’s why you’ve got to start measuring your progress and see where you’re lagging.
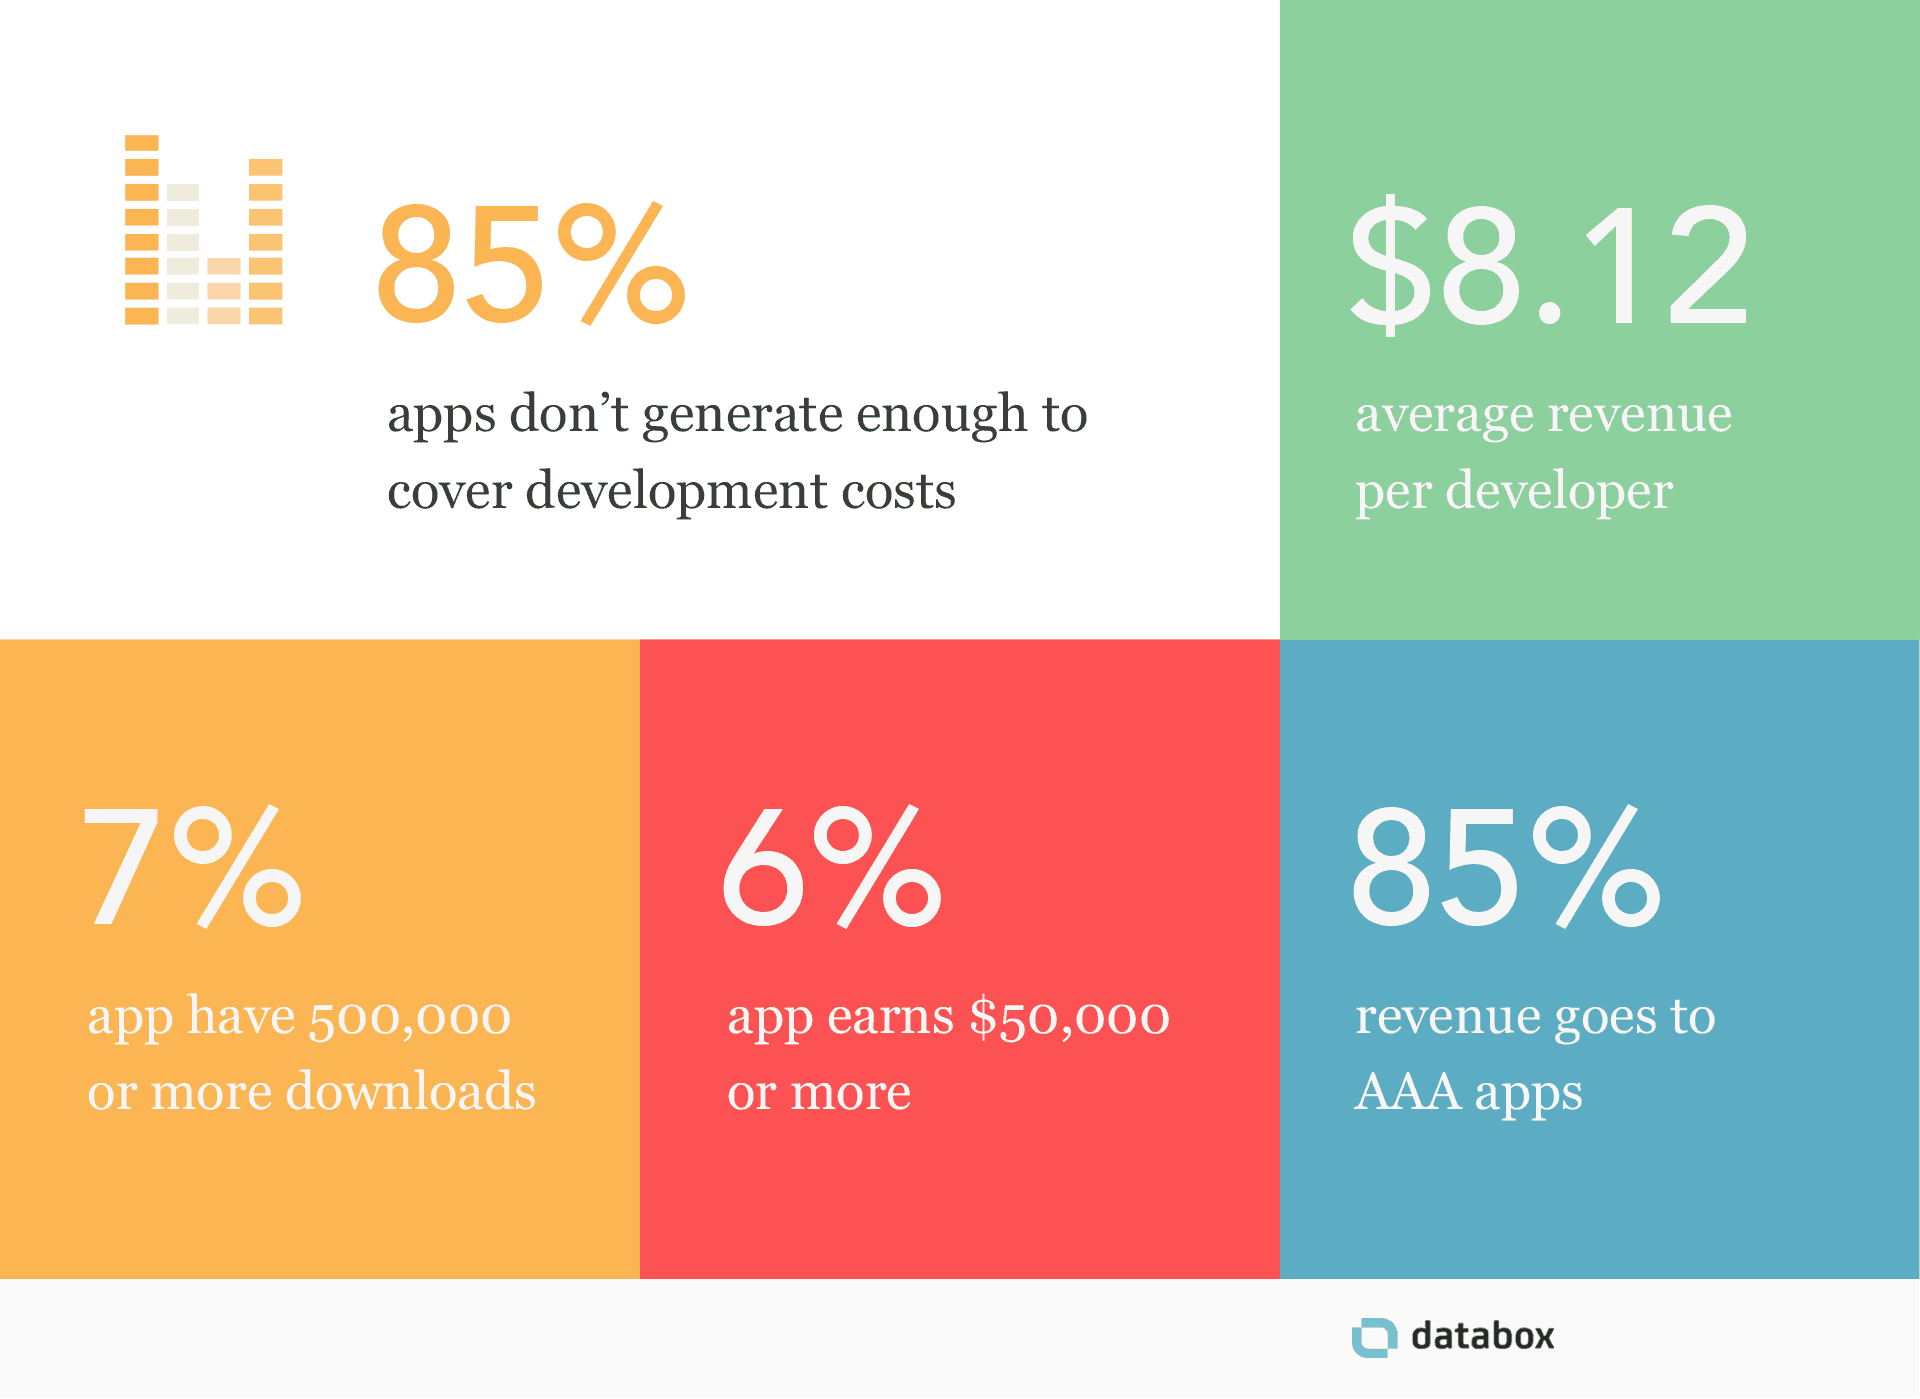
The Google Play store is a massive marketplace with more than 2.2 million apps, and provides countless opportunities for companies and individuals alike to reach their potential customers. However, with such an enormous volume of apps, it can be quite difficult to find your “sweet spot” — the best place to attract potential customers.
One of the first steps you need to consider in your pursuit of having a well-recognized app is to prepare a description, screenshots (video is even better!) and to choose proper keywords. This can be a tricky and time-consuming process, but there are a lot of good guides online which can help you achieve this.
Now what?
Now comes the tricky part — being and staying successful on the Play store.
How do you know if the keywords you chose are the right ones? What’s the best way to keep track of how your app views or downloads change when you change a keyword or description? Which metrics are best to keep an eye on? Read on, we have you covered.
Defining important metrics
The only way to improve any income you’re expecting from the Play store is to first define a set of metrics which will help us measure performance against our goals. In order to do that, let’s take a look at how a typical user downloads and eventually pays (either by the price for our app or later via a subscription, etc.) for our app:
- The user browses the Play store and sees our app
- He or she then taps on the app to see a more detailed description
- This is where the user hits ‘Install’
- Once downloaded, the app is opened by the user
- The user spends time in the app and eventually pays
Visualizing app success
Let’s translate the 5 steps above into key metrics and find a visualization for them:
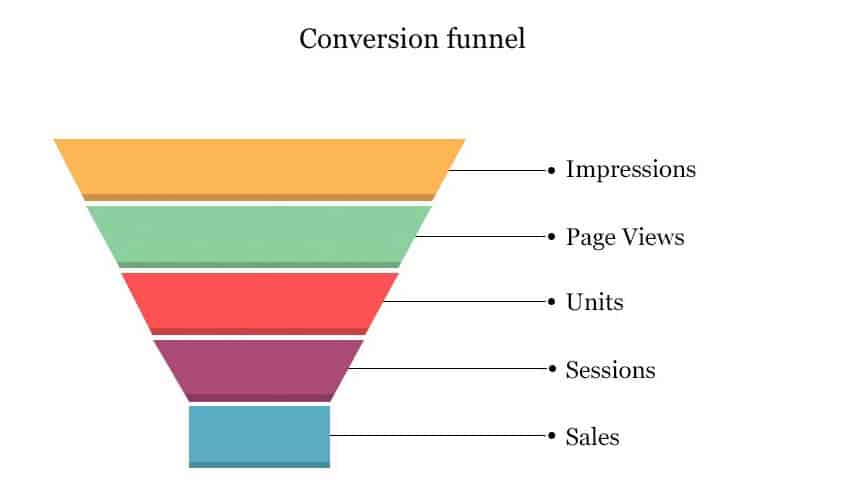
These are the 5 most important metrics every Play store Analyst should pay attention to in order to track how their app is doing.
When we examine the above funnel, we easily see where the biggest drop offs are. These are the areas where we should focus on first as they can help us increase the overall conversion by the largest amount. Improving each conversion step is a whole article on its own, but here’s a quick hack for each step:
- Too few impressions? Try promoting your app more on different channels like Twitter, Facebook, Reddit, etc.
- To increase page views, your title, rating, and icon are critical.
- Unit downloads are hard to improve but providing good visuals and a clear “what’s in it for the user” description can help.
- After the download phase, it’s all about the retention ie. “stickiness” of your app.
Now that you know what metrics to pay close attention to, how do you track them easily and in real-time? With these free app store dashboards, you’ll be keep an eye on the performance of your apps at a glance.
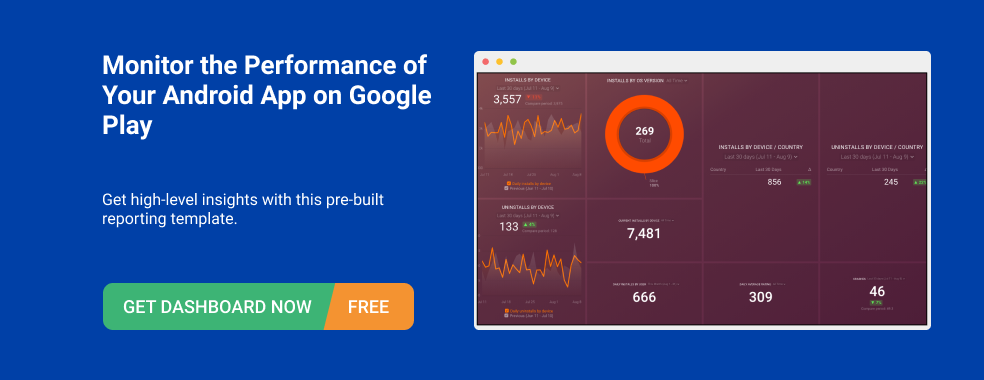
PRO TIP: Monitor Your Android App Performance Like a Pro
Do you own an Android or Chromebook app and use Google Play Store to manage it? Do you know how your app performs on a daily basis? And what about the number of installs and uninstalls you had recently? Get an instant access to the most important data on your app’s performance in one convenient dashboard, including key metrics like:
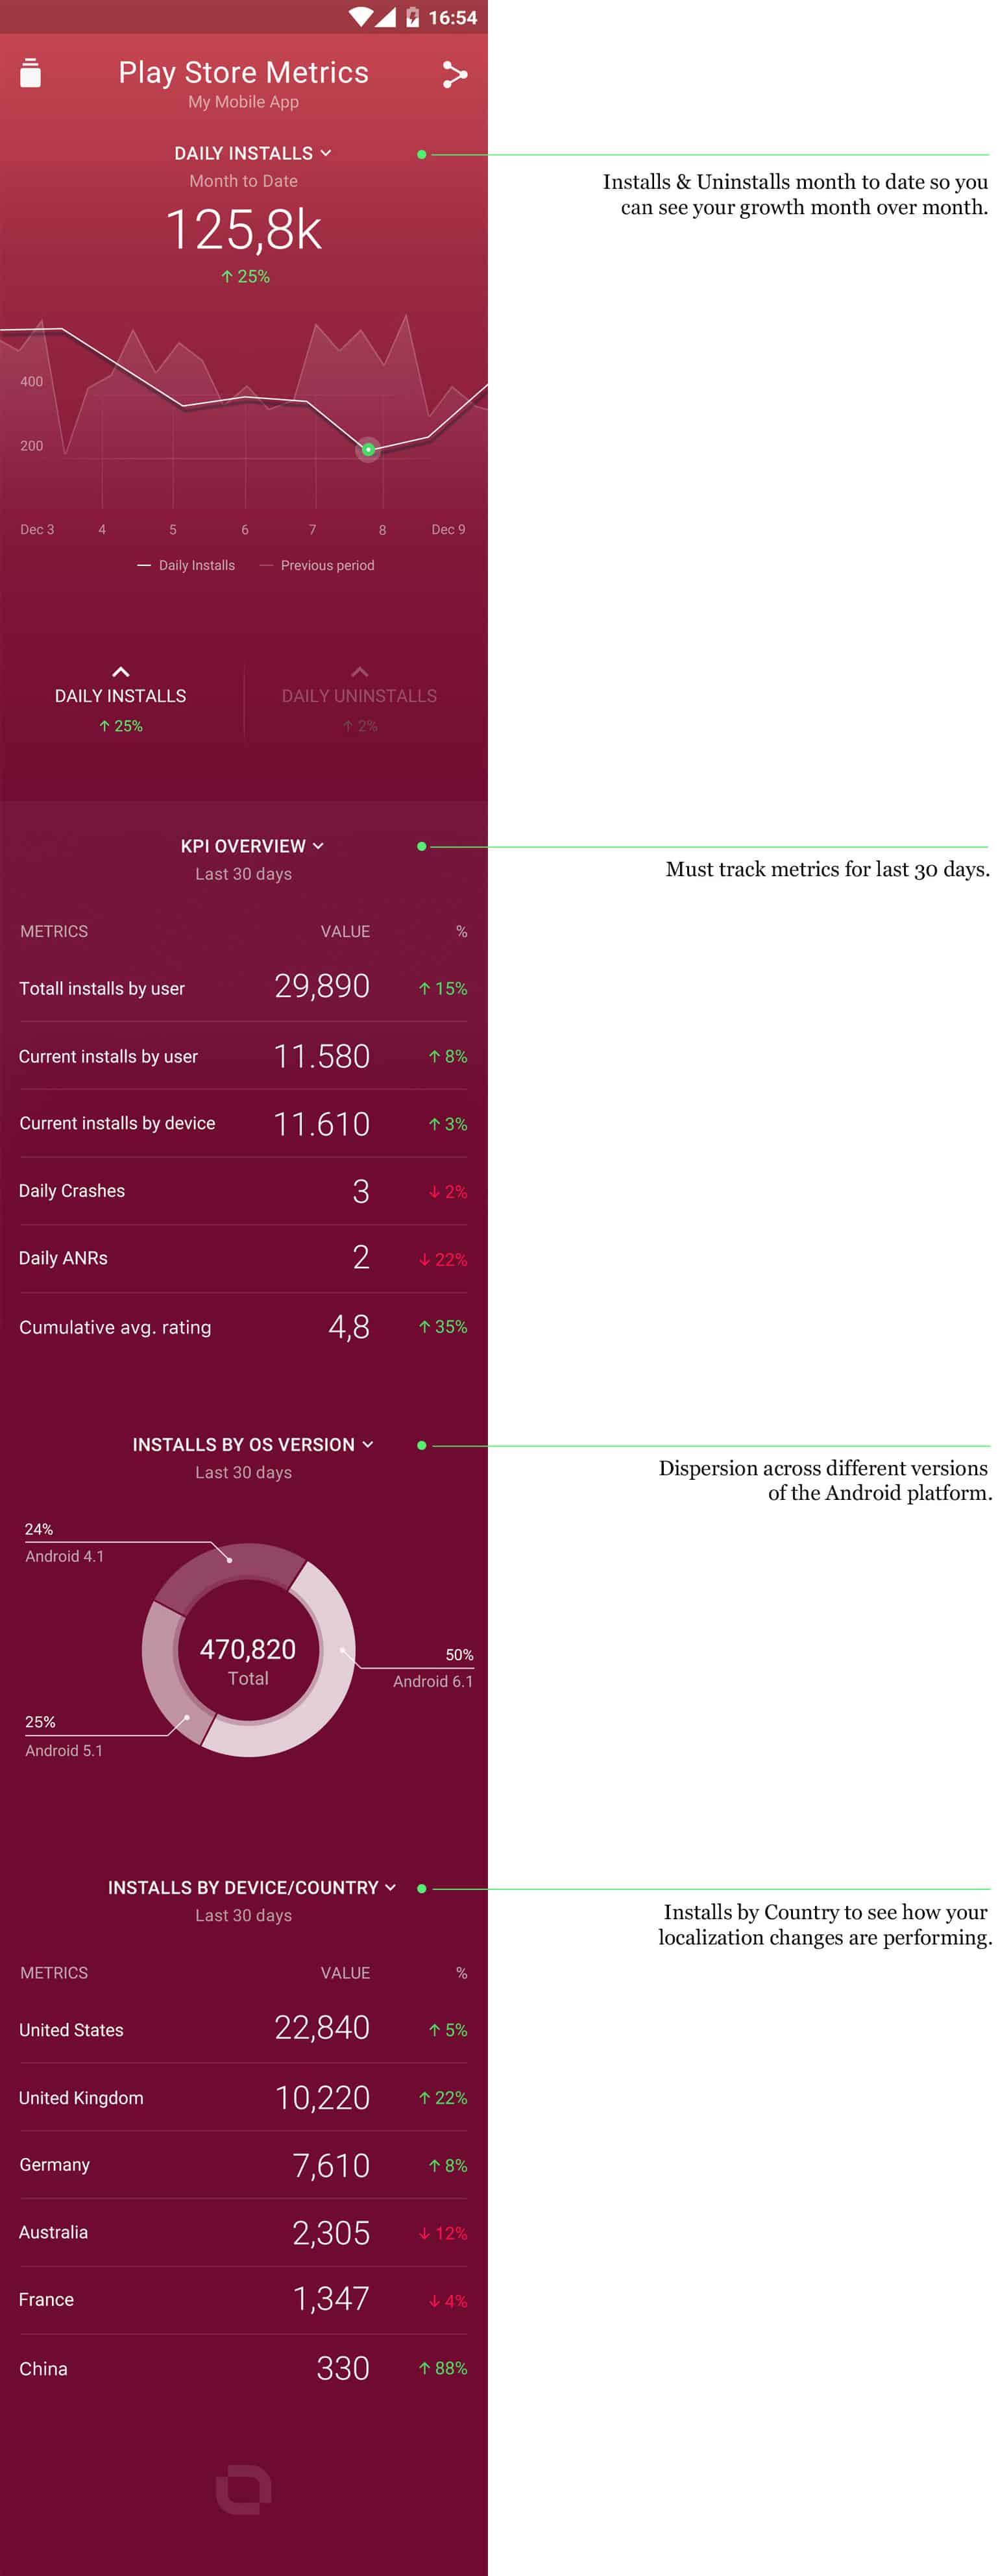
- Installs and uninstalls by device. How many users have installed and uninstalled your app in a certain period of time? How many on a daily basis?
- Installs by OS version. Which operating system versions get the most installs?
- Installs and uninstalls by country. Where are most of your installs and uninstalls happening around the world?
- Total installs. How many total installs have happened over time?
- Crashes. How many times has your app crashed during a certain period of time?
- Daily rating. How do users rate your app on a daily basis?
Now you can benefit from the experience of our Google Play Store experts, who have put together a plug-and-play Databox template that contains all the essential metrics for monitoring and analyzing your app’s performance. It’s simple to implement and start using, and best of all, it’s free!

You can easily set it up in just a few clicks – no coding required.
To set up the dashboard, follow these 3 simple steps:
Step 1: Get the template
Step 2: Connect your Google Play Store account with Databox.
Step 3: Watch your dashboard populate in seconds.
Building an Analytics Dashboard with Databox
We’ve defined a set of metrics and a clear goal on how to measure success. Now it’s important to stay persistent and always know how your app is responding to changes that are introduced.
Meet Databox.
Databox provides a ready-to-ship integration with Google’s Play Developer console, where everything you’d ever need to know about your app’s performance is available.
The initial template is equipped with all the metrics mentioned above and a few other essentials, so no analytical work on your end required to get up and running. However, it’s important to point out that you can customize the template as needed (different visualizations, time intervals, metrics, etc.). If you have your Play app connected with Google Analytics you can combine metrics from different data sources (Google Analytics in this example) to see even more detailed implications on changes you introduce.
If you want to see it in action for yourself, this is a good starting point to help you get up and running with Databox.
Don’t forget that when you’re building an app, you’ve got to consider more than just Android users. iOS is a huge platform and in order to really be able to grow, it’s a must to support both platforms.
With Databox Designer, you can combine metrics from different data sources to see how your overall business is doing.
We are always thinking mobile-first, but in addition to ensuring your data travels with you in your pocket, all of these metrics can be easily delivered to your office on a big TV screen and even right in your Slack channels.
If you work for a company and want to be truly data-driven, easy access to key metrics is a necessary starting point. Empowering everyone in your organization to make data-driven decisions will happen more cost-effectively if you find ways to democratize access to data and sharing relevant business insights.
Next time you’re planning your mobile app launch, think about how you want your conversion funnel to look like. With the right approach, you can avoid a lot of problems early on! With the right set of metrics and a tool which leaves you with nothing but clear data to action, your next release will be even better!
Ready to start tracking metrics for your Google Play app? With our metric tracking software, you can track your most important metrics from one screen.


