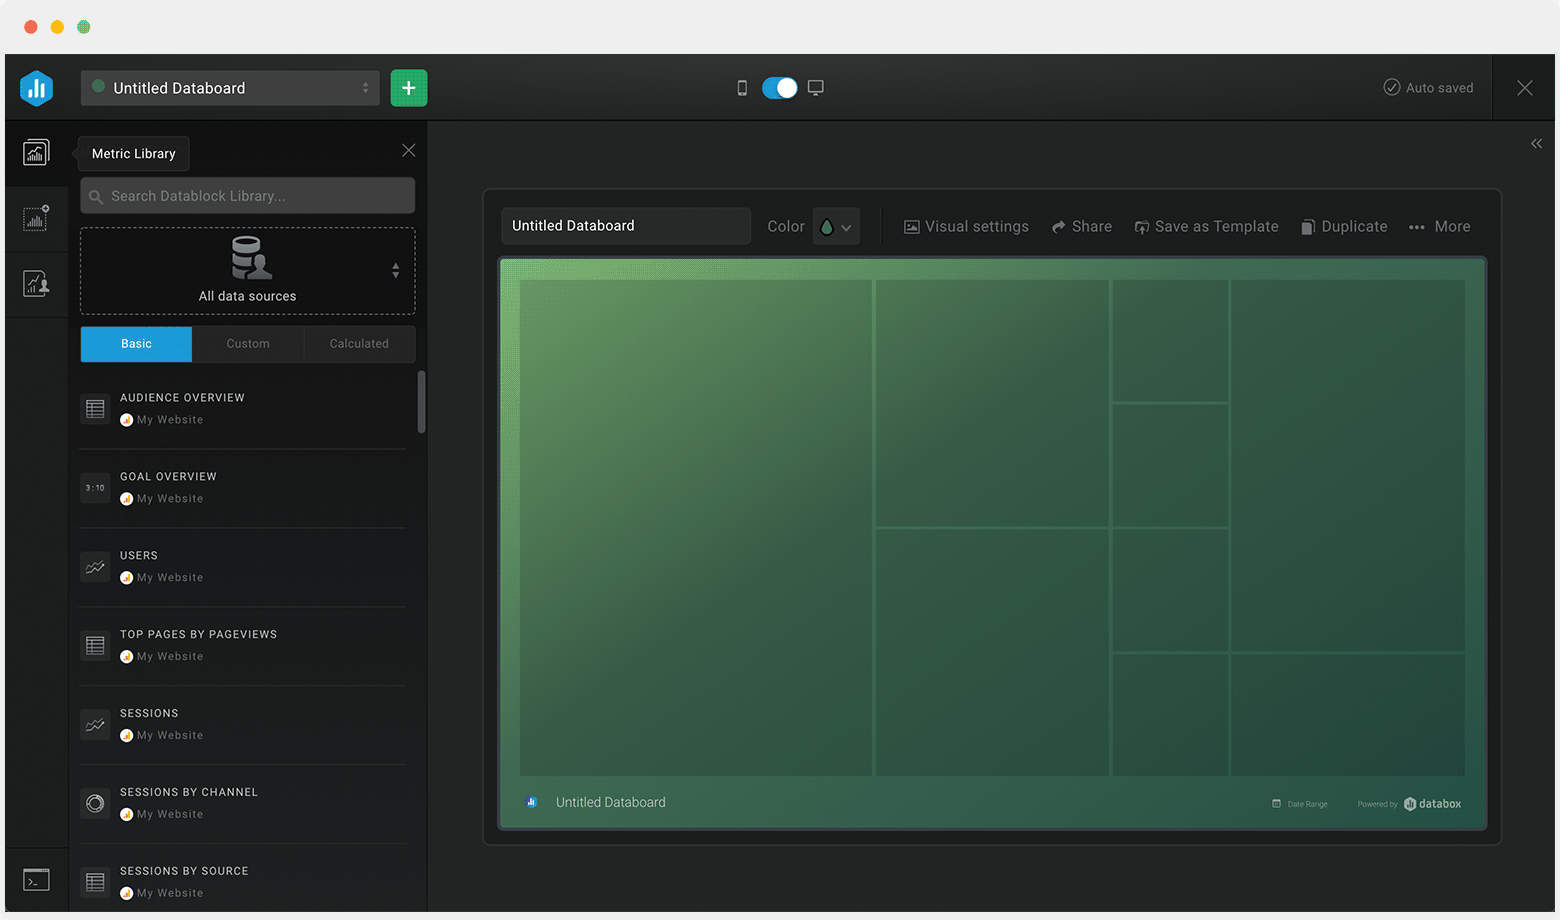
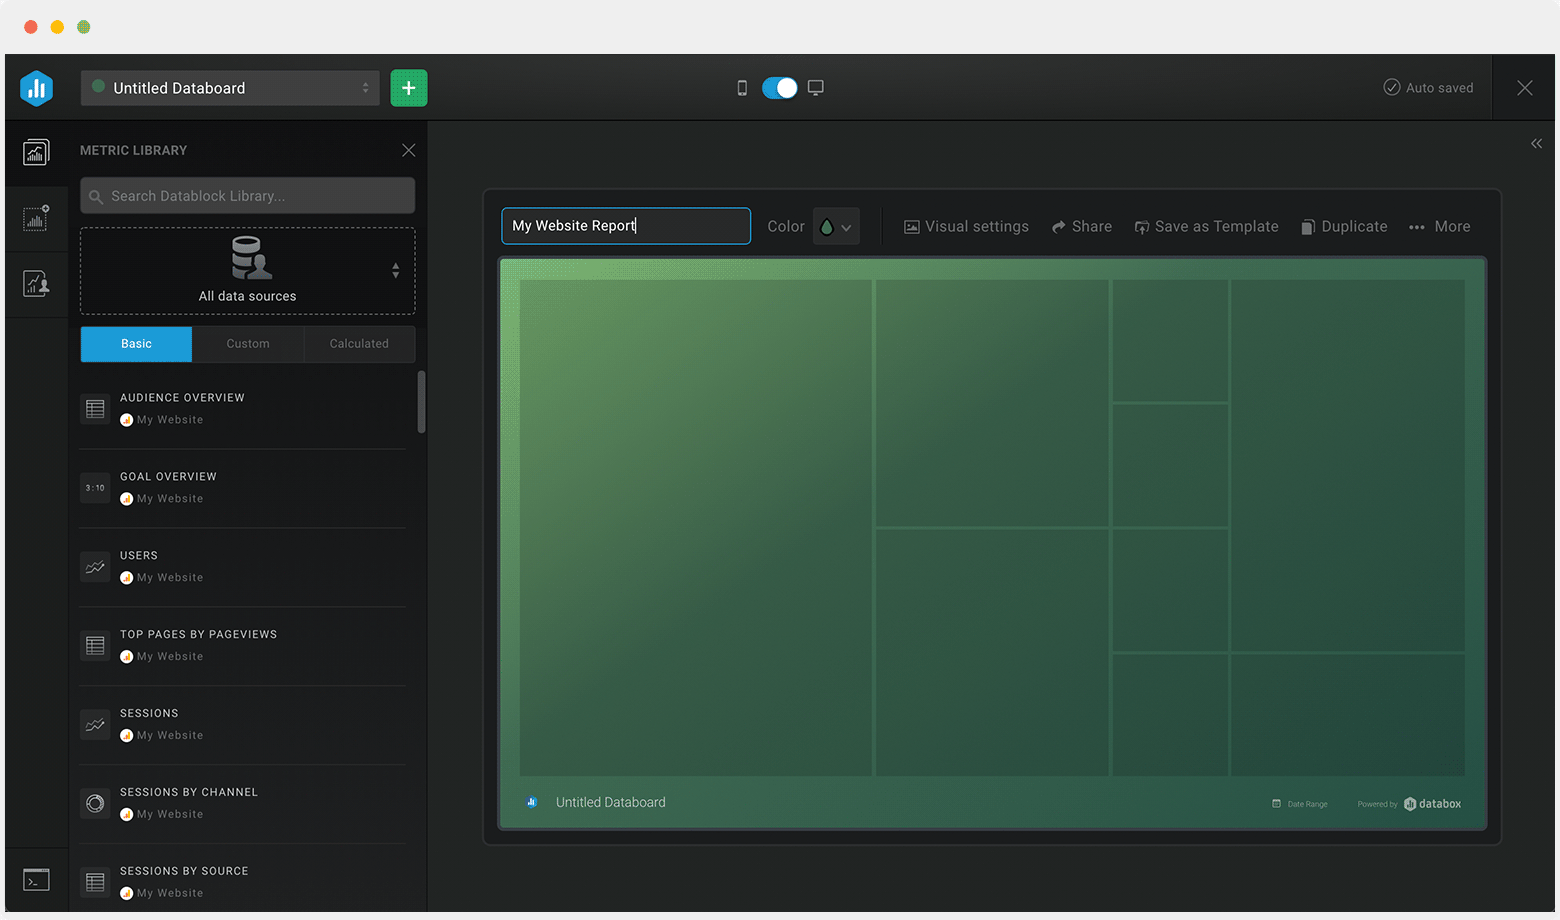
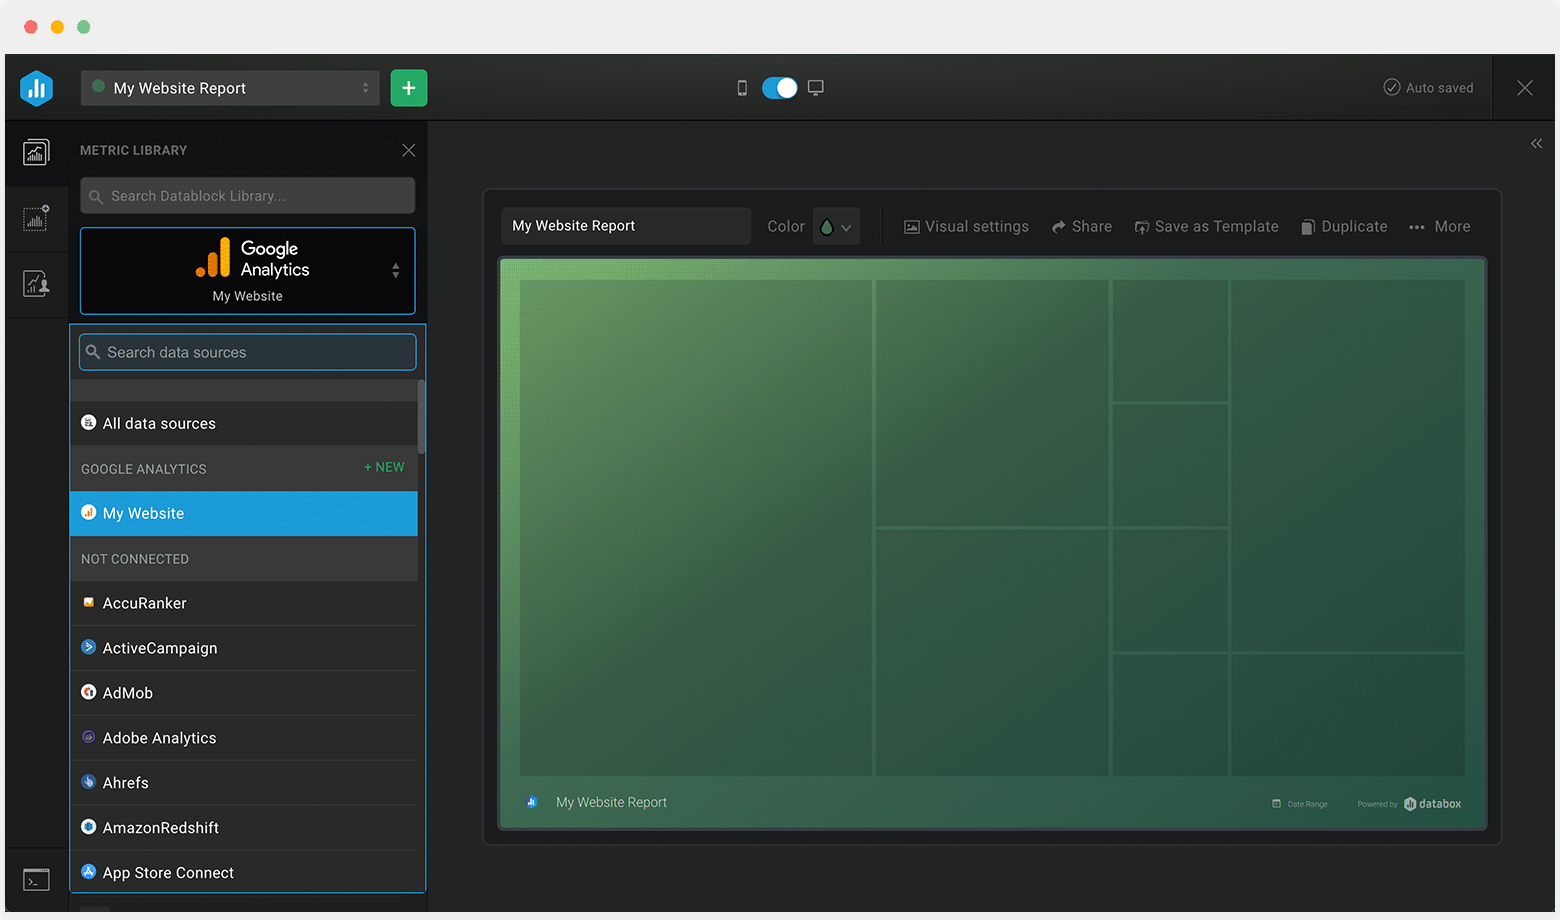
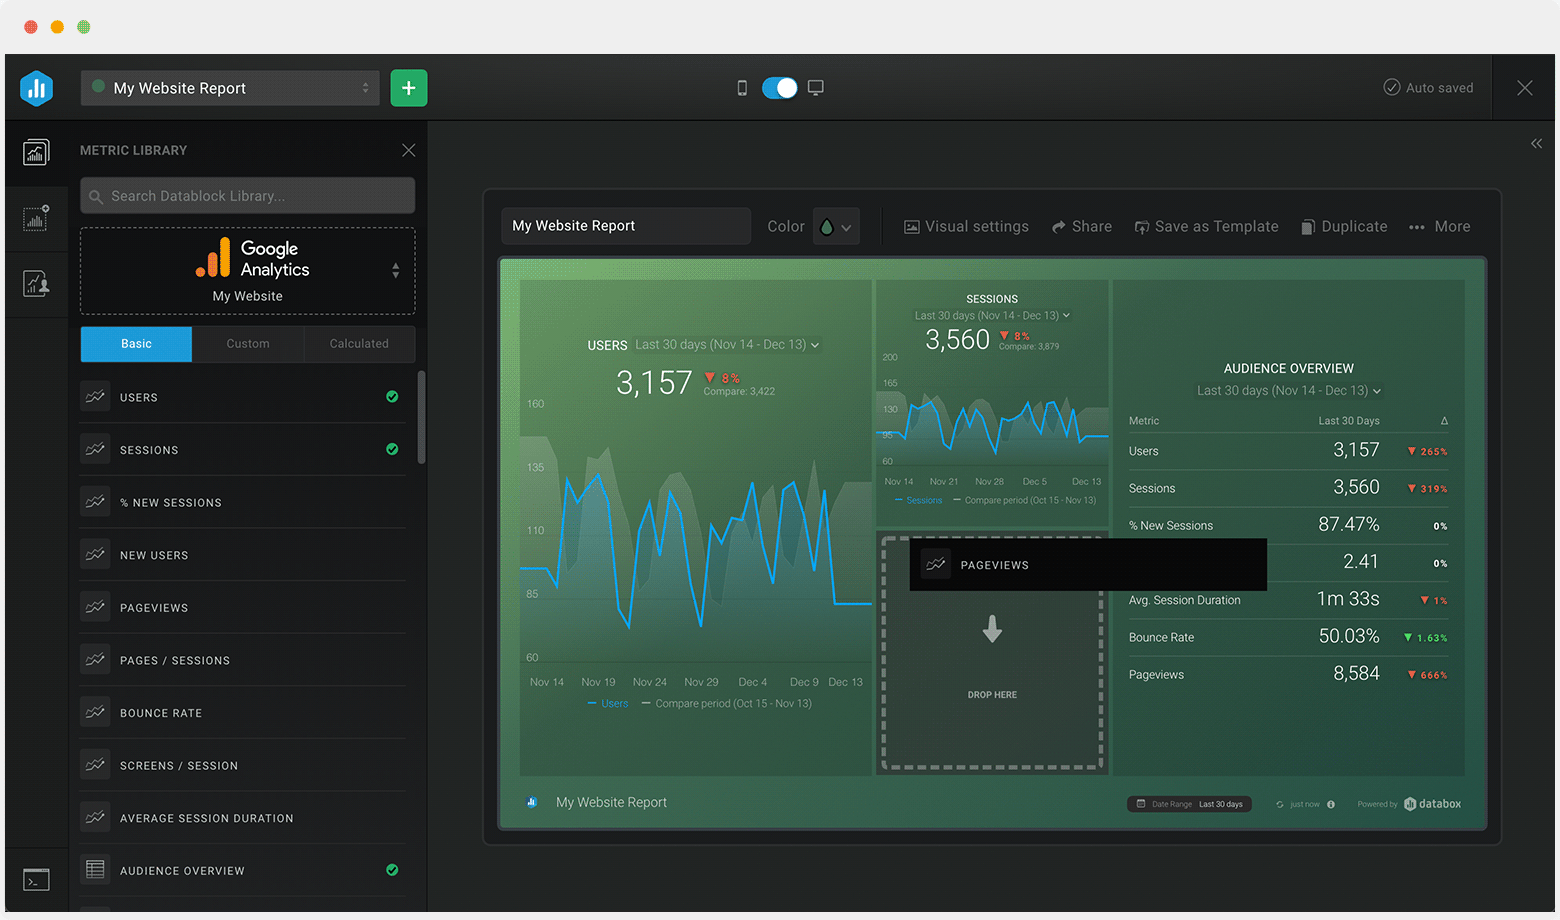
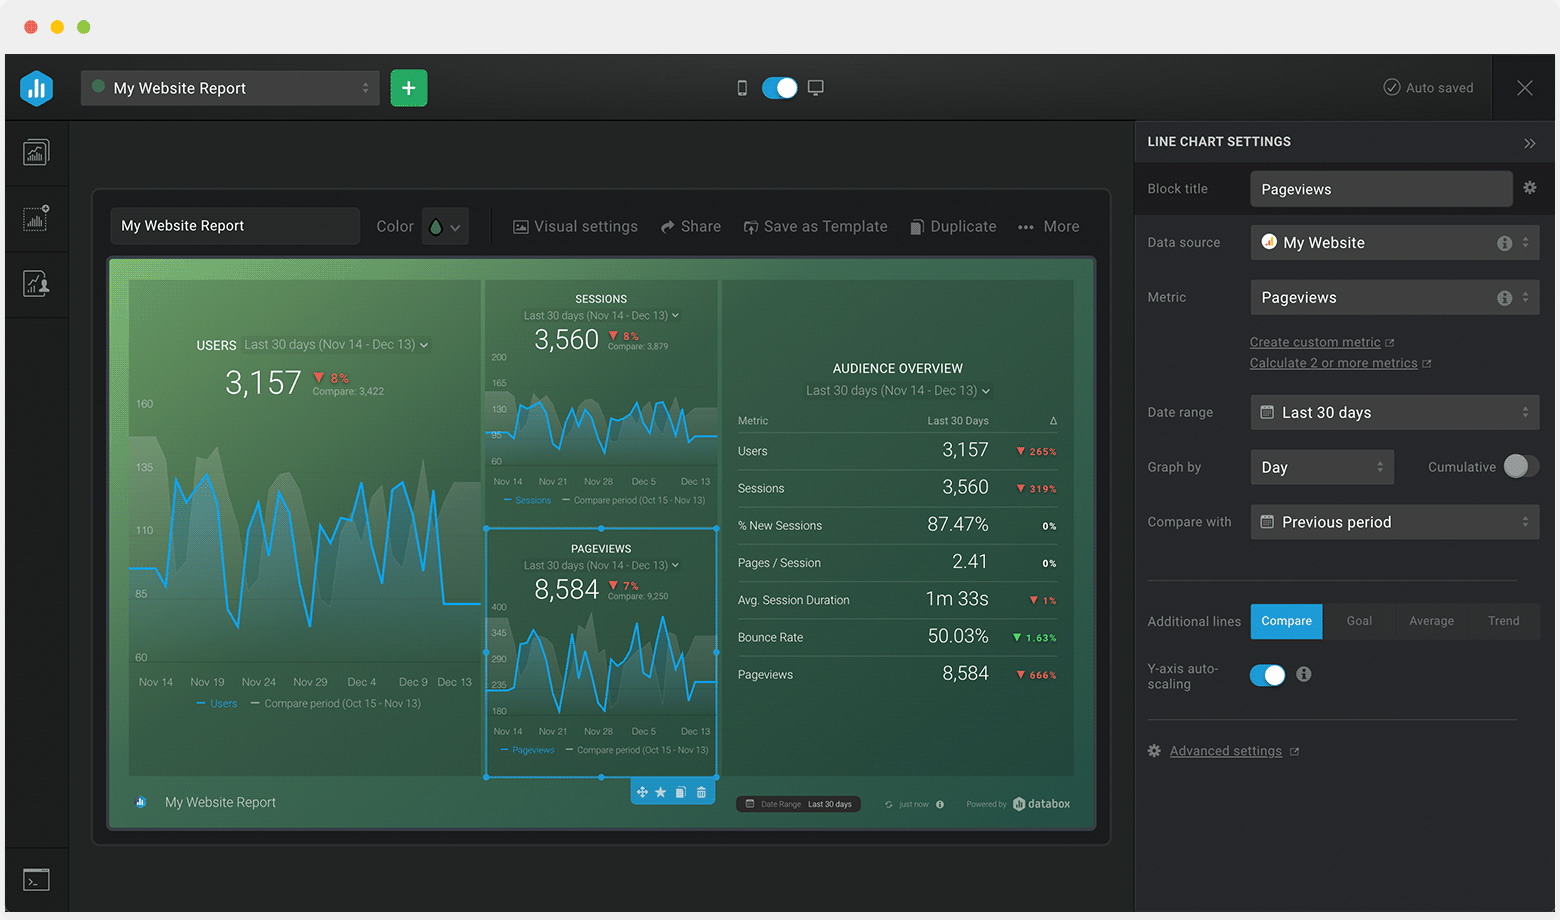
Track some of the most common App Store metrics and KPIs and analyze your App Store performance with just a few clicks.
You can build a dashboard with any data using Zapier, Make, Google Sheets, or a SQL database.

These app store dashboards come pre-built with some of the most commonly tracked software development metrics from the most popular tools. You can also customize your templates later. To get started, just choose a template, connect your data, and your metric visualizations will populate automatically.
Try It Free


No design or coding skills necessary.
Learn more about Dashboard DesignerAn app store dashboard provides you with a complete overview of your app(s) engagement performance in app stores.
See how well your apps are doing in terms of ranks, sales, reviews, installs, uninstalls, and so on.
Your App store dashboard should highlight only actionable, well-defined and relevant metrics that will give you a full picture of your apps engagement and performance in the app store.
Avoid the temptation to fill your dashboard with metrics that do not matter, with the right metrics in your dashboard, you’ll be able to determine if you’re seeing the desired results from your apps in the app stores, and if not, figure out what changes to make.
The most important App store metrics you should be tracking are:
