IT Metric

Free IT Metrics Dashboard Templates

These IT metrics dashboards come pre-built with some of the most commonly tracked software development metrics from the most popular tools. You can also customize your templates later. To get started, just choose a template, connect your data, and your metric visualizations will populate automatically.

Create your free Databox account

Track some of the most common IT Metric metrics and KPIs and analyze your IT Metric performance with just a few clicks.

TOP IT Metric INTEGRATIONS
  • GitHub
  • Jira
  • Bitbucket
Don’t see your SEO tool?
You can build a dashboard with any data using Zapier, Integromat, Google Sheets, or a SQL database.
GitHub dashboard template provides you with the latest release stats like commits, repository status, top contributors for any Github project.
GitHub
This dashboard will help you track all your standard and custom metrics from your Jira account, filter by specific parameters and choose from a variety of date ranges.
Jira
Bitbucket dashboard template provides you with the latest release stats like commits, repository status, top contributors for any Bitbucket project.
Bitbucket

Build custom IT Metric dashboards

No design or coding skills necessary.

Learn more about Dashboard Designer

What is an IT Metric Dashboard?

IT metrics dashboards make it easy for IT departments to track and assess the performance of their services and initiatives.

Use this dashboard to quickly measure progress against set goals, identify and resolve bottlenecks or issues, identify improvement opportunities and demonstrate the ROI of service and support.

What Should Be Included in an IT Metric Dashboard?

When building an IT metric dashboard, it is important to include only meaningful metrics and KPIs. This will in turn, allow you to quickly identify what’s working and what isn’t and ultimately improve business, operational and team performance.

The most important IT metrics you should be tracking are:
  • Repository status
  • New, open, and closed issues
  • Open vs. closed pull requests
  • Commits by Users
  • Issue Event Types
  • Issue resolution by User
  • Lead & Cycle times, and more.

How to Create a IT Metric Dashboard

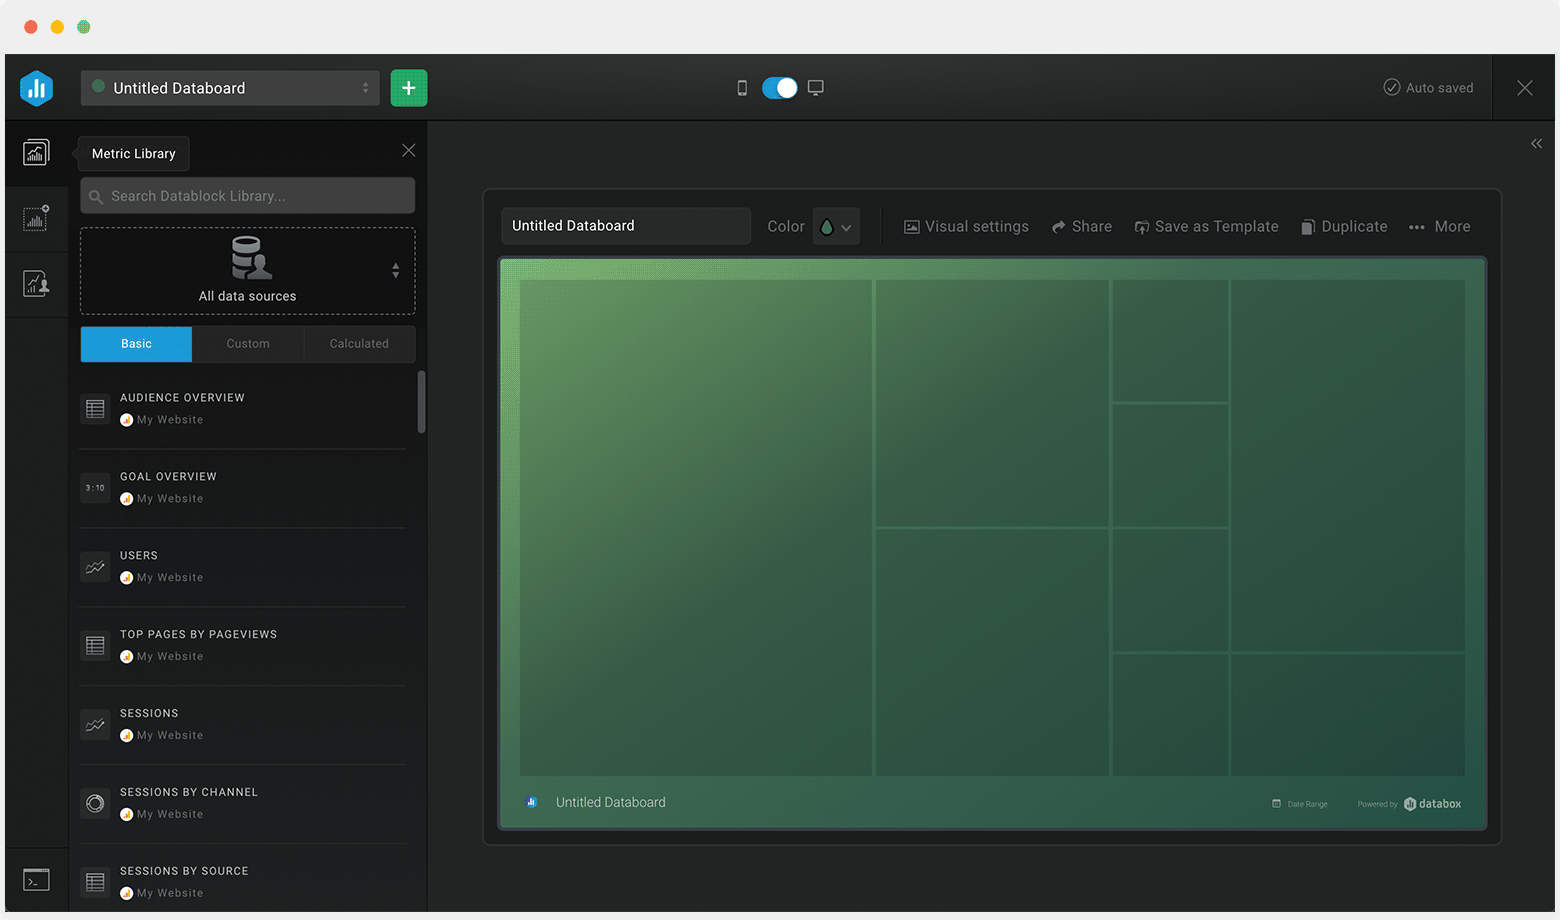
Using Databox’s Dashboard Designer, building a dashboard is as simple as connecting a data source, choosing the metrics you need from our Metrics Library, and watching your visualizations populate in seconds. No coding and design skills are required.

Create a new dashboard using our Designer tool
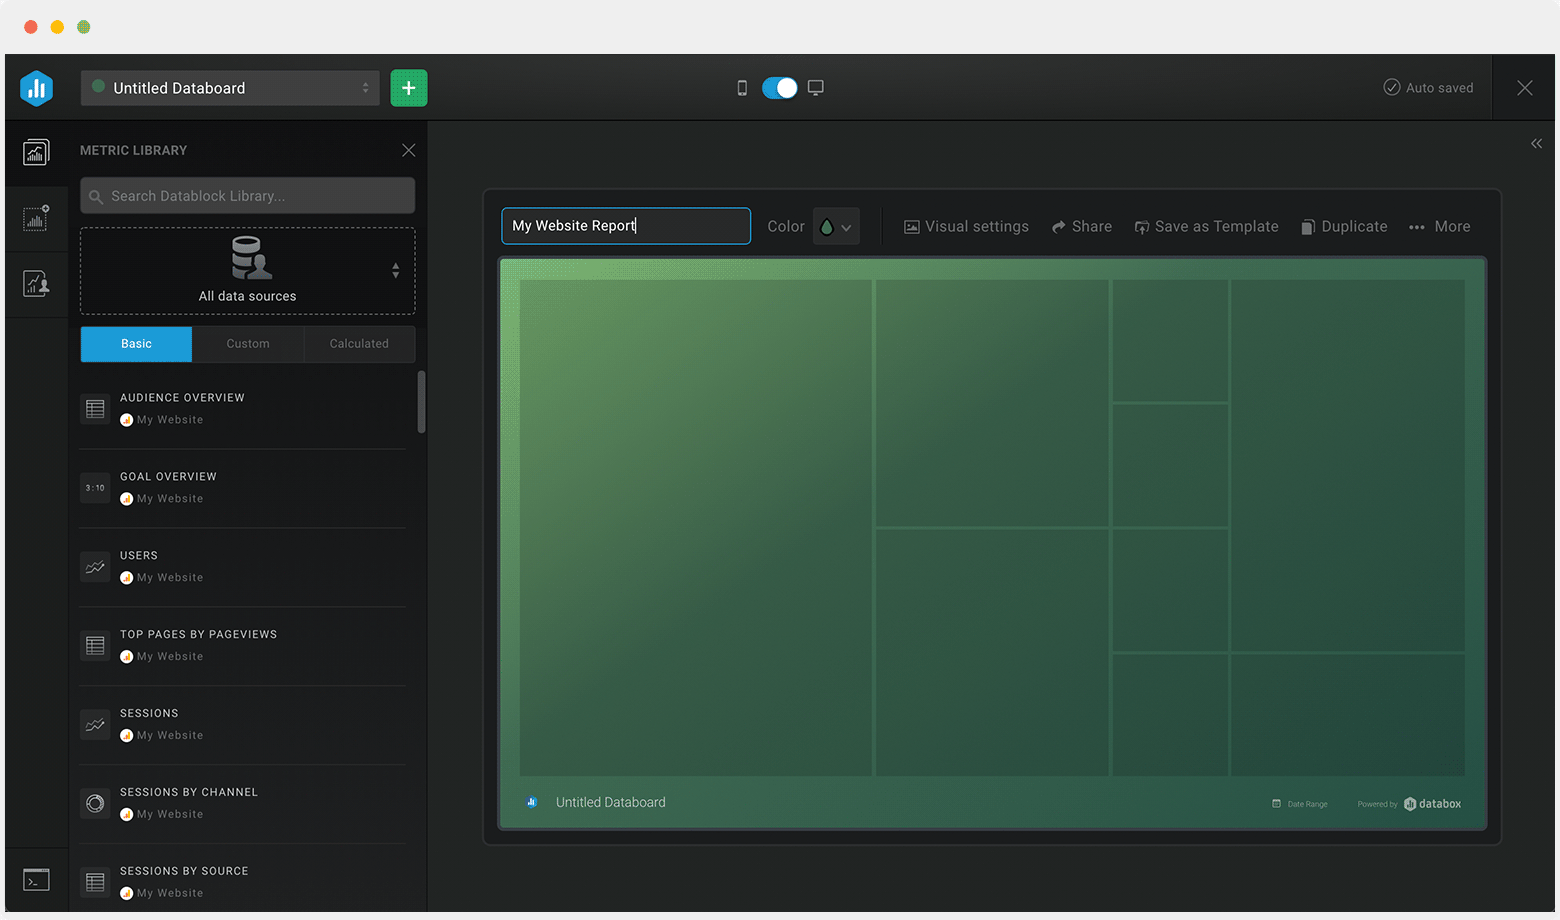
Name your dashboard
Name your dashboard
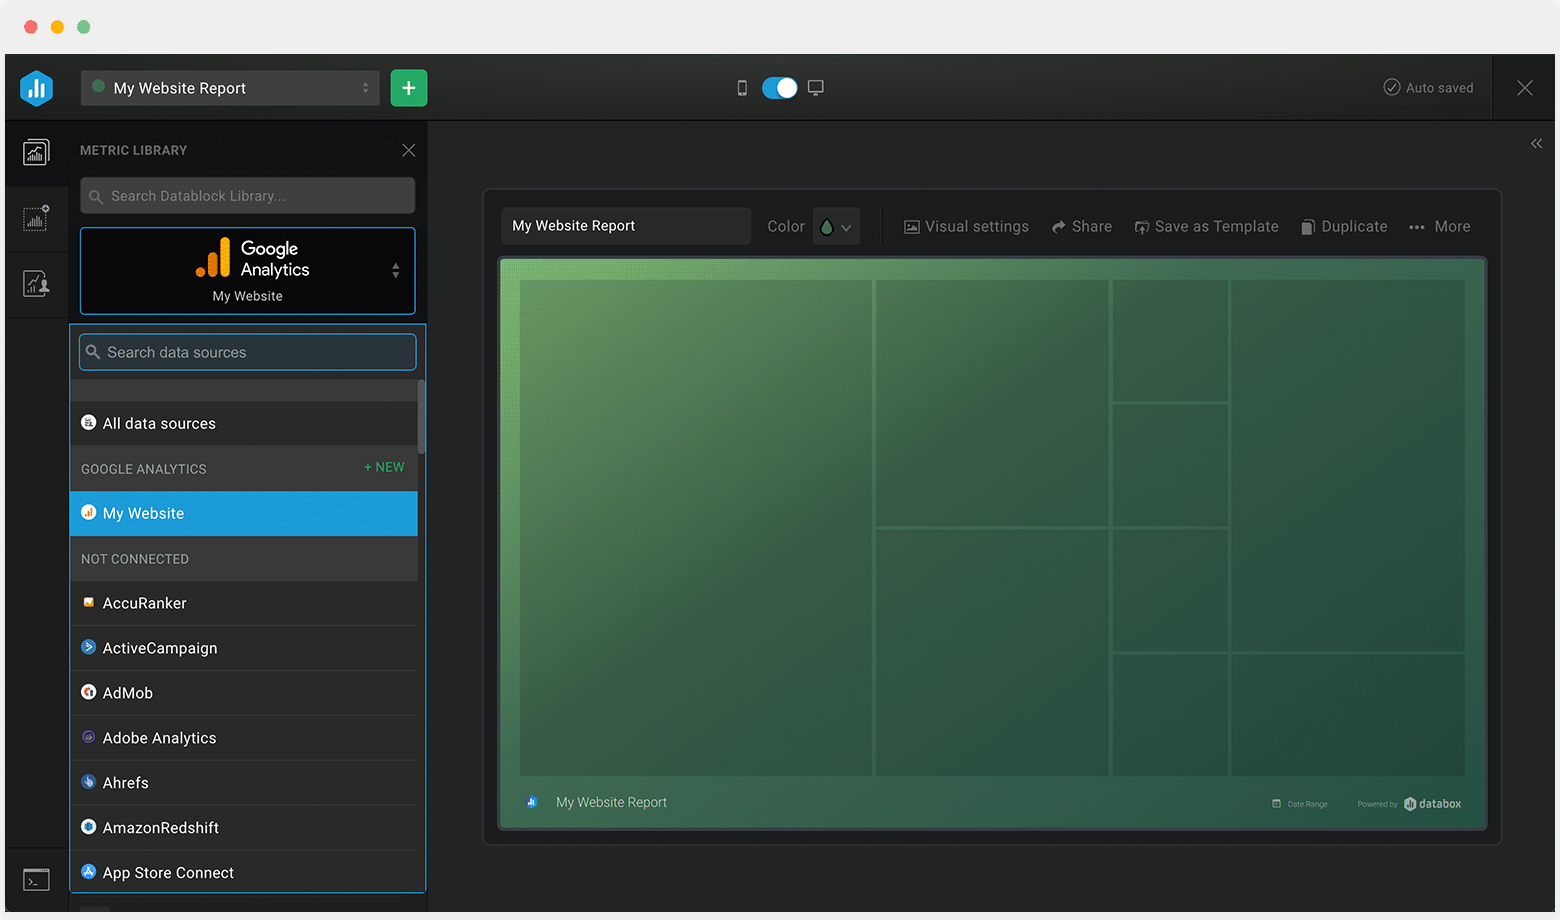
Select a data source
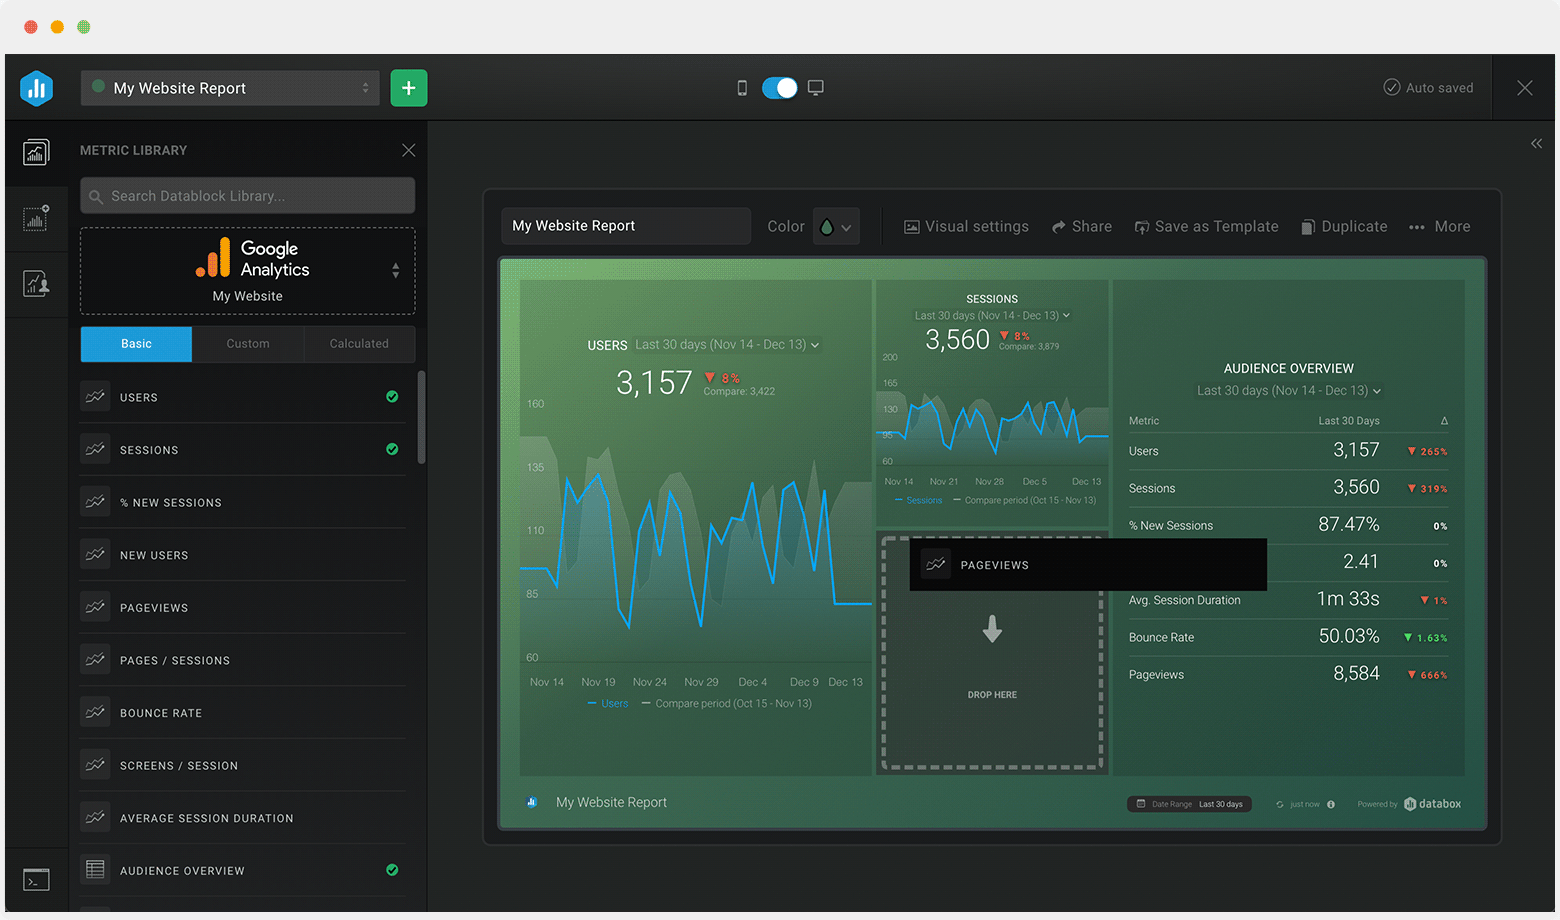
Drag-and-drop pre-built metrics from that source to your dashboard or drag a blank visualization first and select the metric you’d like to associate with it.
Drag-and-drop pre-built metrics from that source to your dashboard
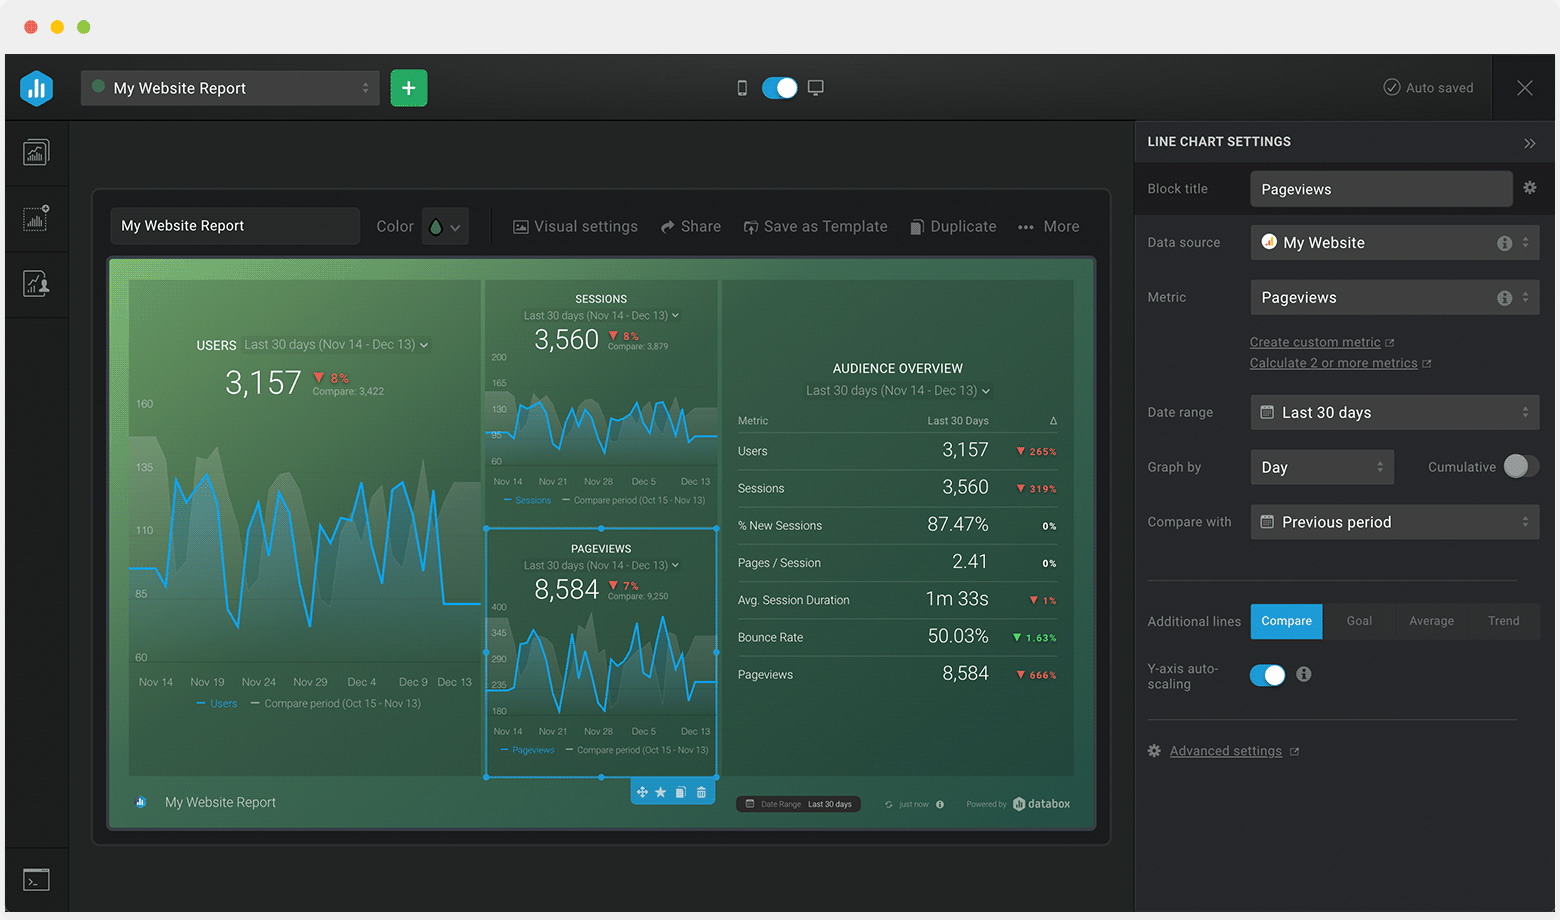
Customize each metric block by date range, comparisons, goals, and more.
Customize each metric block

Explore even more Software Development dashboard templates