Uses one-click integrations:
If you don't use Bitbucket, you can pull data from any of our 130+ one-click, native integrations or from spreadsheets, databases and other APIs.
Try this dashboard for freeWhat you’ll learn from this Bitbucket Overview Dashboard Template:
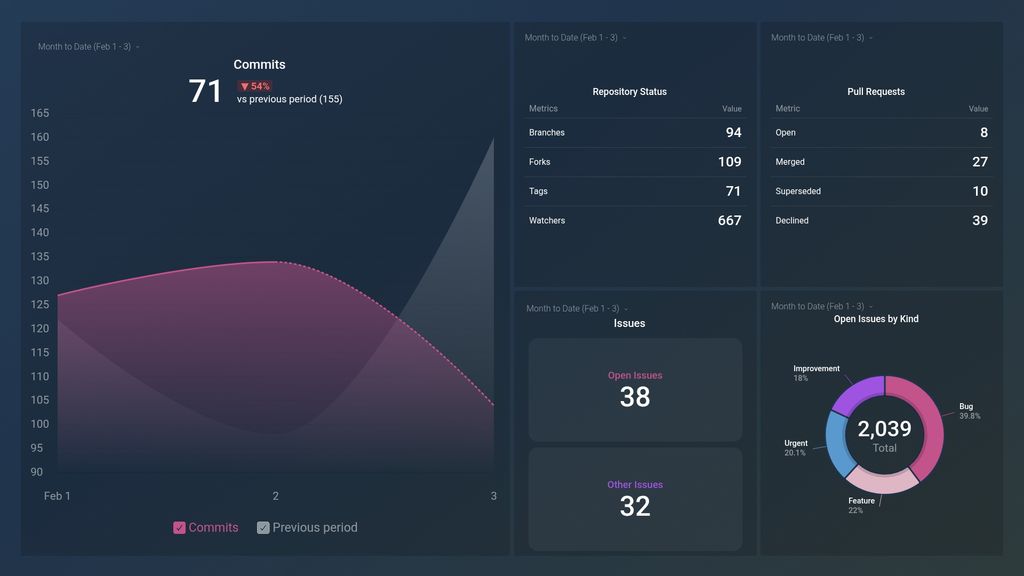
By using this powerful collaboration tool, your software team will be able to execute projects in a timely and organized manner. Here’s what you’ll learn from connecting your BitBucket account with Databox:
- How many changes were made to our project this week? See the number of commits made by users to a project or repository on a daily basis. Compare these stats to the previous month.
- How do we track the status of all requested code reviews by my team? Monitor the status of all proposed code changes to your file at any given time. This is useful to track to stay informed on the necessary changes needed to deliver quality code.
- How many unresolved issues do we have at the moment? Get a real-time account of all open issues your team needs to take action on in a given time period, from feature requests to bug reports and other pending project tasks.
- How do I check the status of a repository? Check the status of your project file(s) by tracking crucial metrics that’ll enable you to make quick, informed decisions.
Pull additional data using our deep integration with BitBucket.
What else can you track and visualize with our robust integration with BitBucket?
When it comes to evaluating your software team’s performance, almost anything:
- Top contributors
- Repository activity
- Branches
- Tags
- Watchers
There are many different metrics and metric combinations you can track using BitBucket. And in Databox, you can quickly visualize 100s of Bitbucket metrics in a variety of different ways.
Read more about Databox’s BitBucket integration.
Explore more Bitbucket dashboards.
-
Branches
The Branches metric in Bitbucket measures the number of branches that exist within a repository. It gives an idea of how teams manage their codebase and collaborate on new features or bug fixes.
-
Commits
Commit metric is a count of individual changes made to the codebase, giving insights into how active the project is and how frequently changes are being made.
-
Forks
Forks are a metric that tracks how many times a repository has been copied by other users or organizations to create a separate, independent version of the codebase.
-
Open Issues
The Open Issues metric in Bitbucket represents the number of unresolved problems or task items that have been reported or created in a repository's issue tracker and are waiting for resolution by the development team.
-
Other Issues
Other Issues is a Bitbucket metric that tracks the number of non-bug related issues, such as feature requests or tasks, in a repository.
-
Issues by Kind
The Issues by Kind metric in Bitbucket categorizes and displays the number of issues based on their type (e.g. bug, enhancement, task) to help teams prioritize and manage their work effectively.
-
Declined Pull Requests
The Declined Pull Requests metric in Bitbucket measures the number of proposed code changes that were rejected by team members or automated checks.
-
Merged Pull Requests
The Merged Pull Requests metric measures the number of pull requests that have been successfully merged into a branch within a specific time frame, indicating the productivity and collaboration of a team.
-
Open Pull Requests
Open Pull Requests is a metric that shows the number of pull requests in a repository that have not been merged or closed yet. It gives an idea of the current workload or collaboration level in a project.
-
Superseded Pull Requests
Superseded Pull Requests metric tracks the number of pull requests that were closed or merged due to another pull request superseding them.
-
Tags
The Tags metric tracks the number of tags that are associated with a repository in Bitbucket, which can be used to organize and label specific versions of code.
-
Watchers
Watchers is the number of users who have chosen to receive notifications of changes to a repository. They can watch any public repository hosted on Bitbucket.


