 Bitbucket (1)
Already have an account? Sign in
Sign up for free
Connect your datasources and instantly see your data in this template.
Creating your account...

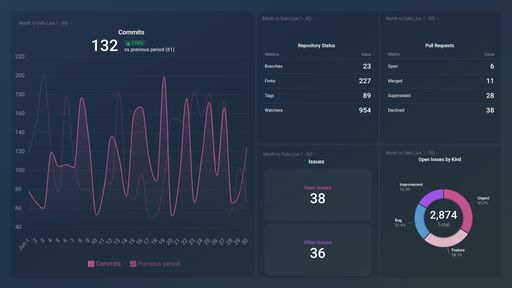
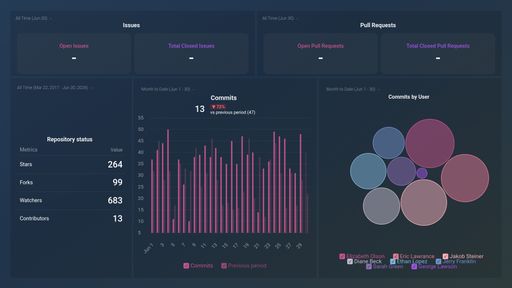
These devops dashboards come pre-built with some of the most commonly tracked software development metrics from the most popular tools. You can also customize your templates later. To get started, just choose a template, connect your data, and your metric visualizations will populate automatically.
Try It Free
No design or coding skills necessary.
Learn more about Dashboard DesignerA DevOps dashboard allows software development teams to easily track and analyze key metrics, such as load times, errors, response time, up and downtimes, and other components that enable a smooth and stable experience for the end-user of the web application or website.
With this dashboard, software development teams will be able to quickly identify bugs before they become a pain to the customer and also drive continuous improvement and development.
When building a DevOps dashboard, it is crucial to only include DevOps metrics and KPIs that align with the project objectives. Avoid crowding your dashboard with irrelevant, non-actionable metrics, that way you and your team will be able to stay on top of the deployment process, track project changes, measure team efficiency, and so on.
The most important DevOps metrics you should be tracking are:


Compare
Databox Inc.
HQ: Boston, MA, USA
AI-powered analytics for teams that need answers now.
Databox Inc.
HQ: Boston, MA, USA

AI-powered analytics for teams that need answers now.


Compare
Connect your datasources and instantly see your data in this template.
Creating your account...