Uses one-click integrations:
-
 GitHub
If you don't use GitHub, you can pull data from any of our 130+ one-click, native integrations or from spreadsheets, databases and other APIs.
Try this dashboard for freeWhat you’ll learn from this GitHub Overview Dashboard template:
Connect your GitHub account and learn:
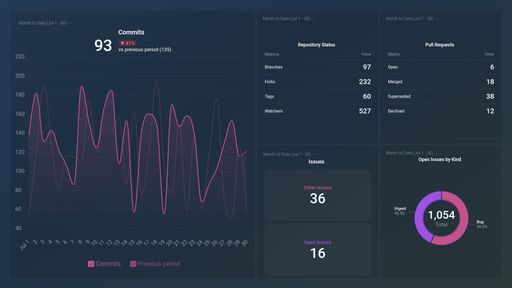
- What changes have been made to a specific project? Track the number of changes that have been made to a specific project in a given period in comparison to previous dates. This data is useful to all project contributors as they might want to know how many changes were made before the final result, who made them, and why they were made.
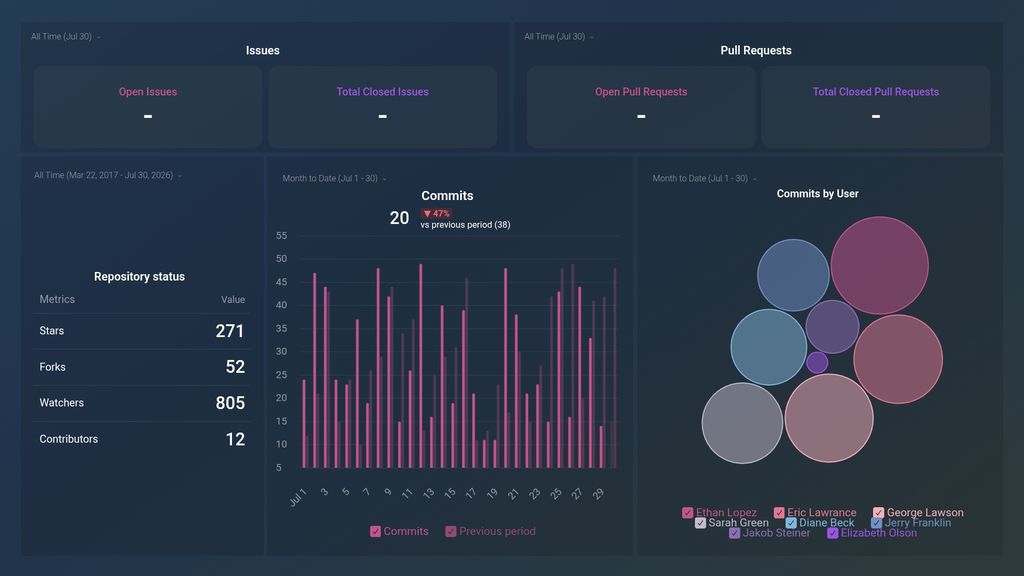
- How do I check the status of a repository? Check the status of your project file(s) by tracking key metrics that’ll enable you to make quick informed decisions.
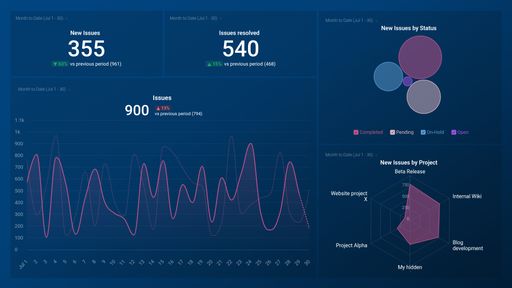
- How many open (and closed) issues do we have? View the number of issues with open or closed status in a specific repository over time. Use this information to track the overall productivity of your team and/or a specific project.
- Do we have any pending pull requests? Track how many changes have been suggested by members of your team for a specific project. See how many have been accepted and merged into a branch and those that are still open and waiting approval.
- What’s our average pull request close time? See how much time it takes for a decision to be made on a contributor’s submitted pull request. This information is important due to the fact that it lets you know how healthy your project is and how responsive your team is to external help.
- Who are our top contributors? See the most active contributors to your project in the last 30 days. This is a great way to find out the contributors that have filed the most pulled requests during a given time period.
Pull additional data using our robust and integration with GitHub
What other campaign metrics can you track and visualize with our GitHub integration? Among others:
- Repository status
- New, open, and closed issues
- Open vs. closed pull requests
- Commits by Users
- Issue Event Types
- Issue resolution by User
- Lead & Cycle times, and more.
There are many different metrics and metric combinations you can track using this integration. And in Databox, you can quickly visualize your most important GitHub metrics in a variety of different ways.
Read more about Databox’s GitHub integration.
Explore more GitHub dashboards.
GitHub metrics included in this template
-
Commits
Commits metric shows the number of changes pushed to a Git repository over time. Each commit is a snapshot of changes made to the codebase.
-
Commits by User
The Commits by User metric shows the number of times each user has made a commit to a repository. It helps identify the most active contributors and their impact on a project.
-
Contributors
The Contributors metric shows the number of individual users who have made at least one commit to a repository, indicating the level of community engagement.
-
Forks
The Forks metric tracks the number of times a repository has been copied by other users or organizations on GitHub.
-
Total Closed Issues
The Total Closed Issues metric tracks the number of issues that have been resolved or closed by all contributors in a GitHub repository.
-
Open Issues
The Open Issues metric counts the number of unresolved problems, bugs or feature requests in a repository. It helps to track the backlog of work and prioritize tasks.
-
Total Closed Pull Requests
The Total Closed Pull Requests metric tracks the number of pull requests that have been successfully merged or closed in a repository.
-
Open Pull Requests
The Open Pull Requests metric indicates the number of proposed changes to a repository that are awaiting review and merge by the repository owner or designated collaborators.
-
Stars
The "Stars" metric on GitHub represents the number of users who have marked a repository as a favorite. It is a way to quantify a repository's popularity or usefulness.
-
Watchers
The Watchers metric on GitHub represents the number of users who are tracking a particular repository, receiving notifications regarding its activity.