


Table of contents
It all starts with one metric, right?
And then another. And another. And so on.
But, when it comes to tracking performance, the process of tracking what’s important has gotten more and more complicated.
Logging into multiple tools to find the data. Clicking through multiple screens. Cutting and pasting screengrabs. Downloading CSVs. Uploading data into spreadsheets. Building slide decks.
It never gets any easier, does it?
Ugh.
Thus, Databox’s mission. Our raison d’etre, so to speak––making performance data more accessible and actionable for everyone on your team.
Today, we’re making it even simpler, with the official launch of the Metrics screen.
Now, it only takes a few clicks for anyone in your organization to create a personalized view of all the metrics that matter to them, then collaborate with colleagues to select all the metrics that matter to your entire organization.
Once aligned around the right metrics, you can set goals, create alerts, build share-able dashboards, all directly from the Metrics screen in just a few clicks.
With the metrics Screen, your organization can eliminate the manual work of tracking performance and reporting and shift that time towards taking the actions that improve performance.
Log in or sign up to start using it, or read on to learn how it works.

Locating ‘Metrics’
First, you’ll notice that we’ve made a few changes in the left main navigation and on the secondary navigation at the top.
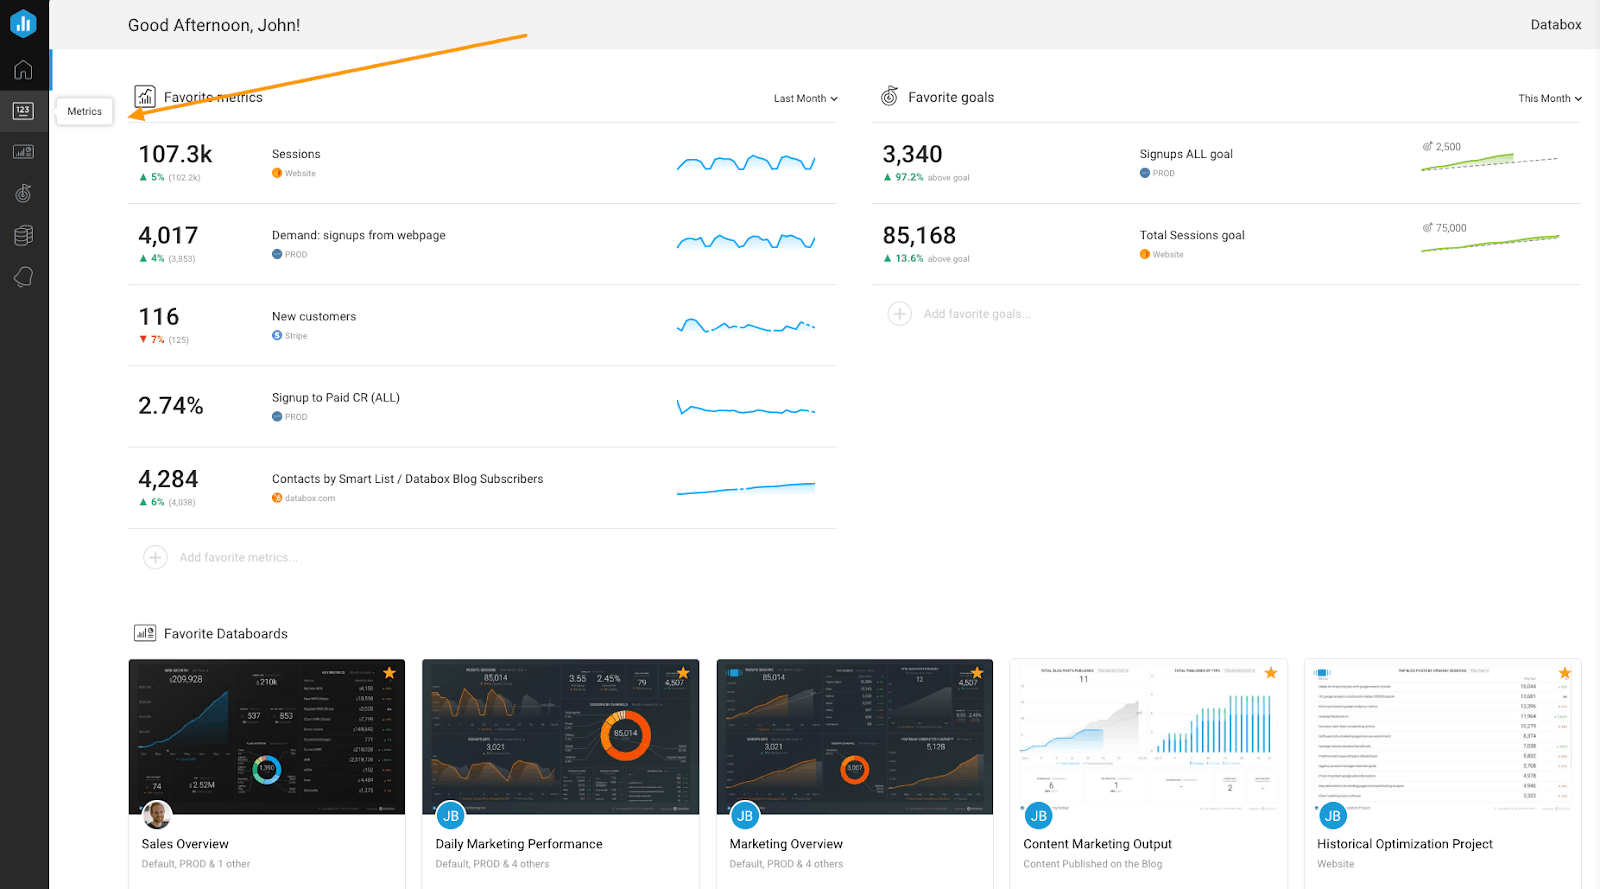
The main changes are as follows:
- We added a “Metrics” page as the first option on the left-side navigation right below the home icon..
- We also moved the Metrics Library, Data Calculations, and Query Builder under the new Metrics page, since all these tools are designed to help you find or build the metrics that matter to you.
We’ve also moved the Template Library to the sub-navigation inside the Databoards screen and renamed “Data Manager” to “Data Sources.”
Pick Your Metrics
The quickest way to start tracking performance in Databox is by first adding all of the relevant metrics to your Metrics screen. This will allow you to quickly scan how all of your metrics are performing at-a-glance.
Later, you can organize these metrics with tags and take additional actions, but first, you’ll want to add all of the relevant metrics your business tracks to your Metrics screen.
To start adding Metrics, click the ‘Add Metric’ button on the top right of your Metrics screen.
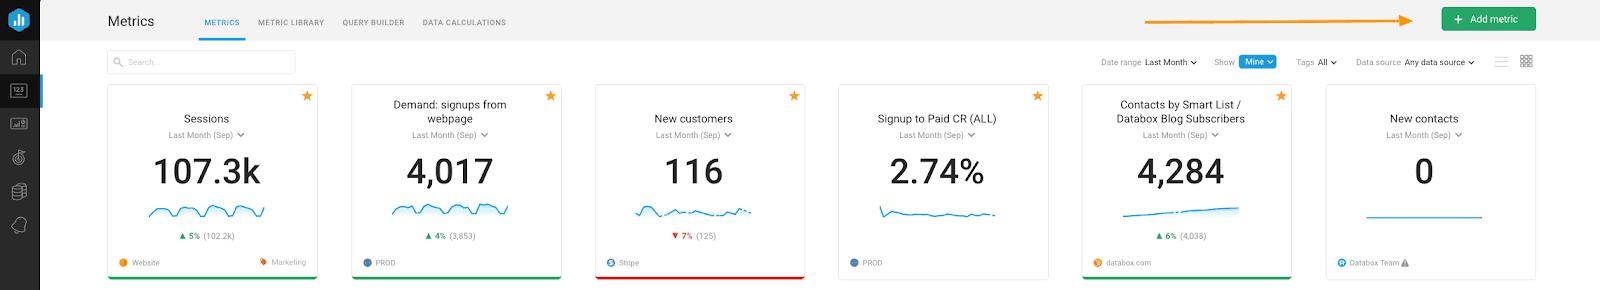
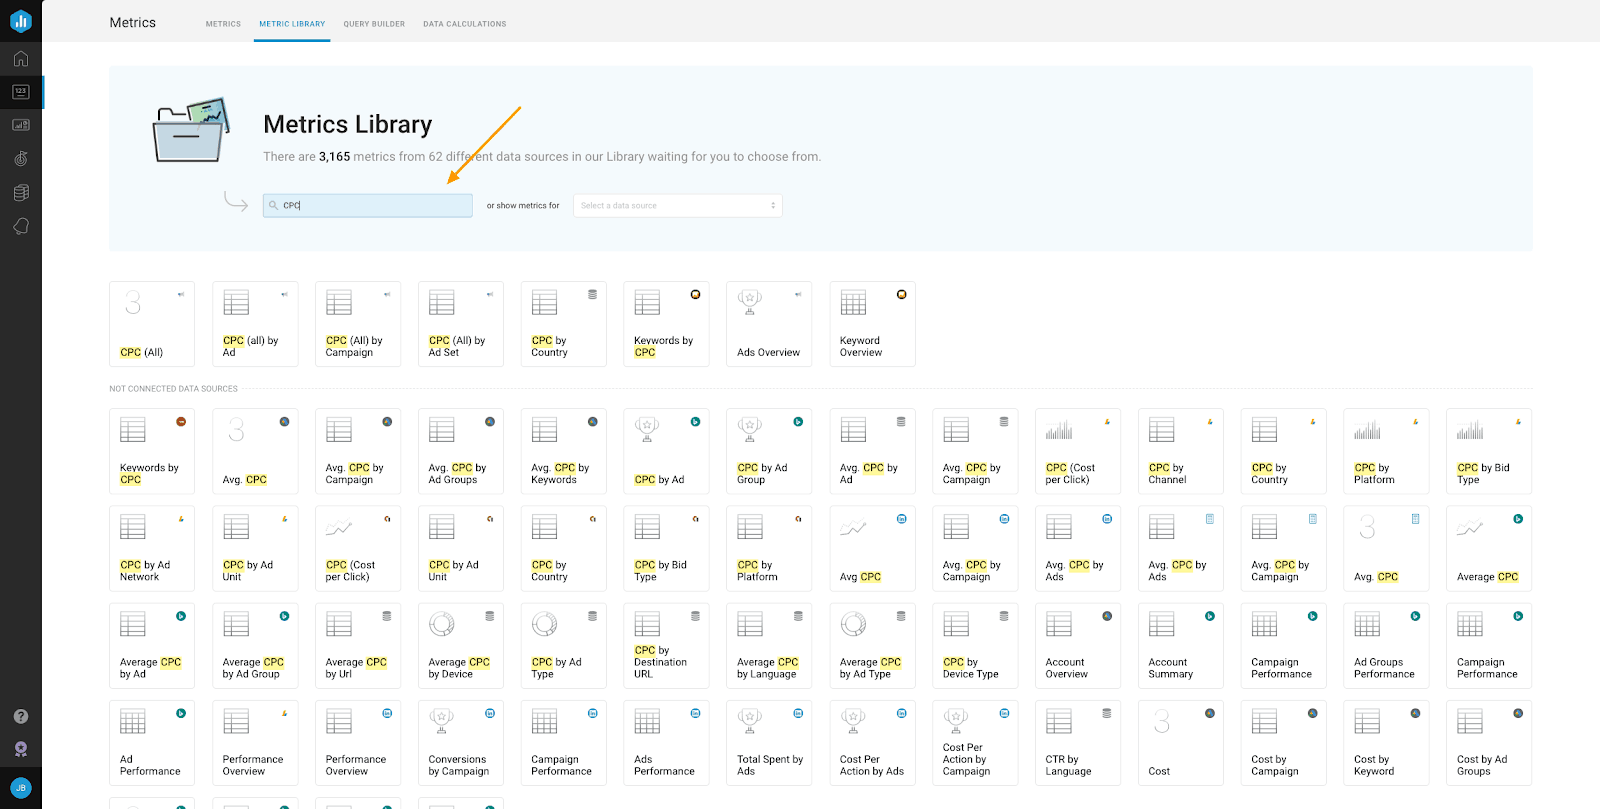
This will direct you to the Metric Library where you can search for specific metrics (i.e. “CPC”)
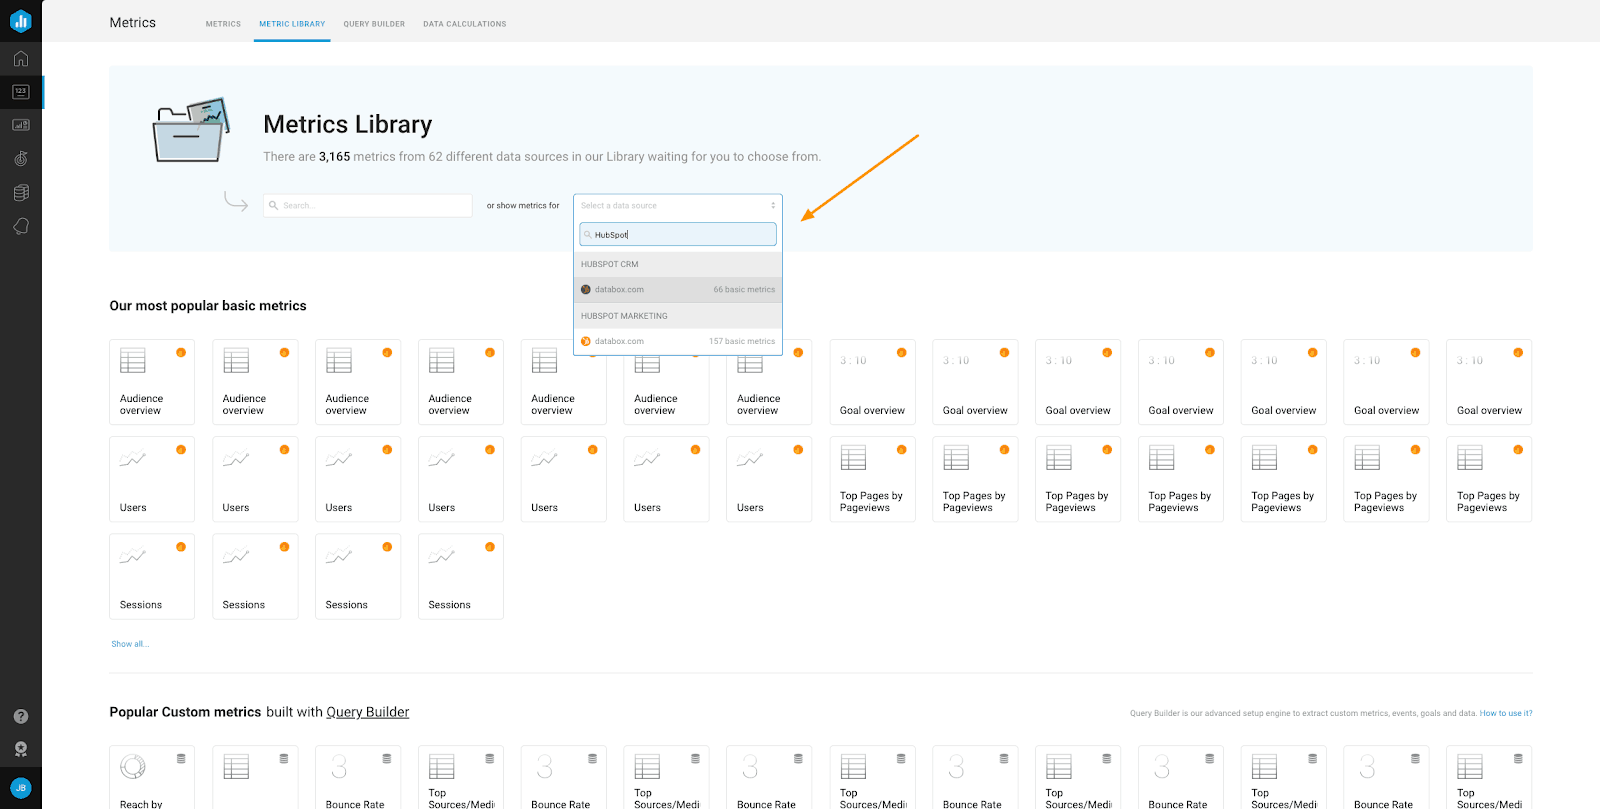
…or view all available metrics from a specific integration, like HubSpot.
Once you find a desired metric, click on the metric and choose “Add to My Metrics”.
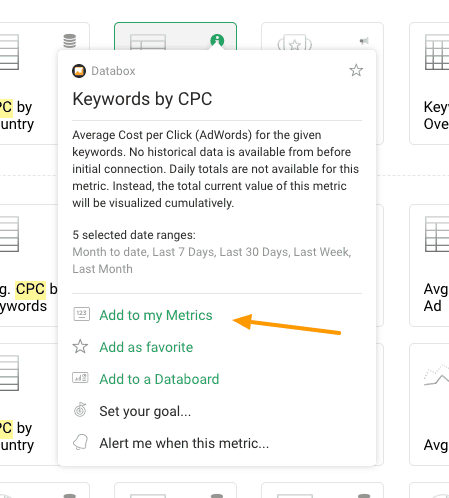
Done. Now you’ll instantly see your data on the Metrics screen in Databox.
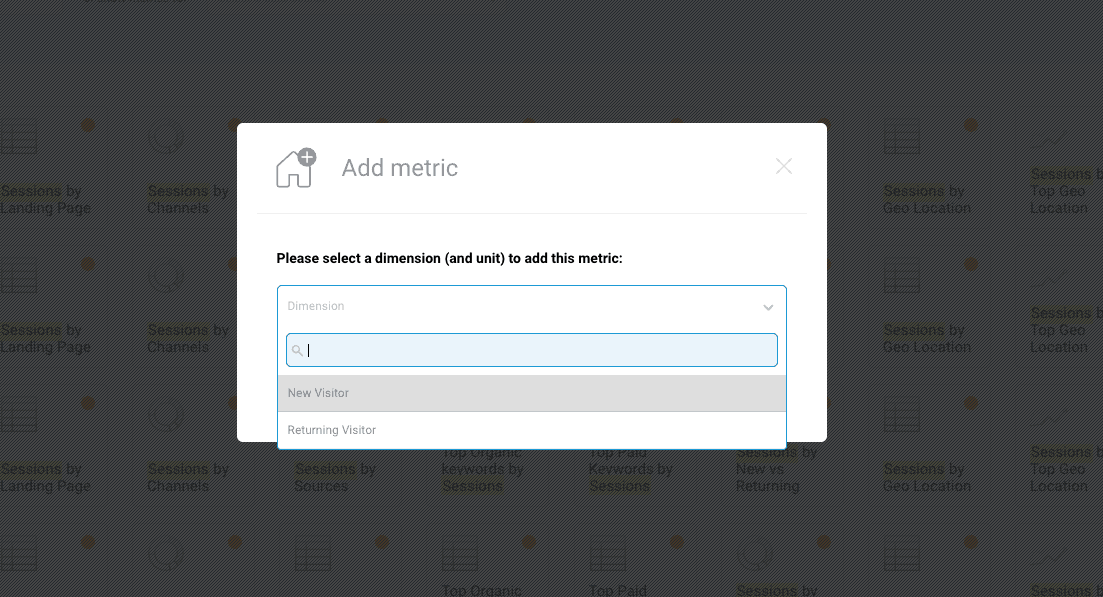
If you select an Attributed Metric (metrics that contain dimensions, i.e. “Sessions by New vs. Returning Visitors”), you’ll be asked to select the specific dimension you’d like to include with your chosen metric before adding it to the Metrics screen.
Customize Your Own View
Once you’ve added loads of metrics to your Metrics screen, there are several ways to customize your screen so that it’s easy to quickly monitor your metrics every day.
Rearrange your metric blocks
First, you can easily reorder your metrics simply by clicking and dragging any metric block to a desired location.
Change time intervals
You can also change the time interval for any specific metric by clicking the dropdown menu on the metric block itself…

…or change the time interval for all of your metrics with one click using the dropdown on the sub-navigation on the top right.

Tag and organize your metrics
The easiest way to keep all of your metrics organized and easily discoverable is by adding tags to each metric.
Tags allow you to categorize your metrics based on things like department, teams, individual, or whatever other custom tags you’d like.
Just select the tag icon on the bottom right of any Metric card to tag the Metric accordingly.
Want to tag multiple metrics at once? Click the checkbox on the top left of any metric card to select multiple metrics to tag.
Collaborate With Your Team
The Metrics screen is even more powerful when your team is using it, too. This makes it easier to align everyone around the right metrics and gives everyone one central location to view how performance is trending in key areas.
The best part? While dashboards are the same for everyone, the Metrics screen ensures every member of your team has their own personalized view of the metrics that matter most to them.
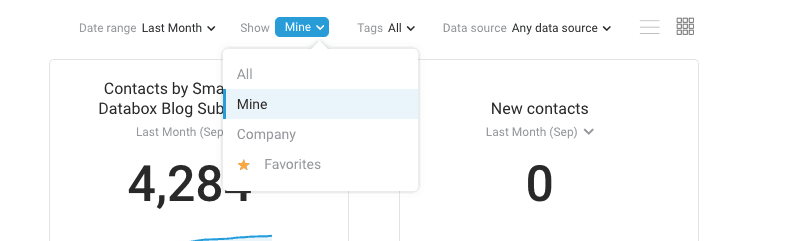
You and members of your team can filter metrics by “Mine”, “Company”, and ‘Favorites” or any of the various tags your team has created in order to quickly find and track specific metrics.
PRO TIP: How Are Users Engaging on My Site? Which Content Drives the Most Online Activity?
If you want to discover how visitors engage with your website, and which content drives the most engagement and conversions, there are several on-page events and metrics you can track from Google Analytics 4 that will get you started:
- Sessions by channel. Which channels are driving the most traffic to your website?
- Average session duration. How long do visitors spend on your website on average?
- Pageviews and pageviews by page. Which pages on your website are viewed the most?
- Total number of users. How many users engaged with your website?
- Engagement rate. Which percentage of your website visitors have interacted with a piece of content and spent a significant amount of time on the site?
- Sessions conversion rate. How many of your website visitors have completed the desired or expected action(s) and what percentage of them completed the goals you’ve set in Google Analytics 4?
And more…
Now you can benefit from the experience of our Google Analytics 4 experts, who have put together a plug-and-play Databox template showing the most important KPIs for monitoring visitor engagement on your website. It’s simple to implement and start using as a standalone dashboard or in marketing reports!

You can easily set it up in just a few clicks – no coding required.
To set up the dashboard, follow these 3 simple steps:
Step 1: Get the template
Step 2: Connect your Google Analytics account with Databox.
Step 3: Watch your dashboard populate in seconds.
Take Action with Your Metrics
In addition to making it easier to track all of your most important metrics in one place, we’ve also made it easy for you to take action with all of the metrics saved to your Metrics Screen.
Here’s what you can do with each metric directly from the Metrics Screen in Databox.
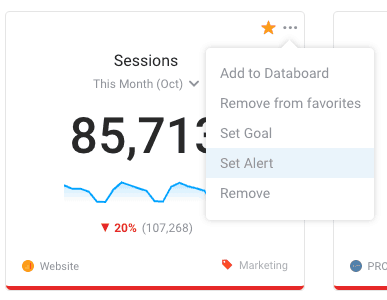
Add to Favorites
Want to add metrics from your Metric Screen to your home screen in Databox so that you see the most critical metrics as soon as you login?
Simply click the star icon on the top right of any metric block and these metrics will automatically display on your home screen.

Add to a Databoard
Any time you want to quickly add any metric block to a specific Databoard in your account (or even create a new Databoard using any metric block), click the menu icon in the top right of any metric block and select “Add to Databoard.”
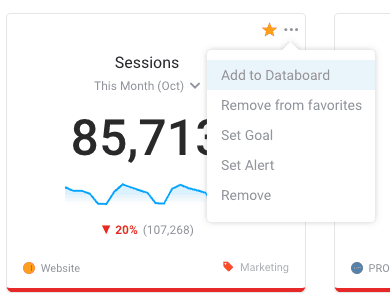
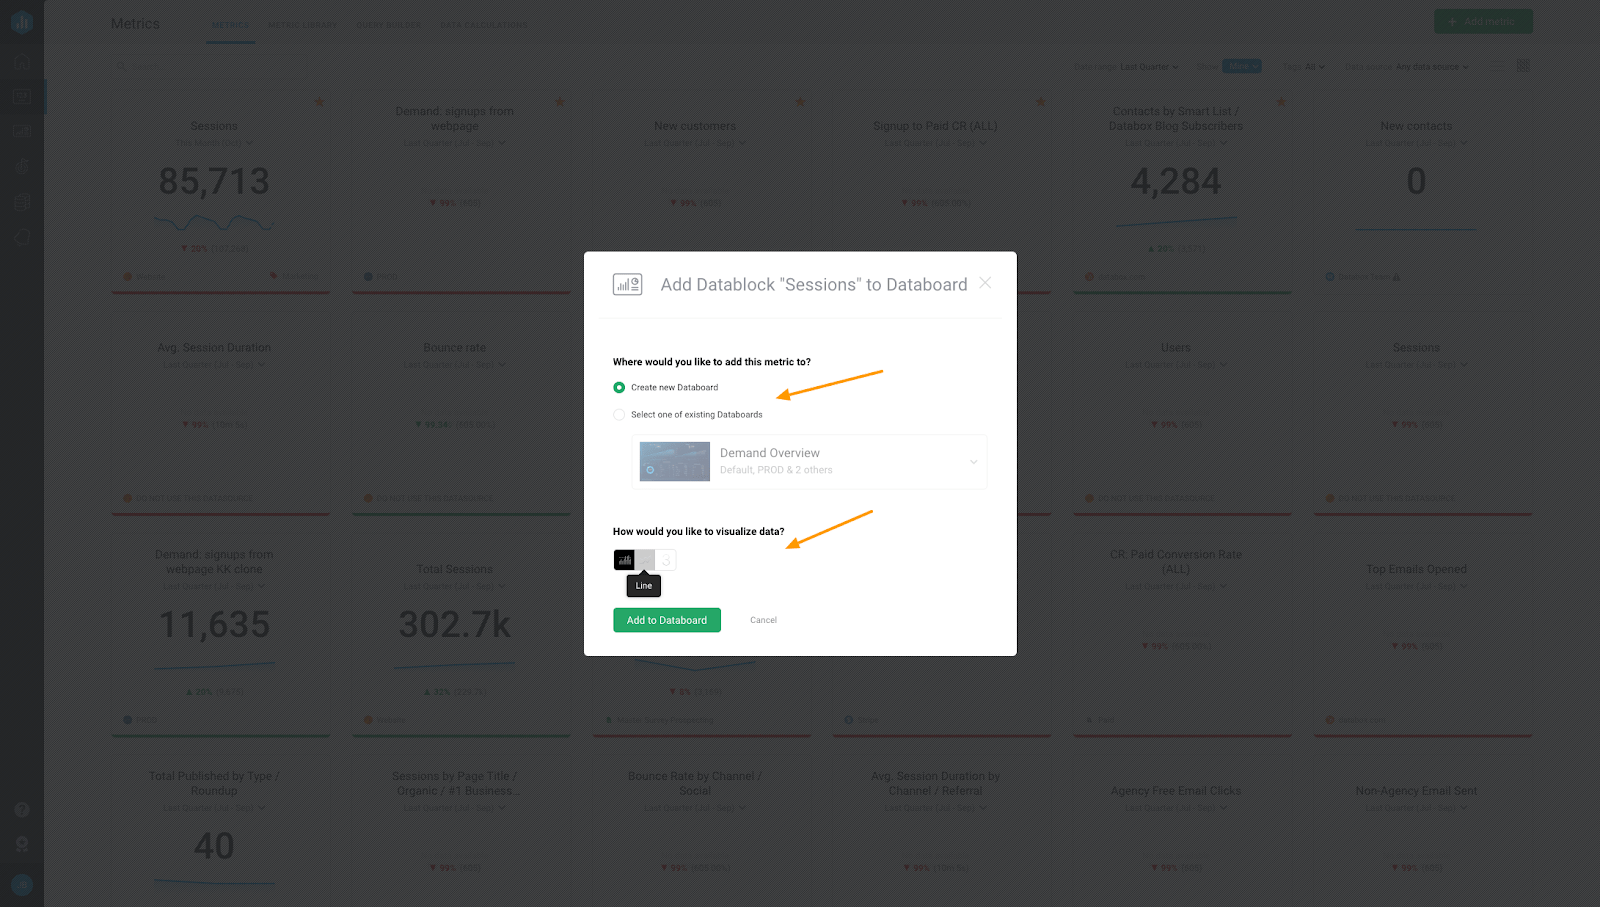
From there, you’ll be able to choose a specific Databoard to add this metric to or create a new Databoard using this metric.
Also, you can select the visualization type you’d like to use when adding this metric to the appropriate Databoard.
To add multiple metrics to a Databoard at once, just select multiple metrics and click the blue button.
Set a Goal
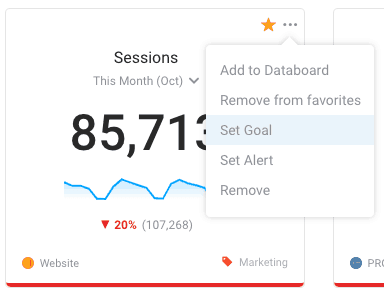
Want to set a goal so you and your team can visualize your progress towards improving a specific metric?
Click the menu icon atop any metric block and select “Set Goal.”
This will allow you to set the parameters for the goal (goal value, frequency, etc.) directly from the Metrics Screen.
Set an Alert
What good is a goal if you’re not always aware of how you’re trending towards that goal, amirite?
Set performance alerts for any metric directly from the Metrics Screen by selecting “Set Alert” from the menu icon on the appropriate metric block.
Using ‘My Metrics’ Inside the Databoard Designer
To make it even easier to use the Metrics you’ve saved, we’ve implemented a new section in the left-hand panel of the Databoard Designer where users can see the metrics they (or other users in their account) have saved.
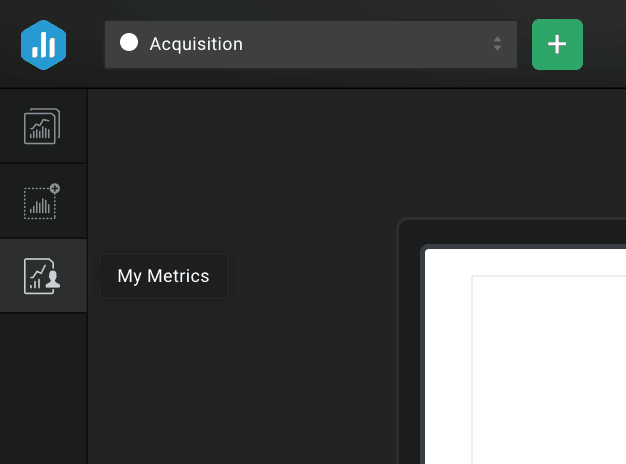
Every metric you save to your Metrics Screen will display here along with any corresponding tags you’ve added to the metrics (i.e. Website, Product, Customer Support, Sales, etc.)
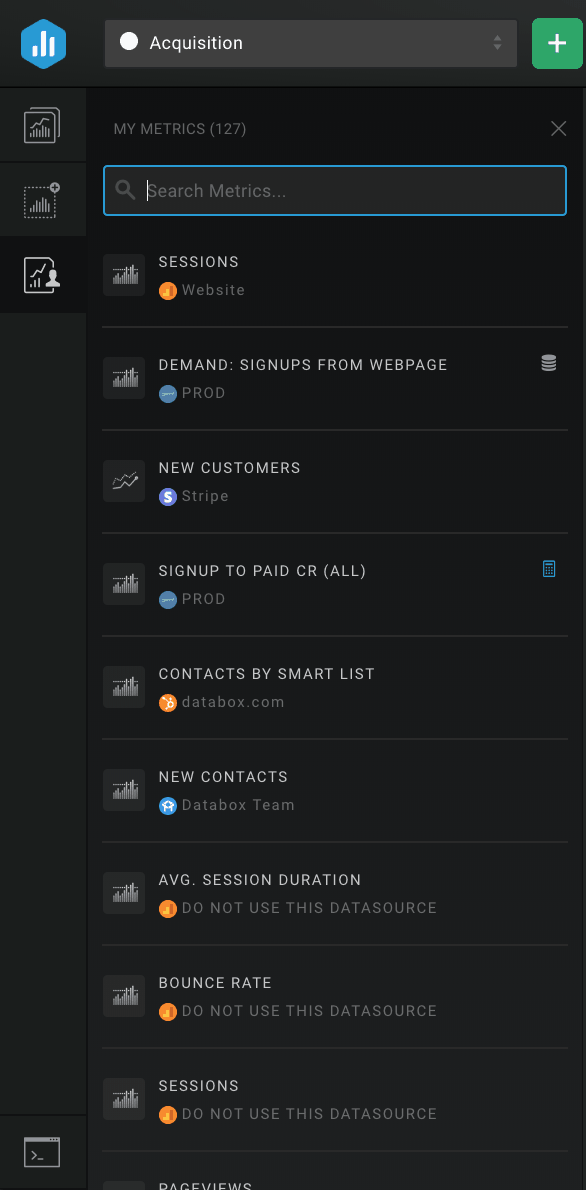
Searching within ‘My Metrics’
Now, we know what you (might) be thinking.
“Well, friends at Databox, I plan on saving a lot of metrics across various departments to my Metrics Screen. Won’t it be a pain to find each one in this tab?”
Good question. And nope. We’ve improved the search functionality in order to allow you to filter by tags. Just type the tag, i.e. “Marketing”, in the search field and you’ll only see “Marketing” metrics.
This makes it super easy to find the right metrics to drop into your Databoard.
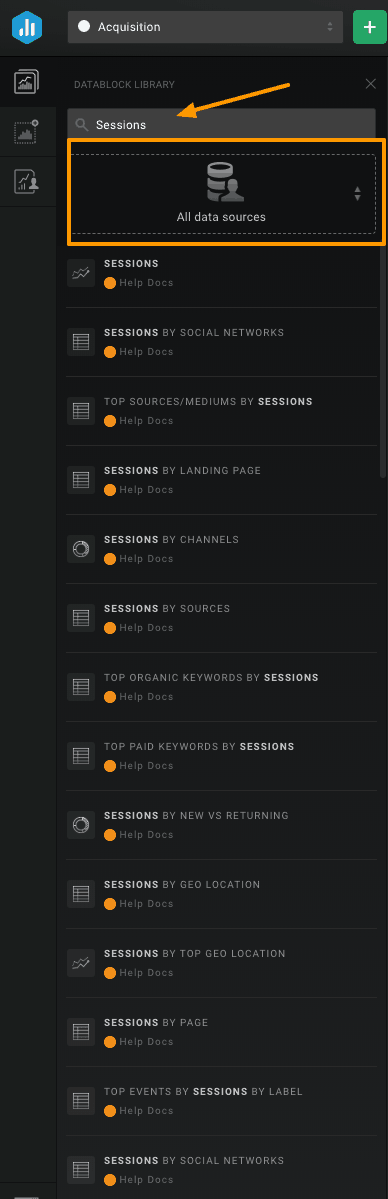
Updated Search Functionality for Datablock Library
We also made a small but powerful change to the Metric Library panel (where all of the pre-defined Datablocks are located.)
Now, rather than searching for metrics within the silo of each individual data source, you can search for metrics across all of the available metrics in Databox.
Rather than selecting a specific data source in the selector, choose “All data sources” and search for the metrics you need.
Start by Organizing Your Metrics Screen
For current Databox users, log in to your Databox account to start organizing your Metrics Screen.
New to Databox? No problem. Start by creating your free account. From there, you’ll be able to connect your data, add metrics to your metrics screen, collaborate with your colleagues, and much more.


