Table of contents
Well, actually, if you include all the different dimensions you can filter those metrics by, it comes out to 522 new metrics that you can use to report on your Facebook ad performance.
How many views did your video advertisement receive?
How many people added payment info after seeing your ad? And from which ones?
How many people added your product to their cart?
With the new Facebook Ads Action Type metrics that are now available in Databox’s Query Builder, you’ll have less questions and more answers.
*What’s Query Builder? It’s an advanced funcionality built within Databox that allows you to customize specific metrics by dimensions and other objects in order to dig deeper into your performance data.
What are Facebook Ads Action Metrics?
An ‘action’ on Facebook Ads is simply any activity that occurs when someone is viewing your ad.
It’s every comment, like, video view, link clink, add to cart, and more.
While you’re able to track all your ad actions in Facebook itself, it’s time consuming and challenging when you’re trying to compare your ad engagement from Facebook to engagement from other paid channels. (How else would you prioritize which channels to invest more/less in?)
With the new Facebook ‘action type’ metrics now available in Databox, you can measure campaign engagement more easily.
PRO TIP: What’s the overall engagement of your ad campaigns?
Want to make sure your Meta ads are performing and trending in the right direction across platforms? There are several types of metrics you should track, from costs to campaign engagement to ad-level engagement, and so on.
Here are a few we’d recommend focusing on.
- Cost per click (CPC): How much are you paying for each click from your ad campaign? CPC is one of the most commonly tracked metrics, and for good reason, as if this is high, it’s more likely your overall return on investment will be lower.
- Cost per thousand impressions (CPM): If your ad impressions are low, it’s a good bet everything else (CPC, overall costs, etc.) will be higher. Also, if your impressions are low, your targeting could be too narrow. Either way, it’s important to track and make adjustments when needed.
- Ad frequency: How often are people seeing your ads in their news feed? Again, this could signal larger issues with targeting, competition, ad quality, and more. So keep a close eye on it.
- Impressions: A high number of impressions indicates that your ad is well optimized for the platform and your audience.
- Amount spent: Tracking the estimated amount of money you’ve spent on your campaigns, ad set or individual ad will show you if you staying within your budget and which campaigns are the most cost-effective.
Tracking these metrics in Facebook Ads Manager can be overwhelming since the tool is not easy to navigate and the visualizations are quite limiting. It’s also a bit time-consuming to combine all the metrics you need in one view.
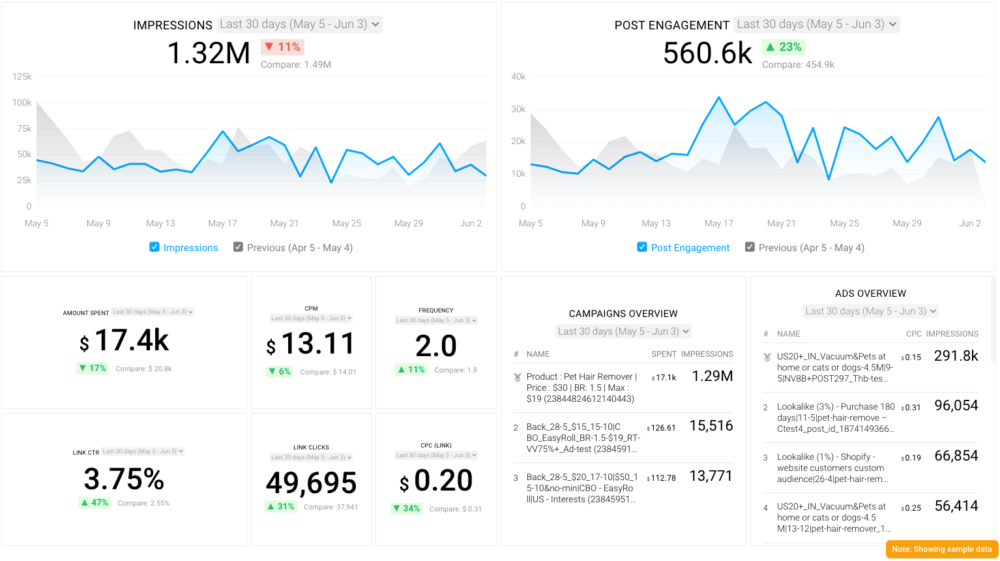
We’ve made this easier by building a plug-and-play Facebook Ads dashboard that takes your data and automatically visualizes the right metrics to give you an in-depth analysis of your ad performance.
With this Facebook Ads dashboard, you can quickly discover your most popular ads and see which campaigns have the highest ROI, including details such as:
- What are your highest performance Facebook Ad campaigns? (impressions by campaign)
- How many clicks do your ads receive? (click-through rate)
- Are your ad campaigns under or over budget? (cost per thousand impressions)
- What are your most cost-efficient ad campaigns? (amount spent by campaign)
- How often are people seeing your ads in their news feed? (ad frequency)
And more…
You can easily set it up in just a few clicks – no coding required.
To set up the dashboard, follow these 3 simple steps:
Step 1: Get the template
Step 2: Connect your Facebook Ads account with Databox.
Step 3: Watch your dashboard populate in seconds.
Which Facebook Ads Metrics Were Added to Query Builder?
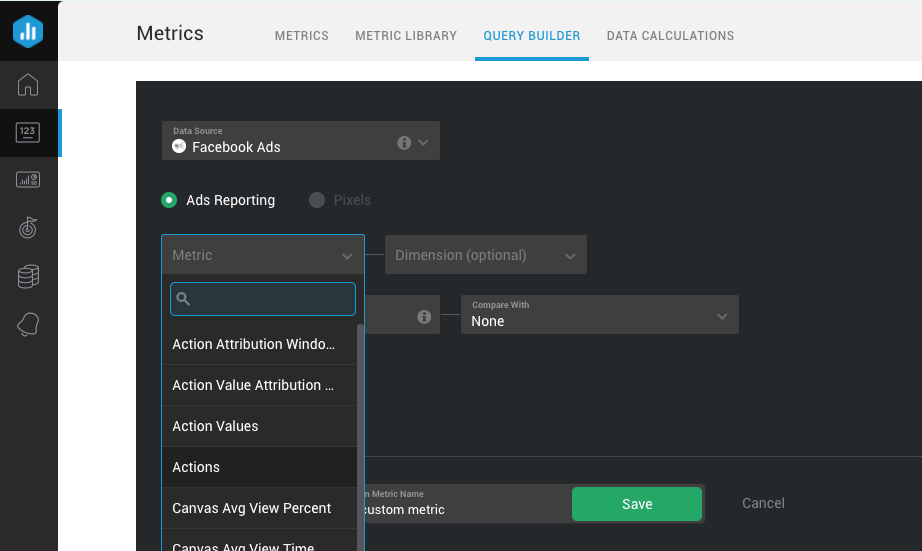
We’ve added an Action field in the Metric dropdown in Query Builder. Once you select Facebook Ads as your data source, this will allow you to access action types.

Here are all the Facebook Ads Action Type metrics that we’ve added to Query Builder as well as the associated dimensions that you can use to dig for even deeper insights..
- Post Comments
- Post Saves
- Adds Payment Info
- Adds to Cart
- Adds to Wishlist
- Initiates Checkout
- Purchases
- Searches
- Views Content
- Page Photo Views
- Post Shares
- Post Reactions
- 3-Second Video Views
- Custom Conversions defined by the Advertiser
- Onsite Conversion
- Onsite Conversion Lead Grouped
- Leadgen Grouped
- Add Payment Info
- Omni Add to Cart
- Add to Wishlist
- Omni Initiated Checkout
- Omni Purchase
- Omni Search
- Omni View Content
- Add to Cart
- Initiate Checkout
- Purchase
- Search
- View Content
And the best part? They can be further filtered by these dimensions:
- Ad
- Ad Set
- Age
- Age & Gender
- Campaign
- Country
- Device Platform
- Dma
- Frequency Value
- Gender
- Hourly Stats Aggregated By Advertiser Time Zone
- Hourly Stats Aggregated By Audience Time Zone
- Impression Device
- Place Page Id
- Placement
- Product Id
- Publisher Platform
- Region
Getting Started
For current Databox users, log in to your Databox account to check out the additional Facebook Ad metrics.
New to Databox? Start by creating your free account. From there, you’ll be able to connect your data from more than 70 different platforms.
If you have any questions or need help getting set up, you can visit our Knowledge Base or send us a message at help@databox.com and let us know which metrics you’re looking to track.


