


Table of contents
Have you been running Facebook ads, but aren’t sure how well they are doing? Perhaps you aren’t tracking the right metrics?
Admittedly, there are a lot of ad metrics to select for tracking, which can get super confusing, super fast.
What you can do though is understand your ad campaign’s goal and select metrics based on that. But, to make this easy for you further, we asked 35 Facebook ad experts for the top metrics they keep a note of.
So, in this guide, let’s learn which Facebook ad metrics are popular among the pros. On the whole, you’ll get a scoop of the following:
- How do you track metrics in Facebook Ads?
- The 13 Most Important Facebook Ad Metrics Every Advertiser Should Track
- How to track Facebook Ad metrics in Databox
- How to set automated notifications for those metrics and why

How Do You Track Metrics in Facebook Ads?
The metrics you want to track will show up as soon as your ad is live in your Facebook Analytics dashboard.
To begin with, go to Ads Manager to create a campaign. Once done, select your objectives for the campaign. For instance, Brand Awareness in this example:

When your ad is live, you can track all your metrics with your Facebook Analytics dashboard. You’ll see that each ad has different metrics that you can track to understand how well you’re performing and make decisions based on that.

PRO TIP: What’s the overall engagement of your ad campaigns?
Want to make sure your Meta ads are performing and trending in the right direction across platforms? There are several types of metrics you should track, from costs to campaign engagement to ad-level engagement, and so on.
Here are a few we’d recommend focusing on.
- Cost per click (CPC): How much are you paying for each click from your ad campaign? CPC is one of the most commonly tracked metrics, and for good reason, as if this is high, it’s more likely your overall return on investment will be lower.
- Cost per thousand impressions (CPM): If your ad impressions are low, it’s a good bet everything else (CPC, overall costs, etc.) will be higher. Also, if your impressions are low, your targeting could be too narrow. Either way, it’s important to track and make adjustments when needed.
- Ad frequency: How often are people seeing your ads in their news feed? Again, this could signal larger issues with targeting, competition, ad quality, and more. So keep a close eye on it.
- Impressions: A high number of impressions indicates that your ad is well optimized for the platform and your audience.
- Amount spent: Tracking the estimated amount of money you’ve spent on your campaigns, ad set or individual ad will show you if you staying within your budget and which campaigns are the most cost-effective.
Tracking these metrics in Facebook Ads Manager can be overwhelming since the tool is not easy to navigate and the visualizations are quite limiting. It’s also a bit time-consuming to combine all the metrics you need in one view.
We’ve made this easier by building a plug-and-play Facebook Ads dashboard that takes your data and automatically visualizes the right metrics to give you an in-depth analysis of your ad performance.
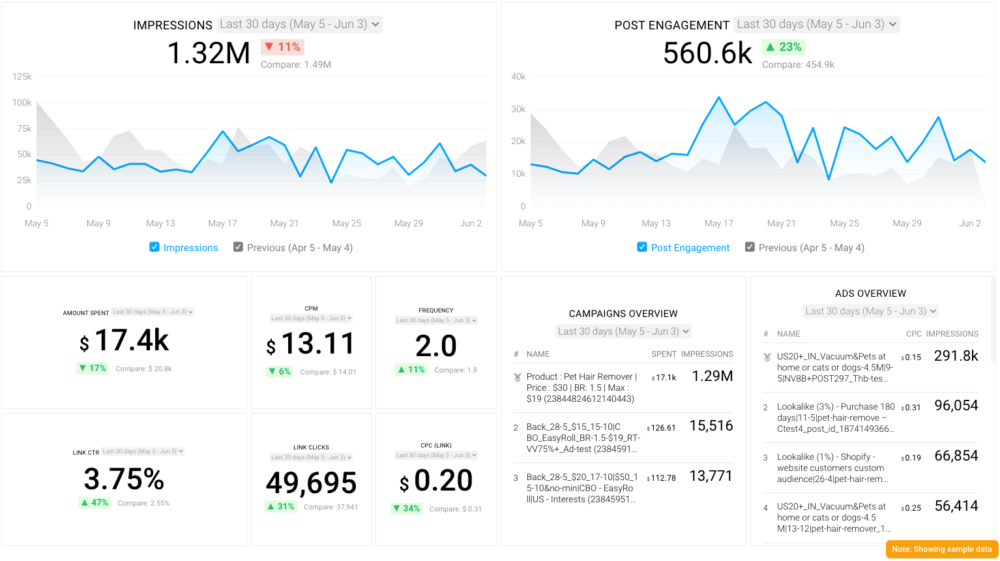
With this Facebook Ads dashboard, you can quickly discover your most popular ads and see which campaigns have the highest ROI, including details such as:
- What are your highest performance Facebook Ad campaigns? (impressions by campaign)
- How many clicks do your ads receive? (click-through rate)
- Are your ad campaigns under or over budget? (cost per thousand impressions)
- What are your most cost-efficient ad campaigns? (amount spent by campaign)
- How often are people seeing your ads in their news feed? (ad frequency)
And more…
You can easily set it up in just a few clicks – no coding required.
To set up the dashboard, follow these 3 simple steps:
Step 1: Get the template
Step 2: Connect your Facebook Ads account with Databox.
Step 3: Watch your dashboard populate in seconds.
The 13 Most Important Facebook Ad Metrics Every Advertiser Should Track
According to this Databox’s state of Facebook ads performance report, agency respondents reported monitoring Facebook ad campaign results daily (around 62%) and at least weekly (around 30%). Below you’ll find 13 metrics that our expert respondents call their top Facebook Ad metrics to track. These metrics include:
- Ad impressions
- Relevance score
- Geographical location
- Audience demographic
- Cost per Result
- Video views and Video percentage watched
- Engagement
- Result rate
- Click-through rate
- Frequency
- Cost per Conversion
- Conversion rate
- Return on Ad Spend (ROAS)
- Bonus: Monitor Facebook ads metrics in unison
1. Ad impressions
The Facebook ad impression metric “shows the number of times your ad was viewed,” notes Oliver Andrews of OA Design Services.
Beyond Big Blue Digital Marketing Agency’s Jessica Johnson adds, “each impression equals a view by an online user.”
So, why do impressions matter anyway? Johnson explains: “impressions may not always yield conversions but they do carry a lot of firepower in that it can take one powerful impression with a thoughtful creative design and a strong call to action (CTA), or it can sometimes take an increasingly large number of impressions to be successfully delivered before a user finally takes action on an ad that calls out to them.”
Sarah Franklin of Blue Tree AI reminds of the Marketing Rule of 7 for explaining the significance of monitoring this metric.
Franklin notes, “it takes seven views for the average user before taking the next step. With so much content available online and social media sites getting your ad or content seen by the same user multiple times can be tricky. If you can keep impressions high, then you are more likely to get users to engage and become customers.”
Andrews also points out that tracking ad impressions is particularly important for “those running a brand recognition campaign, as it reveals the level of exposure of your brand.”
Wondering what a good number of impressions is for a Facebook Ads campaign?
According to Databox’s own Benchmark data, the median value for Facebook Ads impressions for B2B companies is 199.28K (monthly).
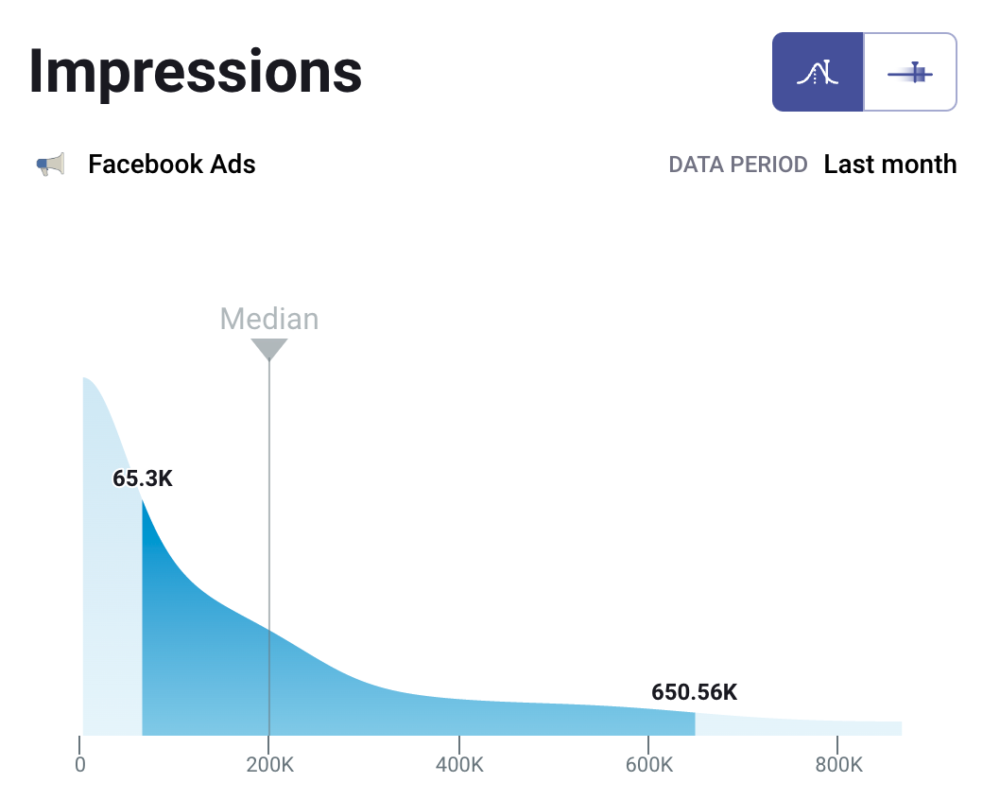
For B2C, the median value is 245.22K.

Related: Facebook Ad Impressions: Definitions, Benchmarks, and Ways to Improve
2. Relevance score
This is another trusty metric to keep an eye on. Essentially, “the relevance score is a rating from 1 to 10 that estimates how well your target audience is responding to the ad,” explains Brandon Amoroso of electrIQ marketing.
“The higher the score, the better your ad is reaching your targeted audience.” This is exactly why it’s important to track this Facebook ad metric.
Brandlift Digital Marketing’s Brandon Loures notes the score is essential as it tells “how your ads are being received by your target audience… If you have a low relevance score out of the gates, Facebook is going to charge you a premium to serve that ad which will lead to higher CPMs, higher CPCs and higher costs per conversion.”
3. Geographical location
Chris Gadek of AdQuick highlights another metric to track. Gadek observes, “geographic location is extremely important, especially if you have other marketing strategies in place in those areas as well.”
Of course, “some campaigns may work better in some regions than others, so to be successful and gain pertinent information, it can be helpful to keep a close eye on this metric.”
4. Audience demographic
Commusoft’s Cristina Maria reveals, “we try to focus more on the quality of the audience we get, whenever we do Facebook Ads, and less on the sheer numbers.”
To get an idea of the audience quality though, Maria says, “we track the audience demographics carefully and try to adjust the targeting to be as accurate as possible.”
That makes sense considering their industry. “Seeing as we have our own niche (SaaS for field service businesses), sheer traffic to our website wouldn’t be worth the cost if it wasn’t qualified,” Maria continues.
5. Cost per result
“The Cost per Result is the total amount spent divided by the total number of results, which results in the very real evaluation and coming to Jesus moment where you know if your campaign worked well or not so well,” Jessica Johnson of Beyond Big Blue Digital Marketing Agency notes.
Admittedly, this makes cost per result an essential metric to track. In Johnson’s words, “it is so important to evaluate if Facebook is the right platform for your client and if it performs well to support their objective and budget.”
Not to forget, “this ad metric shows how cost-efficiently you have accomplished your objectives set in a specific ad campaign,” Rob Madelain of RankSoldier highlights.
StableWP’s Djordje Milicevic also adds, the cost per result metric “essentially measures how effective and efficient your Facebook campaigns [are] in monetary value” as “[it] shows the average cost of achieving your campaign goals.”
No wonder, “tracking your Cost per Result can show success but also an early warning sign of performance issues.”
In general, Bruce Gingrich of Gingrich Builders notes, “the lower we can get a cost per result, based on the landing page views or link clicks, the better outcome we see!”
6. Video views and video percentage watched
For those of you running video campaigns, your video views are an essential metric to track. Why? Because it shows how engaged your audience is.
PupDigital’s Daniella Pozzolungo shares, “this shows the most engaged video viewers which you can also remarket to with more targeted ads.”
However, video views alone are not enough. You need to track the video percentage watched to understand exactly how interested the viewer was.
Bannersnack’s Bernadett Dioszegi explains, “Video Percentage Watched (video plays at 25%, 50%, 75%, 95%, 100%) – in case you are running some video campaigns this is an essential metric to track. It indicates the number of times your video was played at …% of its length, including plays that skipped to that point. It measures how catchy is your video, how relevant is your ad to your targeted audience.”
7. Engagement
Call it user engagement, audience engagement, or post engagement, it all boils down to how your audience is receiving your ad.
Maxburst’s Andrew Ruditser explains the significance of tracking engagement: “this is a very important metric to track because if users aren’t engaging with your post, then you aren’t grabbing their interest.
“If more users engage with your post, they will share and increase your impressions,” Ruditser adds.
Yasir Shamim of PureVPN also notes how the engagement metric helps answer important questions related to your ad campaign: “are your users interacting with your ad content? Do they like, share, comment on it? If people are not very enthusiastic about your offer, apparently something is wrong, and you should optimize your campaign or recheck your targeting settings.”
This is why a lot of the experts we talked to including Natalia Manolescu of Stoica.co
track it: “post engagement (total number of reactions, shares, comments and clicks the post received) alongside CTR – when A/B testing different ad types help me determine how well that ad appeals to my target audience.”
Related: How to Improve Your Post Engagement on Facebook Ads
8. Result rate
Stanford Mead of Summit Home Buyers, LLC shares the result rate as another “most important Facebook Ads metric” to pursue.
Mead elaborates, “this metric is reported as a percentage, taking two things into account:
- The number of people who viewed your ad
- The number of people who clicked your ad.
If your Result Rate is high, it means that the ad is getting attention and performing well. If your Result Rate is low, it may be time to remove the ad or edit it to get better results.”
9. Click-through rate
“This metric displays the click-to-impression ratio for separate ads. In other words, the ratio of the number of times a person has clicked on your ad to the number of times your ad was seen on Facebook,” notes OA Design Services’ Oliver Andrews.
“This Facebook metric presents the percentage of people who click on the ad of all the people who have seen it. You can find this data in the campaign view in the Facebook Ads Manager,” Andrews continues.
Basically, the click-through rate is another trackworthy-metric as it determines how well your ad resonates with your target audience. Does it appeal to them enough for them to click? That’s the answer you get from this metric.
Laura Fuentes of Infinity Dish shares from experience: “if I am reaching thousands of people with an ad, but only a handful are clicking, then it tells me I need to adjust something about my ad or content.”
Wondering what CTR you should aim for?
According to Databox’s own Benchmark data, Facebook Ads CTR for any business size is 1.55%.

Benchmark Your Performance Against Hundreds of Companies Just Like Yours
Viewing benchmark data can be enlightening, but seeing where your company’s efforts rank against those benchmarks can be game-changing.
Browse Databox’s open Benchmark Groups and join ones relevant to your business to get free and instant performance benchmarks.
10. Frequency
Frequency is another Facebook ad metric that several experts measure. Frequency is, in Facebook’s words, ‘the average number of times each person saw your ad over the lifetime of your campaign’.
And, it’s vital so you can watch out for ad blindness. “Ad blindness is when your ad appears an excessive amount of times on a person’s feed. When this happens they start to just ignore your ad,” explains Alex Rouse of All My Web Needs.
This concern is also referred to as “ad fatigue” or “banner blindness” according to Ben Carew of Webbuzz who advises, “given that the nature of Facebook Ads is display advertising and ad fatigue keeps on accelerating, ‘Frequency’ is a metric you will want to keep your eye on closely. Combined with the metric ‘First Time Impression Ratio’ and accessible via the Inspect tool at the adset level, it is possible to watch as your first time impressions plummet over the course of a campaign and your frequency rises.
At some point, when these two metrics cross (where depends on the type of campaign you are running), you will want to change up your ad creative and copy before the inevitable sets in.”
On top of all of this, a high frequency also increases ad costs. Stoica.co’s Natalia Manolescu shares, “usually, when it goes above 3-5, I’ve seen the cost per result going higher and I would either change the creatives (copy, visual, ad type) or target a new audience instead.”
Wondering when it’s a good time to check frequency?
Brad Harrison of EMBRK tells when: “if you are overspending in a campaign and leads/purchases are declining, cost per lead/purchase is rising, you want to check your frequency. If it is above a 3, I would consider pausing and creating new creative for your audience.”
And lastly, what’s an ideal Facebook ads frequency? What numbers should you aim for?
According to Databox’s own Benchmark data, Facebook Ads frequency is 2.47.

Benchmark Your Performance Against Hundreds of Companies Just Like Yours
Viewing benchmark data can be enlightening, but seeing where your company’s efforts rank against those benchmarks can be game-changing.
Browse Databox’s open Benchmark Groups and join ones relevant to your business to get free and instant performance benchmarks.
11. Cost per Conversion
Mike Charles of Unified Pest Control identifies another important Facebook ad metric to pay attention to.
Charles comments, “this is a simple well that tells how much you spent for each sale or lead. For instance, if you spent $1,000 on Facebook ads and 100 of those people converted then the cost per conversion metric would be $10.”
But be warned: “this number will vary for each industry as to what is an acceptable rate to pay.” So, make sure you know your industry rates before you go about setting standards for your ad campaign.
12. Conversion rate
“This is a key indicator of your ad campaign success,” notes PureVPN’s Yasir Shamim. “Conversion Rate represents the percent of people that click on an ad and then make a purchase,” explains Unified Pest Control’s Mike Charles.
Hugo Guerreiro of BlogBizAudit shares, “I would even say conversion is the most critical metric since it will tell you if the ad viewer will become a customer, purchasing your product or service.”
Put simply, since the goal of ad campaigns is to convert a sizable portion of their audience, conversion rate is an essential metric to note.
Additionally, Leslie Allison of Robust Promotions by “focusing on conversions, you can ensure not only that you’re reaching a relevant audience, but you can also meaningfully measure return on ad spend to ensure that you’re not paying more for a conversion that makes economic sense.”
In short, keep in mind the following: “If your desired action is a purchase, then it’s not worthwhile to track irrelevant KPIs, such as clicks, installs, etc. Optimization should be directed at purchasing, and then Facebook will do its best to deliver your ads to the users who are most likely to convert,” as Shamim puts it.
13. Return on Ad Spend (ROAS)
Several of our expert respondents note ROAS as an important metric to track when running Facebook ads. As a matter of fact, nearly 60% of agencies in this study on Facebook ads set goals around ROAS.
To begin with, Matchnode’s Chris Madden clarifies, “ROAS is an acronym for Return on Ad Spend, simply the revenue that came from the ads divided by the amount spent on the ads.”
“Basically, that is the number of dollars in versus the number of dollars out.” Jeromy Sonne of Moonshine Marketing summarizes.
It’s an essential metric for: “e-commerce businesses, retailers, restaurants, and event businesses like sports and concerts,” Madden outlines. Bannersnack’s Bernadett Dioszegi put it another way, “if your campaign’s goal is increasing conversions (in this case, purchases), one of the most important metrics is purchase ROAS.”
In reality, this is the metric that gives you the best idea of your campaign’s performance. According to Directive’s Liam Barnes, ROAS “measures the profitability of your advertising based on gross revenue resulting from your ad spend.”
Meg Coffey of Coffey & Tea also shares, “it’s the only [metric] that truly tells me how well I’m doing – what my actual return for effort is.
Yes, impressions and reach are important. Link clicks are important. Yes, there is a funnel at play. But ultimately, it’s about the ROI – how many purchases have I made as a result of my ad spend.”
In fact, Jonathan Aufray of Growth Hackers shares, “when running Facebook ads, you don’t want to focus too much on video views, reach, likes or impressions. Why? Because those are vanity metrics.
If you want to grow your business, when spending money on advertising, you want to make sure that you generate a positive RoaS (Return on ad Spend). So, focus on RoaS.”
Not to forget, understanding your ROAS helps plan other campaigns as ClickThrough’s Lachlan Kirkwood notes.
As per Kirkwood: “understanding how profitable a campaign is will help influence future strategies and uncover conversion forecasts. As a digital marketer, it’s also essential to know what value you add to an account you manage.”
Bonus: Monitor Facebook ads metrics in unison
Some of our experts went on to share duos of metrics they track. You can follow those as well. Here are some noteworthy combinations of metrics you need to know:
Landing page views and CTR
Jordania Nelson of Divining Point recommends, “for traffic campaigns, two metrics you’ll want to track are Landing Page Views and Click-Through-Rate (CTR).”
“A landing page view,” Nelson shares is a number showing “a person land[ing] on your ad’s destination URL after clicking a link in your ad.” On the flip side, “CTR measures the ratio of clicks to impressions to help you understand your customers. It tells you what does and doesn’t work when trying to reach your target audience, and can help you make adjustments to your ads that will resonate with your target audience.”
CTR and bounce rates
Trevor Blessinger of Art of The Gentleman suggests, “both of these metrics need to be monitored in unison to understand if you need to focus more on your landing page or your ad copy.”
So what does each do? “Click Thru Rate is great for indicating if the ad images and copy are resonating well with the target audiences.” On the other hand, “Bounce Rates are often indicative of how successfully your website can maintain that initial attention your ad grabbed.”
CPC and leads
LiveSession’s Kamil Drazkiewicz shares, “to us, the number of leads and cost-per-click are the most important metrics you should be tracking.”
“These two numbers will tell you realistically how effective your campaign was and directly relate to your revenue and ROI. Naturally, the best-case scenario is when you note high sales and a low cost-per-click,” Drazkiewicz adds.
“If you’re selling a $3000 product, you might be happy if your cost per click is $200. However, if your product costs $100, and you paid half of that to fund the campaign, the results won’t be all that impressive. Even if you’re reached thousands of clicks and an impressive number of likes.”
How to track your Facebook ad metrics in Databox
Sometimes just looking at your Facebook Ads metrics in Facebook Ads just isn’t enough and you need a bigger picture, one that includes metrics from other sources that you may be using as well.
With Databox you can track and visualize your data more easily. For free.
In the Metrics library you’ll find 96 basic metrics that are ready for you to track. And the best part is, they all come with pre-built visualizations, meaning all you need to do is drag-and-drop them into your social media dashboard to visualize your performance.

How to set automated notifications for those metrics and why.
How are you planning to share reports with your team, management, clients? Databox Notifications are here to help keep everyone in the loop of what’s happening and how the path towards their goals is progressing.
By setting Scorecards, Scheduled Snapshots and Alerts, you’re always on top of your data and are able to act when it matters most, right now.
Don’t wait until the end of the month or quarter to know how your performance is trending. Be notified every day.
And because they can all also be sent directly to Slack, you’re guaranteed to keep the conversation going or even spark some ground breaking ideas right then and there.
You can find and set up your Notifications in Databox for free.

Scorecards allow you to include up to 15 of your KPIs and send them out in a numeral view, giving you full visibility at-a-glance.

With Scheduled Snapshots you’se sending out a whole dashboard. Not only do they provide a bigger picture, they also allow the viewers to change the Date Ranges on them and compare the data themselves.

And by setting up Alerts, you make sure you never miss an important performance trend ever again. If you’re under or even over performing, a Databox alert will let you know either on your email, Slack or mobile, while still having enough time to turn things around and make sure the Goals for your CTR, Conversion Rate, ROI and all the other important Facebook Ads metrics are reached and on point.

We recommend that you also set up Goals for the Facebook Metrics that matter most to you – by doing so, the Alert is automatically included. You can set it to be alerted if it seems like it won’t be reached after 70% of the time has already passed.
Ready to measure the best metrics for your Facebook ad campaigns?
Hopefully, these 12 metrics would’ve given you an idea of the metrics that people popularly track. But before you pick the ones that best suit your ad campaign, go on to do what GetEmails’ Adam Robinson rightly points out, “ask [yourself] what’s the purpose of the campaign and then define the most important” metrics.


