


Already have an account? Sign in
Sign up for free
Connect your datasources and instantly see your data in this template.
Creating your account...
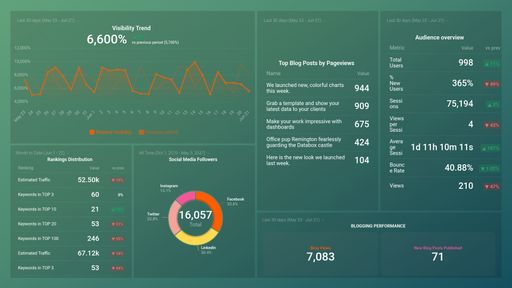
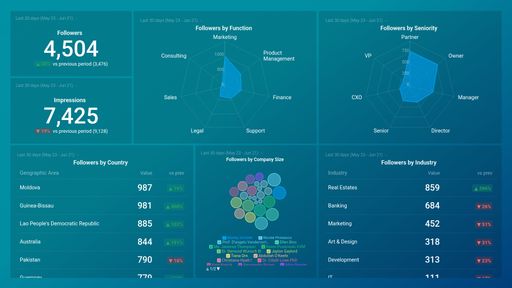
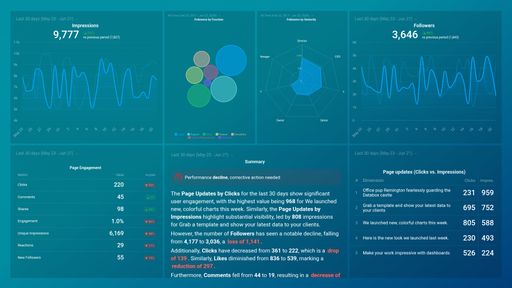
A LinkedIn dashboard pulls and visualizes your LinkedIn data, helping you understand and monitor how your content performs, if you’re reaching your target audience, and the level of engagement with your LinkedIn content. Insights provided by your LinkedIn dashboard can guide your social media content strategy and ensure that you hit all your goals.
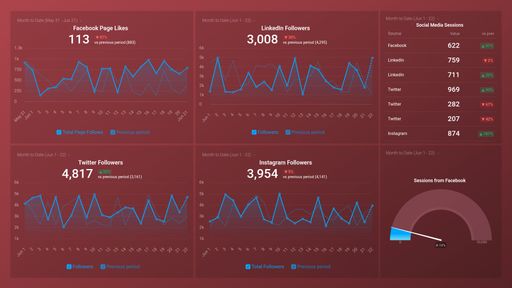
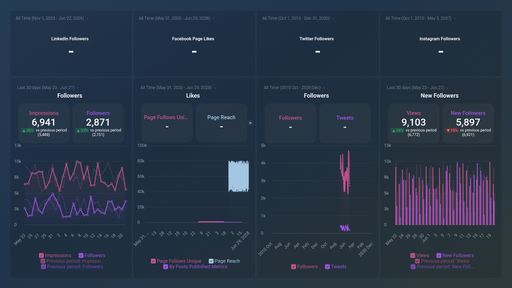
Your LinkedIn dashboard should contain all of your most relevant KPIs and metrics, such as Impressions, Link Clicks, Engagement, Social Actions, Engagement Rate, Followers Gained, Number of Posts, and more. By being able to monitor this data at a glance, you will have a holistic overview of all your social media efforts invested and gained on this network.


Drag & drop your metrics
No-code editor
Fully customizable
Trusted by 20,000+ growing businesses


Explore all the different ways you can use Databox to gain better data insights needed to drive better business decisions. Discover our pre-built templates from various integrations that businesses use on a daily basis to improve performance.
Whether you are looking for client reporting dashboards, agency dashboards, marketing dashboards, or sales dashboards, Databox can help you build them.
Let us know what you are trying to build and our team of experts will help you turn your data into actionable insights.
Book a callCompare
Databox Inc.
HQ: Boston, MA, USA
AI-powered analytics for teams that need answers now.
Databox Inc.
HQ: Boston, MA, USA

AI-powered analytics for teams that need answers now.


Compare
Connect your datasources and instantly see your data in this template.
Creating your account...