


Table of contents
Managing a Shopify store comes with a lot of moving parts, and it can be tricky to keep track of how your store is performing. Fortunately, Shopify reports give you access to valuable data that can help you make informed decisions. These reports provide insights into how customers find your site, what they’re purchasing, how much they’re spending, and more.
Shopify, ranked 4th among global e-commerce platforms with a 10.32% market share globally and a 29% share of the U.S. e-commerce platform market, powers approximately 4.63 million websites, 62% of which are based in the United States, according to data from Shoptrial and Yaguara (Shoptrial, Yaguara).
If you’re not leveraging these reports, or you’re unaware of their benefits, you’re potentially missing out on opportunities to grow your business. In this guide, we’ll show you how to unlock the full potential of Shopify reports to drive smarter business decisions and boost your store’s success. You can also enhance your reporting with Databox, a tool that automates reporting and provides in-depth dashboards for data analysis.
Let’s roll the blog!
- Acquisition and Marketing Reports
- Customer Behavior and Sales Performance Reports
- Financial and Accounting Reports
- Inventory and Product Performance Reports
- Operational and Fulfillment Reports

What Are Shopify Reports?
Shopify reports are a powerful tool that provides detailed insights into your store’s performance, helping you understand how your business is operating and where improvements can be made. Every time a customer interacts with your store, Shopify captures key data points—such as traffic sources, purchase behavior, and overall sales. These metrics are then organized into easy-to-read reports that give you a clear overview of your business’s health.
While Shopify reports might initially seem like a collection of charts and numbers, they offer much more than just raw data. These reports are designed to help you make action-driven business decisions. They give you deep insights into customer behavior, product performance, marketing effectiveness, and financial metrics. By using these reports effectively, you can optimize various aspects of your store, identify opportunities for growth, and ultimately improve your store’s overall performance.
Additionally, Shopify provides customizable reports based on your store’s needs, allowing you to filter and analyze specific data points that are most relevant to your business. From sales trends to customer segmentation, Shopify reports are essential for making data-backed decisions that can drive success. Whether you’re running a small business or a larger store, a report Shopify generates can help you identify key opportunities for growth and optimization.
Related: 15 Shopify Integrations to Supercharge Your Store
Where Can You Find Shopify Reports?
Once you have created your Shopify account head to the analytics section of your dashboard. All Shopify reports are located under the Analytics section of your shop admin: Analytics –> Reports.

Related: Shopify Guide: Best Shopify Features, Metrics & Tips for Dashboards & Reporting
Customizing Shopify Reports
Creating Shopify Custom Reports
Shopify allows you to create custom reports tailored to your specific business needs. To create a custom report:
Note: Shopify custom reports are available only to stores on the Advanced Shopify plan or higher.
You can create a custom report in three ways:
1. Using a template to start with predefined filters and data columns.
2. Modifying an existing default report to suit your needs.
3. Duplicating and modifying an existing report to keep the original intact.
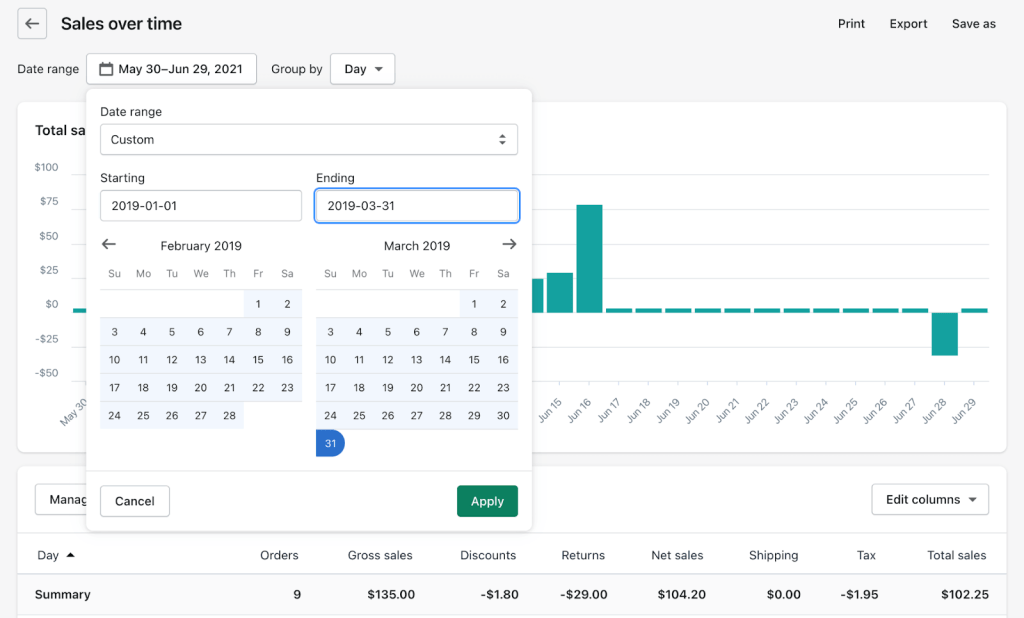
Create a Custom Report Using a Template
Templates provide a quick way to start building custom reports. Available templates include:
• Sales over time (Sales)
• Payments by method (Finances)
• Taxes collected over time (Finances)
• Sessions over time (Acquisition)
• Customers by order value (Customers)
Steps:
1. Go to Analytics > Reports in your Shopify admin.
2. Click Create custom report.
3. In the dialog box:
• Select a Report template.
• Enter a Report title.
4. Click Create custom report.
5. Add filters and edit columns to create displays of the desired information.
6. Click Save report when finished.
Custom reports are a powerful tool to tailor analytics to your specific business needs.
Exporting Shopify Reports
You can export reports for further analysis from your Shopify admin to a CSV (comma-separated values) file for further analysis. Exported files are saved to the default downloads folder on your computer.
Steps to Export a Report:
1. Open the report you want to export in Shopify admin.
2. Click Export.
3. In the Export your report dialog, click Export.
Export Options for Finances Reports:
For reports like Sales, Taxes, and Payments, you can choose:
• Current page: Exports data for only the columns currently displayed.
• Full report: Exports all data, including additional columns not visible by default.
Shopify Benchmarks
Comparing Your Store’s Performance to Similar Businesses
Databox Benchmarks provides benchmark data to help you understand how your store performs compared to others in your industry:
- The average order value for Shopify stores is $85
- Typical Shopify stores in the USA generate $67,000 per year
- Over 50% of Shopify stores benefit from repeat purchases
Use these benchmarks to set realistic goals and identify areas for improvement in your own store.
Tip: Here at Databox, we offer an app that integrates benchmarks for easy comparison and goal-setting, helping you stay on top of your store’s performance.
Related: 15 Shopify Integrations to Supercharge Your Store
Overview of Shopify Reports
Whether you’re a new online store owner or have been in this business for years, you will find Shopify reports incredibly useful. Shopify reports give you valuable data and insights about your products and customers, which will allow you to make informed decisions about your marketing campaigns, product design, sales strategy, and more.
- Shopify Acquisition Reports
- Shopify Behavior Reports
- Visitors by Landing Page Report On Shopify
- Shopify Marketing Reports
- Shopify Finances Reports
- Shopify Sales Tax Reports
- Credit Card Reports On Shopify
- Shopify Profit Reports
- Shopify Sales Reports
- Shopify Total Sales Reports
- Historic Sales Reports from Shopify
- Shopify Retail Sales Reports
- Shopify Inventory Reports
- Shopify PoS Reports
- Shopify Order Reports
- Shopify Shipping Reports
- Shopify Product Reports
- Shopify Reports On Sales by Product Type
- Shopify Reports On Products Refunded
- Shopify Accounting Reports
- Shopify KPI Reports
PRO TIP: Get Useful, Actionable Data on Your Shopify Store’s Performance
To improve the performance of your online store, it’s vital to have access to useful and actionable data. But, with so many metrics available to track, it may be hard to determine which ones will actually help you move the needle. That’s why we have created a concise Shopify dashboard template that only tracks the most important metrics for analyzing the core elements of your ecommerce store, such as:
- Orders. See the total number of orders that were placed during a specified date range.
- Sales overview. How profitable is your Shopify store? Track the total sales of all products and services through your online store daily, weekly, monthly, yearly, or within a specified date range.
- New customers and repeat customers. How effective is your store at attracting new customers?
- Shopping cart overview. Is your shopping cart set up properly? Monitor trends in the checkout process that result in abandoned carts, unfulfilled orders, and completed orders. Assess the effectiveness of your store at supporting the purchasing decisions of your visitors and repeat customers.
Now you can benefit from the experience of our Shopify experts, who have put together a plug-and-play Databox template showing the most important KPIs for monitoring your online store’s performance. It’s simple to implement and start using as a standalone dashboard or in ecommerce reports, and best of all, it’s free!

You can easily set it up in just a few clicks – no coding required.
To set up the dashboard, follow these 3 simple steps:
Step 1: Get the template
Step 2: Connect your Shopify account with Databox.
Step 3: Watch your dashboard populate in seconds.
1. Acquisition and Marketing Reports
These reports Shopify offers focus on how customers find your store and the effectiveness of your marketing efforts.
Shopify Acquisition Reports
Acquisition reports in Shopify give you insight into your traffic sources, acquisition, and sales performance. Shopify acquisition reports are available for sessions over a specific period, or for a specific referrer and location.

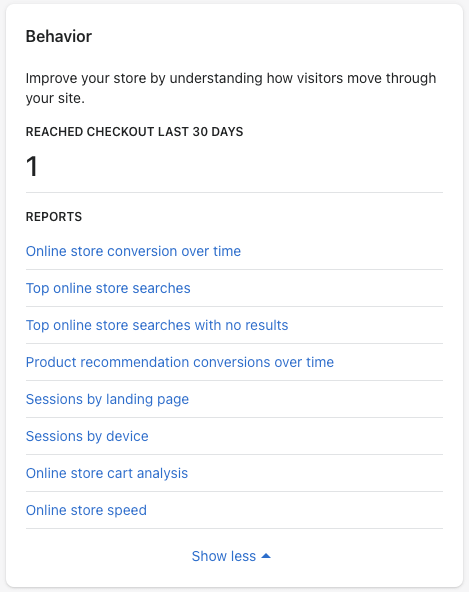
Shopify Behavior Reports
Shopify Behavior Reports allow you to analyze key metrics tied to the performance of your store and its visitors. Analyzing behavior reports can help you boost your conversion rate, and give you insights on how to optimize your checkout process.
Here are the specific reports available within Shopify behavior reports:
- Online store conversion over time
- Online store speed
- Product recommendation conversions over time
- Top online store searches
- Top online store searches with no results
- Sessions by landing page
- Sessions by device
- Online overall store cart analysis
Visitors by Landing Page Report On Shopify
Visitor by landing page report on Shopify shows where visitors land first once they visit your store. This report is especially useful to marketers as it gives some insight into your current content marketing and SEO strategy.

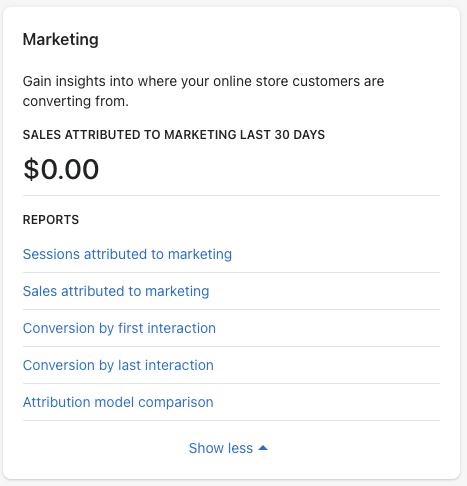
Shopify Marketing Reports
Shopify marketing reports can help you track and measure your marketing efforts. The reports tell you how much of your sales are attributed to specific channels or particular campaigns. You can compare how much traffic flows into your store from different channels, and much more.
Within these marketing reports you have the following reports available:
- Sessions attributed to marketing
- Sales attributed to marketing
- Conversion by first interaction
- Conversion by last interaction
- Attribution model comparison
- First interaction
- Last interaction
With these reports, you can measure the effectiveness of your marketing campaigns, understand how successful they are, and what you need to do to improve performance.
To measure both, ecommerce and website metrics (eg. from Google Analytics) along with Shopify, use our robust marketing reporting software.
Customer Behavior and Sales Performance Reports
These reports provide insights into customer behavior and track your store’s sales performance.
Shopify Finances Reports
Shopify Professional Reports are advanced analytics tools available for stores on the Shopify plan or higher. These reports provide deeper insights into your store’s performance compared to the basic reports available on the starter plans. They are designed to help merchants make more informed, data-driven decisions by focusing on critical areas such as sales, customer behavior, and financial metrics.
Key Features of Professional Reports
- Advanced Filtering: Apply multiple filters to narrow down specific data points, such as sales trends by location or customer segments.
- Customization: Modify existing reports to include only the metrics most relevant to your business goals.
- Historical Data Analysis: Analyze past performance over extended timeframes to identify patterns and trends.

The core financial metrics we recommend you to track within these reports are total sales and net sales.
- Total sales = gross sales – discounts – returns + taxes + shipping
- Net sales = gross sales – discounts – returns
The most important Shopify finances report is the Shopify finance summary, where you can see your sales, payments, liabilities, and actual profit. A separate report for each one of the items is available.

Shopify Sales Tax Reports
As an online seller, tax is a big part of your business. It’s also something you may not know all that much about. Good thing is that sales taxes on Shopify stores are paid when you sell or post a product or service, depending on your business setup. In the US, Canada, and EU, you need to specify the rates that apply to each location as well as charge the customer.
If you notice in the Analytics –> Reports –> Finances summary –> Taxes report, there’s a column named ‘Amount’. This is the total amount of sales tax you’ve paid during the reporting period. You can use this to create segmented reports.

Credit Card Reports On Shopify
Credit card report on Shopify is a good way to know your transactions, who paid, and how much they paid. The report has also information such as your average order value and the average number of days it takes to get paid. You can view this report in two different places: Settings –> Payments –> Payment Providers, then View Payouts.

If you accept payments through several providers, go to Reports –> Finance –> Finances Summary, to see the breakdown.

Shopify Profit Reports
The profit reports on Shopify are a great way to keep track of your profit. Shopify Profit Report is created to help you measure your gross and net profits by product, product variant, and point of sale location. These reports will help you analyze and keep track of daily, weekly, or monthly changes in your profit margin.

Do you want to find out which products are the most profitable? When you add or edit a product, Shopify automatically calculates your profit and profit margin for it. You just enter the Cost per item, and Shopify does all the rest.
Shopify Sales Reports
For businesses looking to track their revenue trends, the sales Shopify reporting tools provide in-depth analysis and insights. In Shopify, there are 11 sales reports that indicate how well your store is performing. These reports can help you determine if sales are going up or down and other key metrics like how often customers are returning to your store or where they’re coming from. Sales reports are often overlooked, but they’re useful in tracking sales performance and spotting trends.

Shopify Total Sales Reports
Total Sales is a Shopify report that gives you a complete picture of your online business’s sales. This report shows you how much money came into your Shopify account from all sources: sales, refunds, discounts, and more. Shopify uses the term ‘total sales’ to describe this unambiguous number.
The total sales report can be found under Finances reports –> Sales –> Total Sales.

Historic Sales Reports from Shopify
One of the most important aspects of running a business is being able to analyze your business’ growth trends over time. If you want to know past sales, there is an easy way of getting it: The Historic Sales Report.
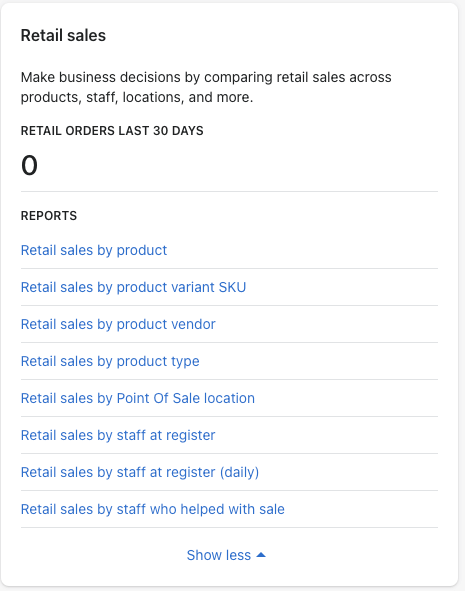
Shopify Retail Sales Reports
Shopify retail reports show you how your business is doing offline. However, note that this report is only available if you activated a Point of Sale as a sales channel on your store.
Inventory and Product Performance Reports
These reports help manage inventory and track product-specific performance.
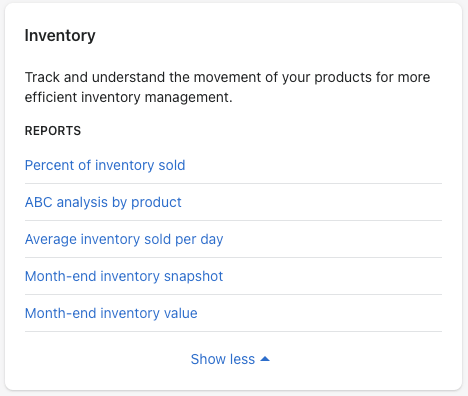
Shopify Inventory Reports
Are you monitoring your inventory carefully? Shopify inventory reports help you keep track of the remaining inventory and give you insights into what sells and what doesn’t. Each report has its own unique features, but most of them give you sales insights, such as:
- Percent of inventory sold
- ABC analysis by product
- Average inventory sold per day
- Month-end inventory snapshot
- Month-end inventory value
Shopify PoS Reports
Shopify PoS reports offer a lot of useful insights about daily sales, stats related to net sales, average order values, top products, and more.
Operational and Fulfillment Reports
These reports provide insights into order processing, shipping, and in-store performance.
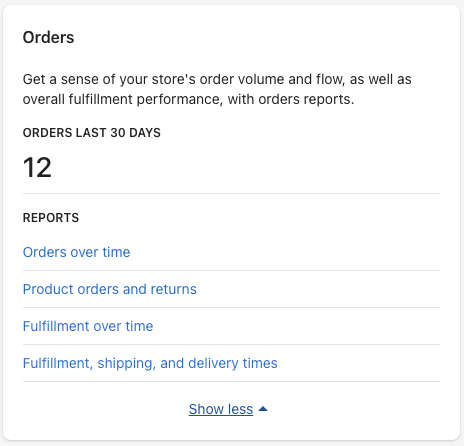
Shopify Order Reports
Shopify order reports help you analyze the volume of orders placed, shipped, delivered, or returned. The information available within these reports include:
- Orders over time
- Product orders and returns
- Fulfillment over time
- Fulfillment, shipping, and delivery times
Shopify Shipping Reports
Given Shopify’s limited shipping functionality, it’s up to you to determine where you want to store your shipping data. But you can get shipping insights from other reports we’ve already discussed. The best way to calculate shipping expenses is by exporting orders from a selected period as a .csv file and then uploading them into your favorite tool, such as Excel.

You also have an overview of the shipping total right from the Reports dashboard on Shopify. Navigate to Finances Summary –> Total sales, and select the desired period.

Shopify Product Reports
Shopify doesn’t offer a standalone products report, but it can give you insights about individual products.
Navigate to Product –> All products, and click on the product you want to analyze. Find Insights and click on View Details.
A menu will pop up with this information:
- Sales over the last 90 days
- Channels that these sales were attributed to
- The split between new and returning customers
You can learn more from the other actual reports.

Shopify Reports On Sales by Product Type
The standard reports are sufficient for most businesses and the product-specific report will allow you to gather information about sales by product type. For even deeper analysis, you can create a custom report.
Navigate to Analytics –> Reports and create a custom report by clicking the green button in the top-right corner. Select Sales over time as Report template. On the next screen, choose Product type from the dropdown menu, and type in the desired query.

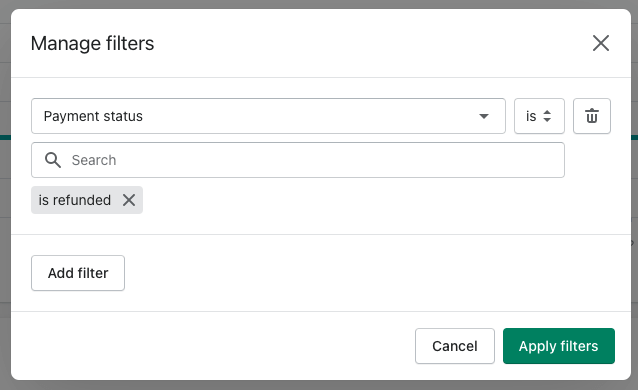
Shopify Reports On Products Refunded
It’s very useful to have a report that lists all of your refunded products. You can use it for identifying the reasons for refunds, doing an inventory check, and so on. Follow the steps as in the previous one to create a custom report. Click Manage filters, and set up the criteria as in the screenshot:
Shopify Accounting Reports
One of the most common questions that we get asked is “How do I generate accounting reports in Shopify?” The answer is – you don’t. Shopify does not offer separate account reports for bookkeeping entries. However, it does have a built-in feature called Reports, which allows you to create reports on sales and refunds breakdown, taxes collected, and so on. You can create custom reports for specific time periods, like this one below:

Shopify KPI Reports
Shopify reporting is already very powerful and insightful. You don’t need to do any of the calculations yourself — tracking the KPIs of your store is as simple as exporting the data into your favorite spreadsheets tool.
When applied to Shopify companies, KPIs are used to assess overall progress against strategic objectives, as well as gauge the performance of individuals within an organization. The main difference between KPIs and metrics is that while metrics are used to monitor and measure the status of a business process over time, KPIs are used to evaluate and compare the performance of different businesses.
Most KPIs have thresholds that can trigger an action. For example, if your conversion rate falls below 2% for two weeks in a row, you might want to consider taking action.
How to Analyze Data from Shopify Reports
Shopify reports have everything you need to analyze data from your store. Within the reports section, you’ll find a variety of different reports that you can use to analyze your store. There are some very basic eCommerce reports that will give you valuable insights into your business, and then there are other more advanced reports that can help you dig deep and uncover new insights or answer questions you didn’t know you had.
What’s great is that all of Shopify’s built-in reporting tools are easy to understand, so you don’t have to worry about missing out on critical information or being overwhelmed by what it all means. By analyzing data from Shopify Reports you can discover:
- Meaningful business insights.
- Problem areas you aren’t aware of.
- Fixes to improve your overall user experience (UX) and conversion rate.
Consider this easy process to get you going:
- Start looking for problem areas on your site. Break your store, to find something that’s not working as expected.
- Write them down along with concerns, questions, etc.
- Turn to your analytics to confirm them.
- Get answers.
For example, we suggest starting with an overview dashboard before going deeply into data.

Key Questions to Ask Before Analyzing Your E-Commerce Data
When you’re looking for meaningful information, you have to know what questions to ask about your data before you start analyzing it. Here are some that might help you get started:
- What’s the average order value of visitors who come from Facebook?
- What’s the average order value of visitors who come from organic search?
- How does cart abandonment change based on visitor location?
- Are customers in one area more likely to abandon their cart compared to another area?
- If I remove all visitors from organic search and retarget them with Facebook ads, what would my expected order value be?
Now let’s go to analyzing specific report categories:
- Analyzing Acquisition Reports
- Analyzing Behavior Reports
- Analyzing Marketing Reports
- Understanding Columns and Filters
Analyzing Acquisition Reports
Acquisition reports in Google Analytics or any other analytics software are not the same as Shopify acquisition reports. The Acquisition reports show you the number of visits, visitors, and sales you got from each source.
Visits over time report
This report shows the number of visitors and sessions during the specified time period. Find it under Acquisition in the Reports overview:

From here, you can play around by clicking the data table’s column headers to sort ascending or descending. Or dig deeper by choosing the default time period, like comparing the last 90 days to the 90 days prior, and so on.
Visitors by referrer report
This Shopify report shows the number of visitors & sessions referred by source. It’s located at Acquisition in the Reports overview as well.

As you can see, in this case, Google search is the most popular referral source.
The referral source is broken out by referral name. Use the column header sorting to end up with something like this:

Now, as you can see Facebook is the top social referral source.
This report provides you with a simple visits overtime report. You know who is visiting your site and how often, but you also know where they’re coming from. This is a valuable insight for further decisions regarding where to invest your money.
Visitors by location report
This Shopify report shows the number of visitors and sessions from various countries. It’s report is located at Acquisition in the Reports overview as well.

If you know which countries people are accessing your store from, you can use these to run ads more efficiently. Additionally, maybe you want to put some ad spend on a country that has potential.
Analyzing Behavior Reports
Shopify behavior reports focus on your visitors’ actions (behavior).
Top online store searches report
Shows the search terms your visitors use when looking throughout your site:
This report is located at “Behavior” in the “Reports” overview:

This report can help you to figure out:
- Voice of customer – How your customers think of and describe the products you sell by specific queries.
- Product popularity – Search frequency shows product popularity.
- UX confusion – Consider whether your navigation is clear and easy-to-use.
Top online store searches with no results report
As the name indicates, this report shows popular search terms that return no results. It’s located at “Behavior” in the “Reports” overview as well:

You can use this report to understand the following:
- Product demand – Relevancy between keywords research and product demand. If visitors are searching for relevant keywords, but those keywords don’t match your products, consider adding them to your product descriptions, popular blog posts, landing pages, etc.
- Product labeling – Use these queries in your relevant product titles, descriptions, etc. You’ll improve search results significantly.
- Product hierarchy – If you have a relevant product to match the popular query, but no results are being returned, move the product up the visual hierarchy.
Visitors by landing page report
This report shows the pages visitors first arrive to your store on. It’s located at “Behavior” in the “Reports” overview as well:

This allows you to see at a glance where you’re appearing in search engine results, and which landing pages drive the most traffic from search engines. If you’re not seeing your business on page one of Google, this report can help you identify opportunities for optimization and acquisition.
Visitors by device
This report shows device types being used to access your store. It’s located at “Behavior” in the “Reports” overview as well:

This report can help you with:
- Ad targeting – Using the data above, you can target mobile / tablet / desktop users more precisely.
- UX differs – Responsive UX design is a major factor when comparing different devices.
- Separate testing – Test and experiment until you optimize for best results.
Analyzing Marketing Reports
Shopify’s built-in reports can help you understand the success of your marketing campaigns. They can tell you how well your recent marketing efforts are doing and where you might want to make changes.
Visitors by marketing campaign
This report shows the number of visitors generated by a UTM marketing campaign. It’s located at “Marketing” in the “Reports” overview.

UTM parameters are added information to links that provide a wide view of marketing efforts.
You’ll see the following parameters most often:
- Source (utm_source)– This helps to define a site the link is placed on. For example, utm_source=shopify or utm_source=blog.
- Medium (utm_medium) – This defines the marketing action. For example, utm_medium=paid.
- Campaign (utm_campaign) – This defines the specific campaign you’re running. For example, utm_campaign=bdam or utm_campaign=march22.
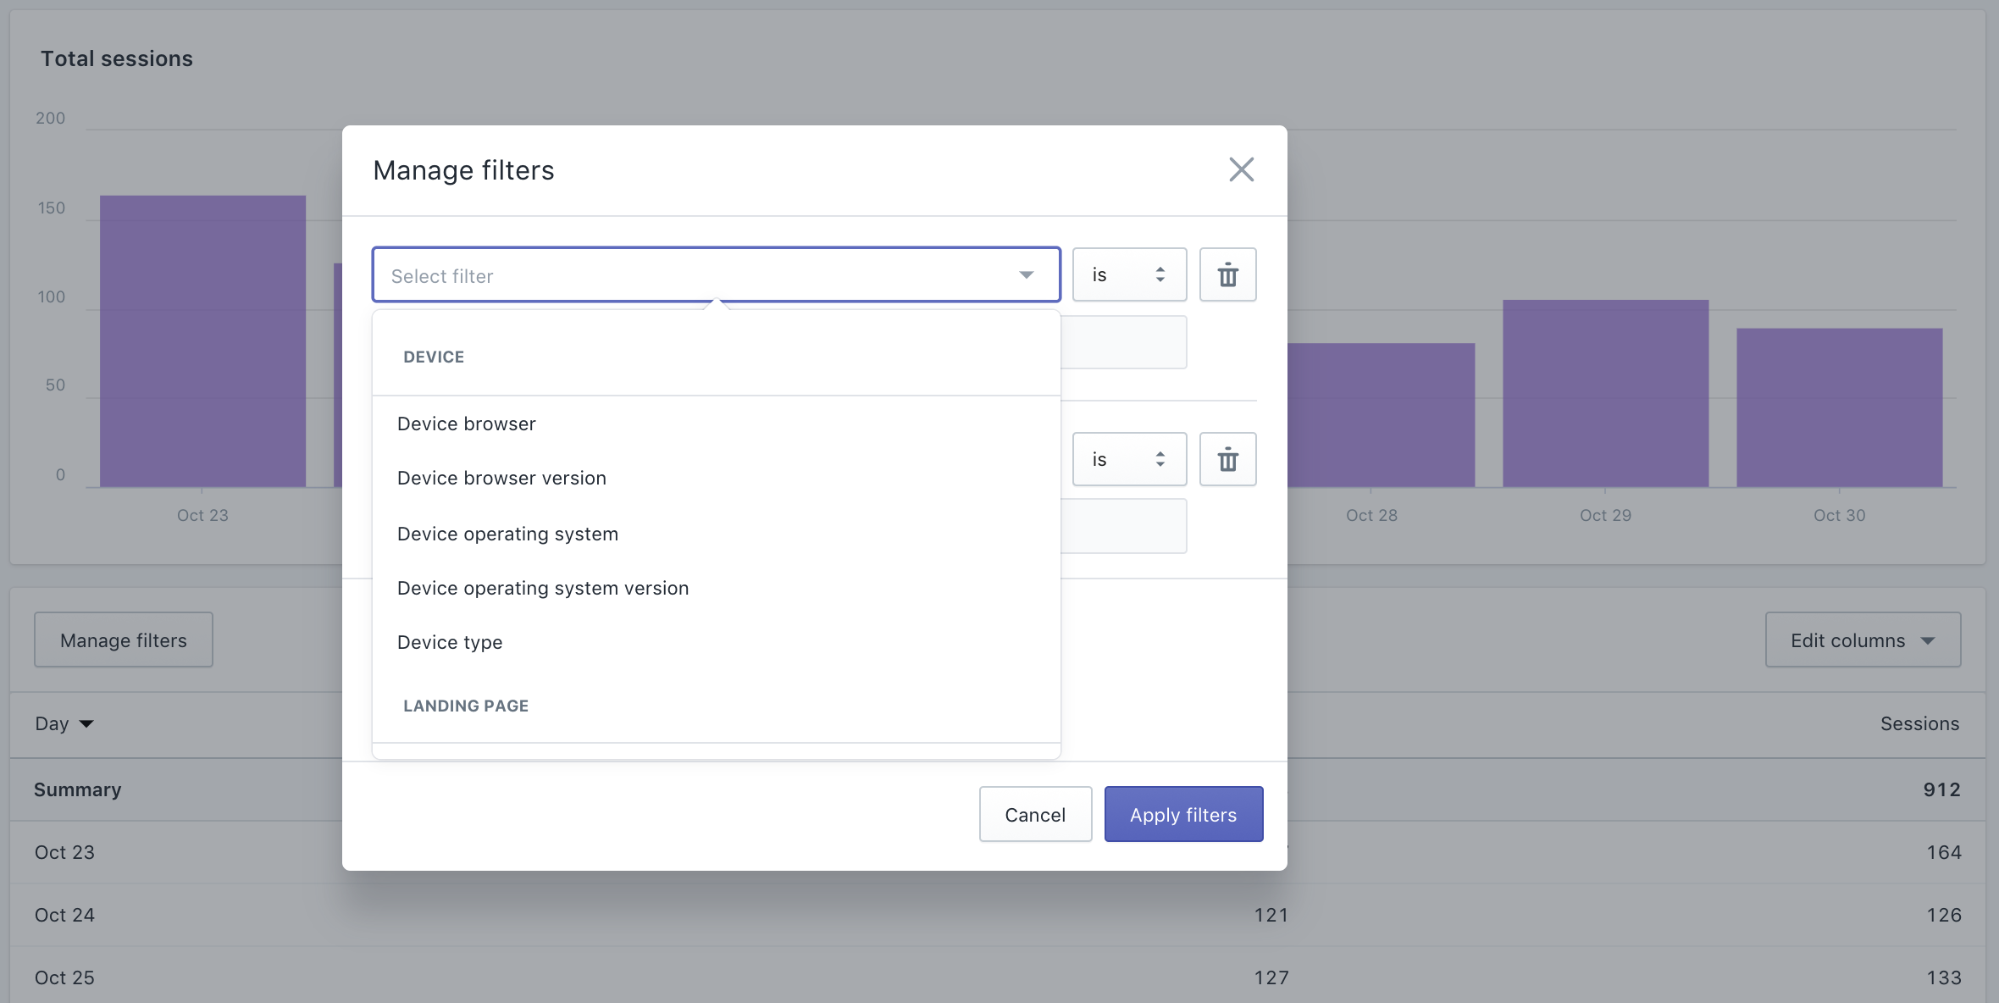
Understanding Columns and Filters
Filters are a great way to narrow your results to the key information you’re looking for.
For example, if you want to see what percentage of your sales are coming from mobile devices, you can type “is” into the operator box and then “Mobile” into the values box. Shopify will then give you the results that fall into that specific category.
Find a “Manage filters” button at the top left of your data tables:
Some reports offer additional filtering options, like the search bar reports:

But filters aren’t the only tool available to you in reports.
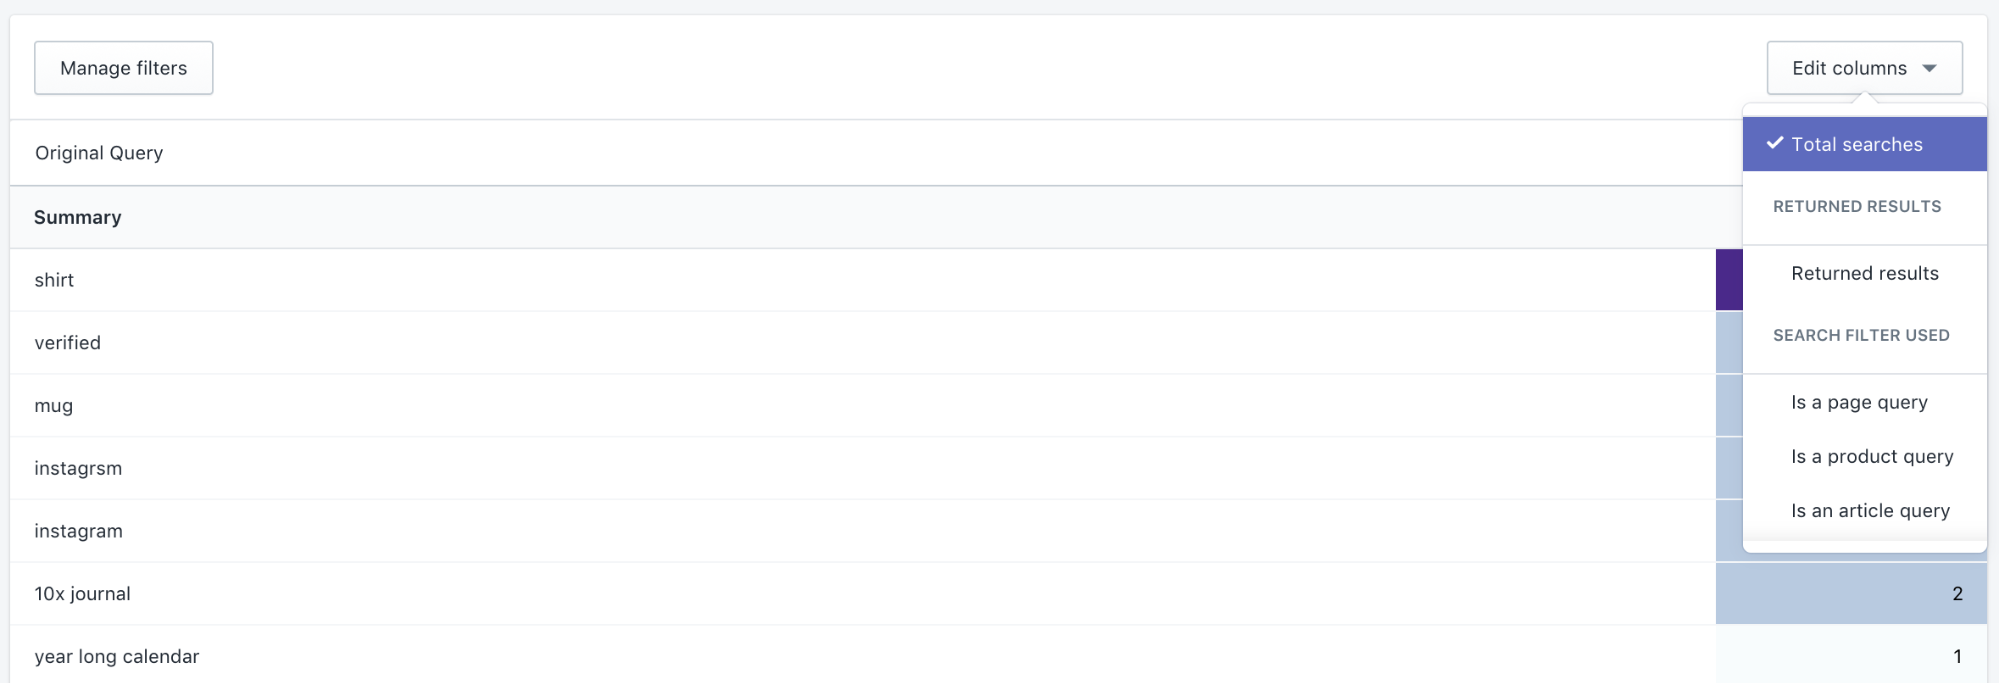
You can also use columns to add or remove data points from a report, which is useful when you have too much data to make sense of at once (e.g. adding the number of orders you made per day). Columns allow you to add and remove specific numbers from your report, like adding an extra column for a number of orders per day or changing a graph into a table.
By clicking the “Edit columns” you’ll see a dropdown menu with available columns:

Some reports offer additional columns options, like the search bar reports:
In the example of visitors by device report, we added some filters and columns additionally.

One filter isolates mobile and one isolates visitors using iOS. The final data table shows information about mobile iOS users.
One column shows the version of iOS, one shows how long the average session duration is, and one shows the number of checkouts.
Automate Shopify Reporting with Databox
The best way to get the most out of Shopify reporting is to automate it — and the best way to do that is with Databox. Automating the data collection process ensures that no data is ever missed, and it frees up your time for other more important things, like focusing on your product and growing your overall business.
The first step to getting the most out of Shopify reporting is not what you might think.
Rather than trying to remember or go back to check the reports in your eCommerce dashboard, you can automate Shopify reporting and improve your online store monitoring with data visualization. Once you set up ecommerce reporting software like Databox, you can track conversion rates, engagement, and performance trends at a glance. The visualizations are automatically updated as new information is collected. This results in a continuous, data-driven approach to improving and optimizing your store.
Sign up for free and see how fast your online business will improve.


