


Table of contents
Do you know the exact purchase path a customer takes to buy your product?
Chances are, it looks a little different for each customer. Seeing how the customer journey is anything but linear these days. It can be hard to know what marketing channels and tactics are the most effective.
Enter Google Analytics Multi-Channel Funnel reports.
These five reports can provide additional insights into how customers discover and eventually buy from you.
In this post, we’re taking a close look at the five multi-channel funnel reports in Google Analytics and what you can learn from them.
- What Are Multi Channel Funnel Reports in Google Analytics?
- How Do You Set Up a Multi-Channel Funnel in Google Analytics?
- 7 Things You Can Learn By Using Multi Channel Funnel Reports in Google Analytics
- Optimize Google Analytics Reporting with Databox

What Are Multi Channel Funnel Reports in Google Analytics?
Google Analytics Multi-Channel Funnel reports allow you to visualize how customers discover your products or services.
In Google Universal Analytics, there are five main multi-channel reports you can use:
- Top Conversion Paths – Understand the channels that contributed to a sale
- Assisted Conversions – See all of the channels that assisted with a sale before they bought anything
- Time Lag – See how long it takes someone to convert
- Path Length – See how many times visitors visited your site before converting
- Model Comparison Tool – Visualize the different top conversion and assisted conversion paths that customers take.
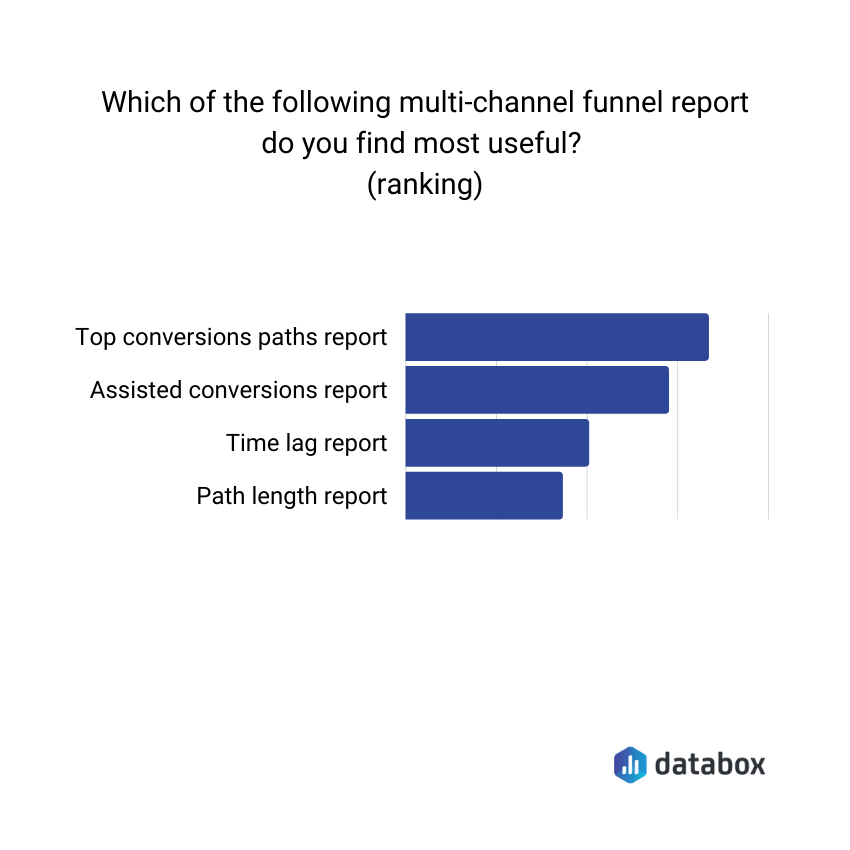
According to our survey, respondents voted the top conversions paths report as the most useful multi-channel funnel report available.
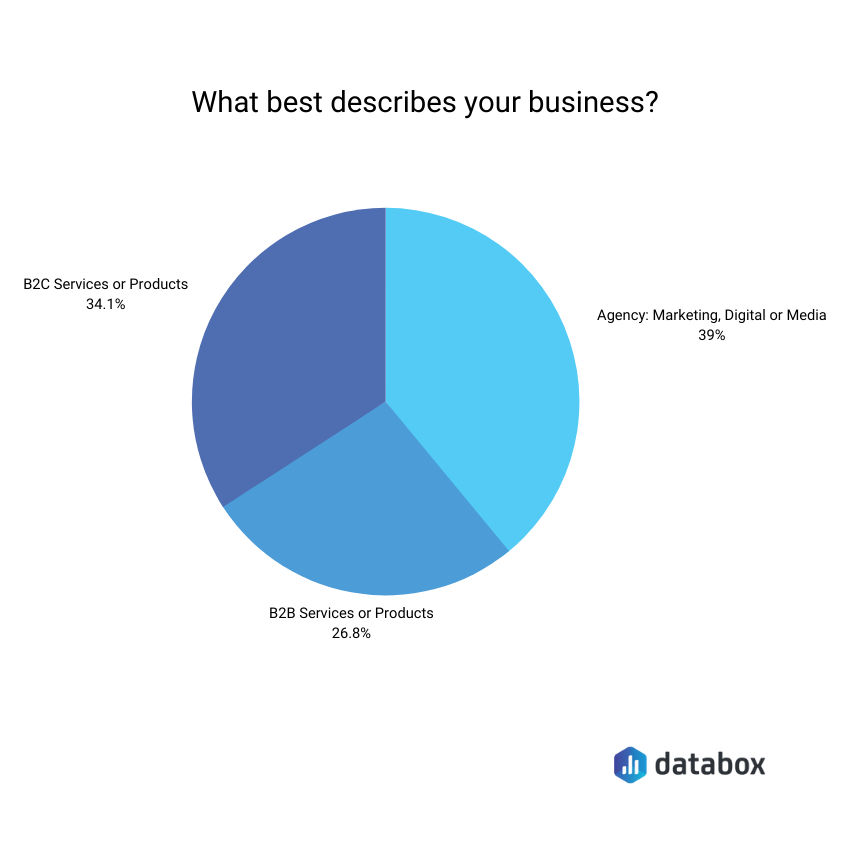
In addition, 39.02% of our respondents were agencies. 34.15% were B2C Services or Products. And, 26.83% were B2B Services or Products.
How Do You Set Up a Multi-Channel Funnel in Google Analytics?
Setting up and viewing multi-channel funnel reports is easy if you are using Universal Analytics. All you need to do is click on Conversions → Multi-Channel Funnels in the left-hand navigation menu.

So, if you want to view the top conversions path report, here is an example of what you might find.

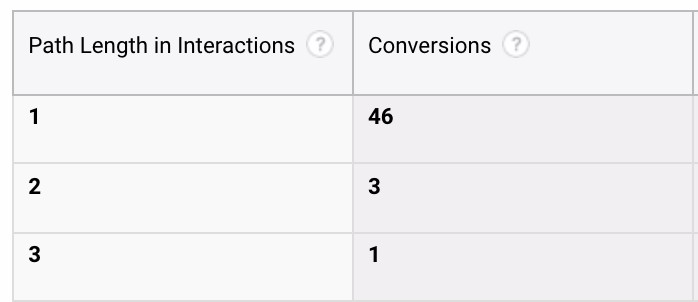
And, this is an example of the path length report.
7 Things You Can Learn By Using Multi Channel Funnel Reports in Google Analytics
From key customer touchpoints to average time to make a sale, there is a lot you can learn from these five multi-channel reports.
- Top lead generation channels
- Key customer touch points
- Assisted conversions
- Lookback windows
- Attribution modelling
- Quantify the impact of good customer experience
- Impact of word-of-mouth referrals
1. Top lead generation channels
This is fairly self-explanatory, but knowing the channels that generate the most leads as well as sales is essential for both sales and marketing.
“Understanding the channels through which your customers can visit your website is critical information,” says Farhad Malegam of Sydney Digital Agency. “With Google Analytics’ multi-channel funnel reports, you can gain a better understanding of which channels are the most effective and what drives conversions on your site. For instance, eCommerce website can have better conversions from social media channels and paid advertising. While a website for a professional service may get results from organic traffic.”
PRO TIP: Save Time Creating Your Google Analytics 4 Traffic Dashboard
Yes, you can DIY in Google Analytics 4, but what if you would prefer a simpler, easier route? After all, once you learn how it’s done, you still have to choose the right metrics and design your custom dashboard to answer the important questions your stakeholders have, for example:
- How many people are visiting my website?
- Which channels bring in the most users?
- How engaged are my users?
- How well is my website keyword optimization performing?
and more…
Now you can benefit from the experience of Google Analytics experts, who have put together a great Databox template showing all the most important website traffic KPIs. This template allows for easy integration with scheduled report delivery. It’s simple to implement and start using as a standalone dashboard or in marketing reports!
You can easily set it up in just a few clicks – no coding required.
To set up the dashboard, follow these 3 simple steps:
Step 1: Get the template
Step 2: Connect your Google Analytics 4 account with Databox.
Step 3: Watch your dashboard populate in seconds.
2. Key customer touch points
When you look at both the top conversions path and assisted conversions report, you can learn about all of the channels that lead to a sale. This is really important because if you are selling a high-dollar product or service, the odds of someone buying it the first time around is slim to none.
“The most important thing we’ve learned by using multi-channel funnels in Google Analytics is the average number of channels and touchpoints necessary in order to convert users after first touch,” says Matt Arceneaux of 301 Digital Media, LLC. “With this insight, we’ve been able to focus on improving the customer journey and reducing the time to convert users after first touch.”
For instance, Ouriel Lemmel of WinIt says, “We have been most interested in the Top Conversion Paths Report. We have learned much more about how people find us, their journey towards purchasing our service, and how long it took them to ultimately become customers. It’s been very valuable for us to know where we tweak our marketing to make sure we are making the post of our conversion paths.”
JM Littman of Webheads agrees, “A favorite Google Analytics report to use with our clients is the Top Conversion Path Report; we use it to analyze both whole accounts and specific campaigns. The one most helpful aspect for us is looking at the landing page URL in journey sequences. This allows us to understand which pages customers are interacting with on a client’s site. We can then review the content of those pages to understand what type of content is working best and use this to optimize underperforming pages. It also allows us to understand customers better, how they are navigating through the site, and how we might be able to use this to further increase conversions.”
PRO TIP: Visualize campaign performance in Google Analytics reporting tool. These reports can be tailored to show specific metrics and dimensions that are relevant to the campaign, such as traffic sources, conversion rates, and revenue.
3. Assisted conversions
If you do a lot of social media or content marketing, the assisted conversions report can often be a goldmine of insights.
“The most important thing I have learned using multi-channel funnel reports in Google Analytics is Assisted Conversions,” explains Daniela Sawyer of FindPeopleFast. “Assisted conversions are crucial for any site which is generating traffic and, of course, revenue. It tells which channel is contributing the most to conversions. It also means the value of conversions made by any particular channel. And believe me, it’s essential because you will get to know where you have to work more and where your site is performing well. After knowing all those things, you can further increase your influence to get the most support to conversions and improve your performance on the channels with the least support.”
4. Lookback windows
Because their multiple touchpoints before a sale happens (in most cases), the time lag report can provide crucial insights.
“The Time Lag report helped us identify how long it took between a visitor’s first session and conversion, as well as how many visits it took,” says Stephen Light of Nolah Mattress. “For an eCommerce mattress brand like us, this data is crucial in uncovering how long consumers take to make the purchase of quite a significant item, and, by extension, how we can optimize our content and channels to help conversions along. It helped us understand that if we offer competitor comparison charts directly on our site, the time between first visit and conversion is less.”
Daniel Carter of Manhattan Tech Support adds “Marketers can utilize the Time Lag report to see how long it took customers to convert in days. The bar chart report is divided into two sections: a separate bar for days 0-11 and a single bar for days 12-30, which may also be split down by day.
The Time Lag report can help you with questions like: How long do my users usually take to convert? How long does it take for a user to convert after clicking on an ad? The time lag report might help you determine when you should use remarketing and email campaigns.
If visitors normally convert within three days, for example, you might build up a retargeting and email automation campaign around day 15 to target users during the first three days and around days 14, 15, and 16 to achieve better conversions.
Understanding the average time to conversion can also be a beneficial tool for your sales staff, allowing them to approach prospects directly when they are most likely to convert, resulting in more offline conversions.
Finally, the Time Lag report gives an indication of the sales funnel’s consideration timeline. With this in mind, you can potentially impact the number of conversions that are directly coming through by more closely tying your campaigns to your customers’ behavior by modifying your campaigns (paid media and email automation).”
For example, Denis Leskovets of Office Consumer says, “One of the most significant things I’ve learned by using multi-channel funnel reports in Google Analytics is that MCF reports differ by a wide margin from standard reports. This is mainly because of direct traffic.
Direct traffic is any traffic received on a website where a user types in the URL or clicks on a bookmark. Since there is no source for this traffic, Google does not recognize it. This might seem like a small phenomenon, but it has a huge impact on your MCF metrics since a portion of your traffic was not considered for analysis. There are a lot of other discrepancies that arise with MCF reports.
One big example is the Lookback Window. While standard reports measure up to six months, MCF reports only do so for the last ninety days. I went through something similar while working with MCF reports. I compared transactions in the Channels report with those in the Model Comparison Tool. Transactions made in the 90-day widow were recorded under Organic, while all previous transactions were ignored. Non-MCF reports were able to capture all transactions and provide a more accurate result.”
5. Attribution modelling
These reports are especially beneficial when it comes to attribution modeling for paid ad campaigns.
For example, Carolyn James of Website Insights says, “I have learned that the best way to help clients to understand attribution is by using the multi-channel funnel reports. Clients who run Google Ads can be confused when more conversions are reported in Google Ads than in Google Analytics. This is because attribution is calculated differently. I can use the Multi-Channel Funnels > Top Conversion Paths report to examine one conversion in detail and show that both reports give the right answer but from a different perspective. One thing I need to remember is to set ‘Path length’ to ‘All’ to see all the data.”
6. Quantify the impact of good customer experience
You can also use these reports to show how great customer experience affects sales and retention.
“The most important thing I’ve learned using multi-channel funnels reports is how crucial customer experience is for overall business marketing,” says Gabriel Dungan of ViscoSoft. “Using multi-channel funnels allows you not only to see when and how consumers are converting but also which online content they are interacting with the most. These kinds of insights are so beneficial for future marketing techniques. For example, if I launch a marketing campaign on my business’ website, multi-channel funnels help me understand the overall success of that campaign in much more detail.”
7. Impact of word-of-mouth referrals
Referrals and brand awareness campaigns, like podcast sponsorships, can be hard to track. These multi-channel funnel reports can provide additional insight.
“From a multi-channel funnels report, we learned about the role prior website referrals, searches, and ads played in that conversion,” says Angus Chang of Iupilon. “It also helped us know how much time passed between the user’s initial interest and purchase. For example, Customers may search for your brand on Google before purchasing on your site. However, they may have discovered your brand by reading a blog or searching for specific products and services. We can see how previous referrals and searches contributed to our sales from the report.”
Optimize Google Analytics Reporting with Databox
Having to log into Google Analytics multiple times each week to view these multi-channel reports and then manually update spreadsheets is tedious and opens the door for human error.
Chances are, your job isn’t to just create reports all day. You are also doing marketing. The more time you are spending manually creating reports and updating spreadsheets, the less time you are spending on actual marketing activities that drive results.
That’s where a tool like Databox comes in.
With hundreds of templates and 100+ direct integrations, you can track all of the metrics you can most about in a single, streamlined dashboard.
Intrigued? Create your free Databox account today and join 20,000+ businesses that are taking reporting to the next level.


