


Table of contents
Hello everyone. Welcome to another episode of Data Snacks. My name is Monja, and I’m the product marketer at Databox.
Ever feel like your Facebook ad campaigns run out of budget too quickly??
Your CPM or cost per thousand impressions might be to blame, and you didn’t even know it. So today, we’re going to talk about CPM, or cost per thousand impressions, on Facebook Ads.

Let’s take a look at how we can assess CPM for each ad and improve their performance – I’m going to show you how to:
- Visualize your CPM by ad
- Monitor your CPM
- Improve your targeting. The more specific it is, the less likely you are competing with large-budget advertisers for the same audience.
Below, you can view the full episode or keep reading for a fully transcribed version of the episode, complete with relevant screenshots.
Let’s start!
Understanding Your Facebook CPM
About 15% of agencies polled in this Facebook ads report say they set goals around CPM.
If you are a Facebook Ads user, you already know about CPM and CPC (cost per click), but did you know that if you reduce Facebook CPM, in some cases, lead to a higher return on ad spend, or ROAS?
Simply put, a CPM that is higher than you expect indicates that your ads aren’t as efficient as you’d like. In other words, you are spending more money to reach a limited audience. That is why it is essential that we monitor CPM carefully.
Start Tracking It in Databox
We are starting in Databox, so let’s see how we can track CPM
better and in a more visually compelling way.
First, we will navigate to the Databox Designer. Adding metrics is quite simple here. Simply choose the source from the Databox Metrics Library here on the left and drag-and-drop some of the available pre-built CPM metrics such as – by ad, campaign, ad set, etc.
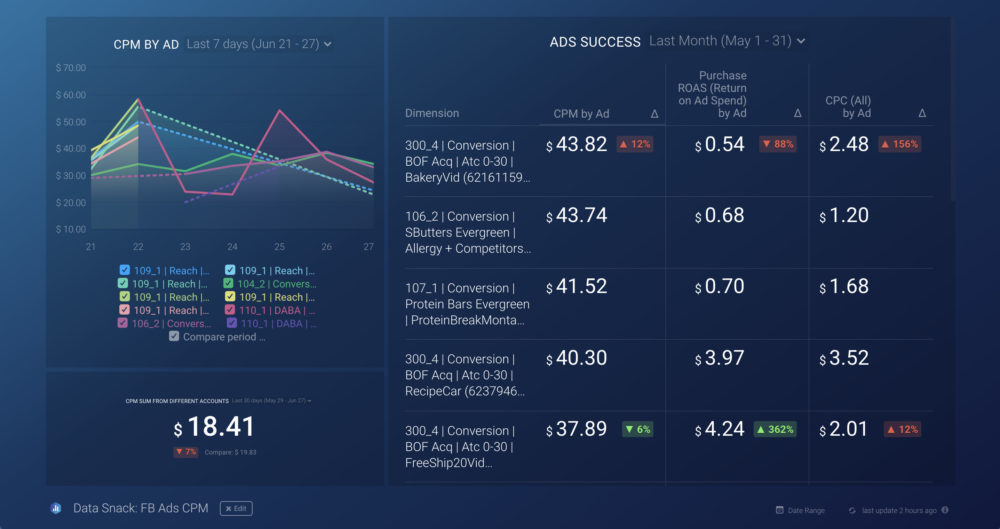
We can also choose different visualizations to track your CPM. For example, let’s drag and drop the line chart visualization onto the board here. And ad CPM by Ad as a metric. Now, if you have a lot of Ads set up, this might seem a bit confusing, but you can select which Ads specifically you’d like to see by using this interactive legend below the chart or the dimension window here on the right. With this visualization, you can see how your CPM is changing over time, all the peaks and valleys, and even add annotations to them so that everyone on the team can see and understand what was happening with a certain ad at a certain time.
Another way to visualize CPM from all your ads is by showing them in a table. You can either drag and drop the metric straight from the metric library and showcase it – as the table visualization is already set.
However, if you showcase them in an Advanced table visualization, you can track your Ads CPM alongside other relevant metrics that you need to be tracking – like CPC, ROAS, and engagement. The only thing you need to pay attention to is that each metric needs to have the same ending. In our case, that’s ‘by Ad.’ Having all this on one social media dashboard will enable quick and easy tracking of your Facebook ad performance.
Time to Interpret the Facebook CPM Data
Ok, now that we have the data in front of us, let’s see what it tells us. Next to cost per thousand impressions, we see cost per click and ROAS numbers. Now I have the ability to analyze and understand why certain ads might be more profitable than others.
Facebook states that CPM measures the total amount spent on an ad campaign, divided by impressions, multiplied by 1,000. According to our data, on average, a good CPM is $1.39, $1.38, $1.00, $1.75, and $0.78 for the telecommunications, general retail, health and beauty, publishing, and entertainment industries, respectively. That said, it’s important to note that the average cost per thousand impressions is $11.20. This way, you now know the average spent on CPM, which should keep you from spending in excess. Of course, other factors are involved here as well, like the quality of your ads and the competition within the industry for the group targeted.
As you can see, the desired CPM can vary, but it is the success of your overall Facebook Ad camping that determines whether it is too high, so let’s look at some other metrics.
So what do we want to see? We want to see which one has the highest ROAS and if at the same time it has a CPM and the CPC within our goal average. That will tell us if our ads are performing well or are we just overspending without the desired results.
Once we gain this insight and are tracking it regularly, adjusting the approach and seeing what works better won’t be such an issue. You can start by improving your targeting.
Targeting the right people with the right message is the key to a successful ad campaign. So once you set up your ad, make sure that the location, age, and gender of your target market are carefully chosen. Don’t forget the interest section, as you can choose ones that are very product and service-specific, thus aiming your ads with even more precision.
PRO TIP: What’s the overall engagement of your ad campaigns?
Want to make sure your Meta ads are performing and trending in the right direction across platforms? There are several types of metrics you should track, from costs to campaign engagement to ad-level engagement, and so on.
Here are a few we’d recommend focusing on.
- Cost per click (CPC): How much are you paying for each click from your ad campaign? CPC is one of the most commonly tracked metrics, and for good reason, as if this is high, it’s more likely your overall return on investment will be lower.
- Cost per thousand impressions (CPM): If your ad impressions are low, it’s a good bet everything else (CPC, overall costs, etc.) will be higher. Also, if your impressions are low, your targeting could be too narrow. Either way, it’s important to track and make adjustments when needed.
- Ad frequency: How often are people seeing your ads in their news feed? Again, this could signal larger issues with targeting, competition, ad quality, and more. So keep a close eye on it.
- Impressions: A high number of impressions indicates that your ad is well optimized for the platform and your audience.
- Amount spent: Tracking the estimated amount of money you’ve spent on your campaigns, ad set or individual ad will show you if you staying within your budget and which campaigns are the most cost-effective.
Tracking these metrics in Facebook Ads Manager can be overwhelming since the tool is not easy to navigate and the visualizations are quite limiting. It’s also a bit time-consuming to combine all the metrics you need in one view.
We’ve made this easier by building a plug-and-play Facebook Ads dashboard that takes your data and automatically visualizes the right metrics to give you an in-depth analysis of your ad performance.
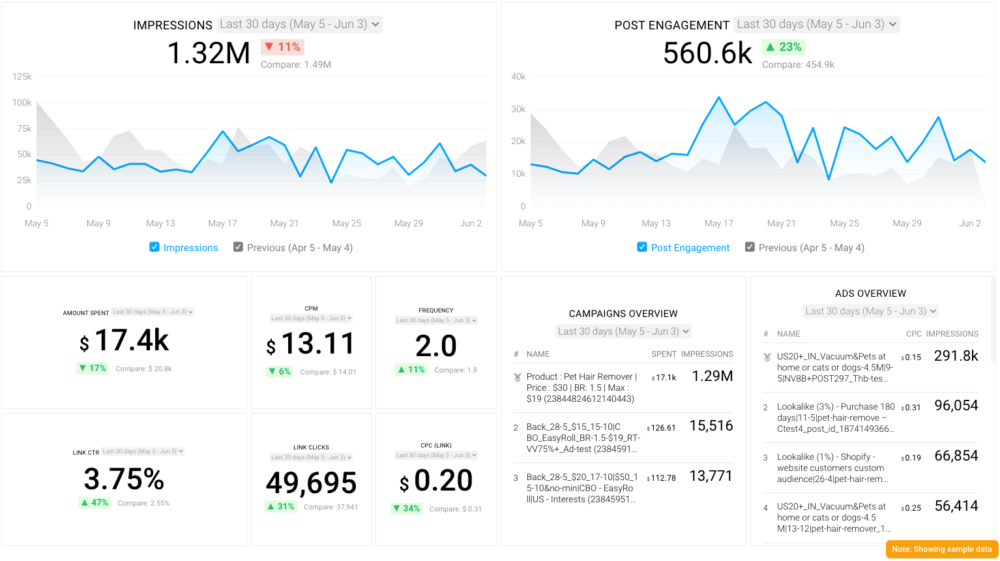
With this Facebook Ads dashboard, you can quickly discover your most popular ads and see which campaigns have the highest ROI, including details such as:
- What are your highest performance Facebook Ad campaigns? (impressions by campaign)
- How many clicks do your ads receive? (click-through rate)
- Are your ad campaigns under or over budget? (cost per thousand impressions)
- What are your most cost-efficient ad campaigns? (amount spent by campaign)
- How often are people seeing your ads in their news feed? (ad frequency)
And more…
You can easily set it up in just a few clicks – no coding required.
To set up the dashboard, follow these 3 simple steps:
Step 1: Get the template
Step 2: Connect your Facebook Ads account with Databox.
Step 3: Watch your dashboard populate in seconds.
You Are Ready to Evaluate CPM of Your Facebook Ads
We hope that we have shown you a powerful new way to evaluate the CPM of your Facebook ads without hours of preparation or drilling down on each campaign separately and compiling them into a dashboard.
The best part is that you can monitor your CPM by ad, campaign, or ad set using our social media dashboard software. And, let’s not forget that you can even monitor CPM for multiple ads from multiple different data sources.
If you need help tracking and visualizing your Facebook Ad performance, our Support team can actually help build your first dashboard for free.
Just create your free Databox account and reach out to our team either via chat or email.
See you next time.


