


Table of contents
Google Analytics is a platform that enables you to track, observe, and analyze your website data. With different Google Analytics features, you get to see exactly what users typically do on your website, which pages bring in the maximum traffic, how well are your conversion experiments working, and much more.
Overall, it helps you make data-driven decisions more easily and accurately. But did you know some pretty useful Google Analytics features are oftentimes overlooked?
In this guide, 50+ experts explained the 24 most underrated google analytics features to use with unique use cases. Learn which underrated features you should use more often, and how to make the most out of your data.
- What is Google Analytics and How It Works?
- What Can Google Analytics Measure?
- What are the Most Important Metrics in Google Analytics?
- 24 Underrated Google Analytics Features You Should Use More Often

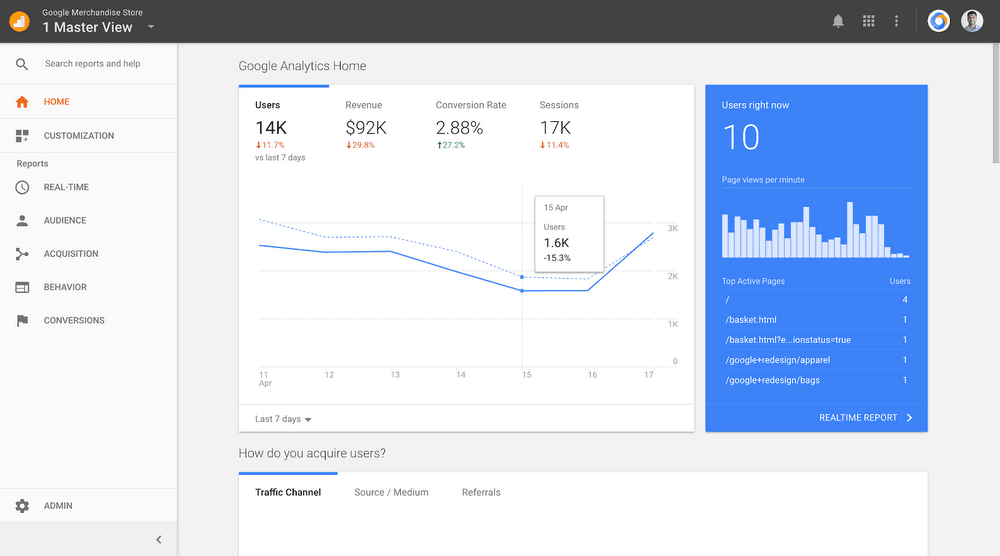
What is Google Analytics, and How it Works?
Google Analytics is a data analytics tool that helps to track user activity on your website. It uses browser cookies to store the users’ information like the referral page, time on a page, and the number of pages visited.
Based on the user activity on your website or application, the Google Analytics code tracks the data and helps you create different views to analyze it.
To get started to use Google Analytics, here are the basic steps to implement:
- Create or sign in to your Analytics account:
- Setup your website or app in the analytics account. Here is how to set up a property.
- Set up a reporting view of your property.
- Add the tracking code to get started with tracking data on your Google Analytics. Here’s the process on how to add the code.
Related Article: 26 Tips for Properly Setting Up Google Analytics On Your Website
What Can Google Analytics Measure?
Google Analytics basically tracks the sessions happening on the website and the other data like source, medium, and user interaction on the website. You can even understand your audience in-depth with details on their location, demographics, interests, traffic source, etc.
What are the Most Important Metrics in Google Analytics?
While moving around Google Analytics to understand your website’s performance & marketing campaigns, you might come across tons of questions. Which page lands the highest traffic? What percentage of users exit a page? How many conversions happened over the last month, and many more.
The answers to these are in the metrics that you can track in Google Analytics. Here are some of the essential metrics that you should track:
- New or unique users: New users are the number of first-time users (instead of returning ones) in a particular date range.
- Session duration: The average length of a session of all users.
- Bounce rate: The bounce rate is simply the number of people who open your website and immediately then close it without even clicking anywhere or making an effort to browse through.
- Pageviews: The number of pages viewed by a user during a session.
- Exit Rate: The number of exits/number of page views for the specified page is the exit rate.
Read about the most tracked Google Analytics metrics in-depth to start tracking if you’re not already.
24 Underrated Google Analytics Features You Should Use More Often
Now, time to dig into the meat. Let’s understand each google analytics feature that is often underrated but yet so impactful when utilized to its fullest potential.
- Segments and Advanced Segments
- Custom Reports and Dashboards
- Custom Channel Grouping
- Annotations
- Custom alerts
- Event Tracking
- Pages Report
- Demographics
- Interests
- Site Speed Report
- Google Search Console
- Insights Search Bar
- Site Search Tracking
- Entrance Pages under Behavior Section
- Behavior Flow
- Top Conversion Paths and Conversion Events
- Custom Goals, Goal Funnel, and Funnel Visualization
- E-Commerce Tracking
- Date Range Comparison
- Block Company’s IP Address
- UTM Parameters
- Data Import
- In-Page Analytics Report
- Google Analytics API
PRO TIP: How to track these 10 popular Google Analytics 4 metrics
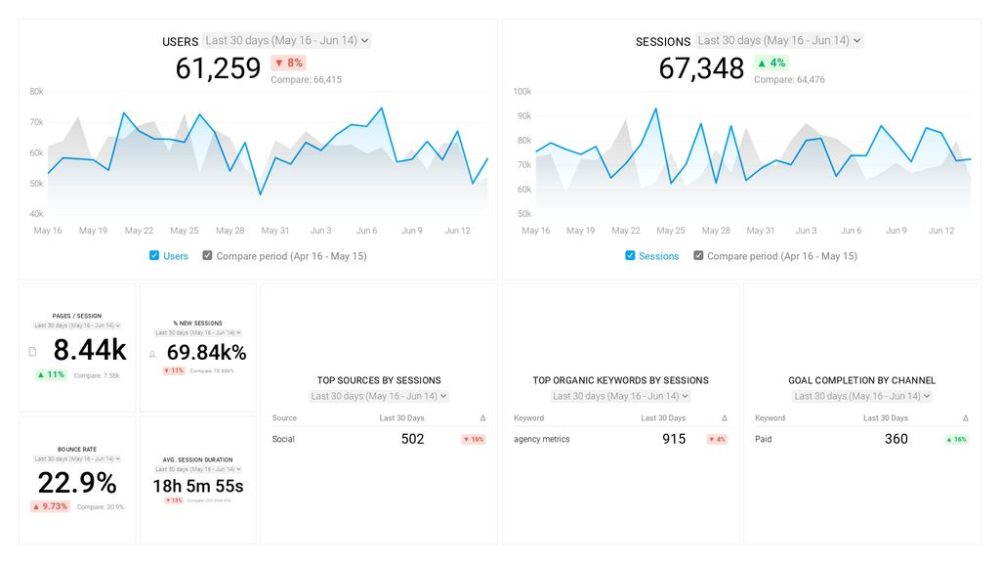
Sure, there are dozens (and dozens?) more Google Analytics 4 metrics you could track. But, starting with these 10 commonly tracked metrics will give you a pretty high-level view of how your marketing is working…
- Sessions: The number of sessions can tell you how many times people are returning to your website. Obviously, the higher the better.
- Sessions by organic keyword: Which organic keywords bring in the most traffic to your website? This may help you determine whether your SEO investments are paying off.
- Bounce rate: Do visitors leave shortly after landing on your website? Or do they stick around?
- Average session duration: How much time are people spending on your website? Users with a high average session duration are most likely relevant to your company.
- Goal completions: How many users responded to your call to action?
If you want to track these in Google Analytics, you might find the visualizations limiting. It’s also a bit time-consuming to combine all the metrics you need in one view.
To better understand how your website performs in terms of traffic growth and conversions, we’ve made this plug-and-play dashboard that contains all the essential metrics for understanding how successful you are at optimizing different aspects of your website.
You can easily set it up in just a few clicks – no coding required.
To set up the dashboard, follow these 3 simple steps:
Step 1: Get the template
Step 2: Connect your Google Analytics account with Databox.
Step 3: Watch your dashboard populate in seconds.
1. Segments and Advanced Segments
“Attribution has always been a common problem for marketers. While First Click or Last Click attribution is what many companies use, using ‘Sequences’ in Advanced Segments is a great way to check if a specific set of pages was viewed before a critical action like ‘Sign up’”, says Seema Nayak of AdChina.io.
Why is this a great feature?
Alex Birkett of Omniscient Digital says, “You can break down segments of your audience based on multiple criteria, and in the case of sequences, establish a time element to your segmentation.
How can this feature be used?
“One example of a use case here is identifying the relative impact of a given hit (page, event, element) on your desired metrics. For example, you could build a sequential segment to analyze how organic visitors to a given blog post convert to your email list and compare that to paid visitors to that same blog post”, says Birkett.
“I’ve been using it for Content Marketing attribution to check what percentage of users visit a blog page before a free trial sign up. This way, I can account for any action taken by the user and not just first or last click. The best part, it can be set up within a couple of minutes,” says Nayak.
Tim Hill of Social Status, says, “I typically create a few key Segments based on the landing page:
- Any blog page
- Homepage
- Any feature page
- Pricing page
Then looking at Sessions per segment, Sessions vs. Conversions (Conversion Rate), and other behavior like bounce rate and pages per session by segment. This always tells me a lot about the value of our inbound traffic based on where it landed.”
Related article: 25 Examples of Google Analytics Segments That Enable Deeper Analysis
2. Custom Reports and Dashboards
Google Analytics’ custom reports and dashboards help you set up your data visualization with all the metrics you wish to see at a glance & those that matter to your business.
“I use Google Analytics’ Dashboards and Custom Reports almost daily. They’re like a Swiss Army Knife among analytics reporting tools”, says Matt Bently of Snip.ly.
“They help us prove a correlation between social media traffic, clicks on our CTA button, and revenue in a way that’s visually appealing and easy to understand.”
Related Article: 16 Ways To Measure Social Media Engagement Using Only Google Analytics
3. Custom Channel Grouping
“Google Analytics’ custom channel grouping feature is a vastly underutilized resource. You can customize how you break up data to get an idea of how specific channels are performing”, says Kimberly Smith of Clarify Capital.
How can you use Custom Channel Grouping?
“It’s still in beta, but I found it really useful. I can define the custom channel by selecting a specific source, medium, and campaign. I can also use Regex while defining the custom channel. Once created, one can apply it retroactively and see historical data classified by the new channel definitions”, says Rohit Chavane of SaaShook.
“Once you know how the default channels work, you can start creating more amazing custom channels,” says Oliver Andrews of OA Design Services.

4. Annotations
“Annotations basically allow us to mark specific dates in the Google Analytics reporting tool. These annotations are helpful to keep track of changes/new strategies you make to your website”, says Ashok Sharma of Signity Solutions.
“Annotations add clarity to your Analytics report by allowing your team to take notes on every marketing activity by date – especially anything that can cause a spike or dip in traffic. From those notes, it’s easier for you and your team to understand spikes in traffic, unusual changes, and trends in your analytics,” says Andre Oentoro of Breadnbeyond.
How to create an annotation in Google Analytics:
- Click “+ Create new annotation.”
- Select the date for the annotation.
- Enter your note.
- Choose the visibility of the annotation. If you only have “Read and Analyze” access, you will only be able to create private annotations.
- Click “Save.”

Harris Schachter of Lend-Grow says, “ Not only is this helpful to yourself years down the line but as a business owner it can be very helpful for consultants down the line who may be tasked with diagnosing downturns or replicating successes.”
Hear from how Elijah Litscher of The Loop Marketing uses Annotations.
“Our team uses Annotations to mark the publication of articles and the start of certain campaigns. This allows us to track how strategies are working or, more importantly, not working. It gives us the black and white data needed to course correct and have more success.”
Another interesting point about annotations – sharing option.
“You can also share your annotations, making them useful for cross-department communication. Imagine checking Google Analytics one day to notice a steep drop in traffic. Instant panic, right? With annotations, you could see that the paid team turned off a big campaign, for example”, says Muhammad Mateen Khan of PureVPN.
5. Custom Alerts
“Google Analytics can do a lot of things and crunch a lot of numbers, but ultimately if you can’t digest them in a format that you can understand, you won’t be able to do anything with it. Custom alerts can really help with that.
Custom alerts help you organize data and gives you an alert when a key trend is taking shape so that you can take notice”, says Jack Choros of IronMonk Solutions.
How custom alerts help marketers?
New Campaigns: “This is a great feature to track new traffic and engagement for newer or less established brands. Especially during a campaign”, says Des Dickerson of Creative Label.
Issues on the website: “It also serves as an indication that something may have gone wrong in your website,” says Chuks Chukwuemeka of DepreneurDigest.
Brand mentions: Dr. Colette Widrin of Balance Blends says, “Custom Alerts can be especially beneficial when you’re running campaigns, and you need to see when you’re receiving brand mentions or backlinks.”
Referral Traffic: Daniel Ripa of Venture Team Building says, “I commonly use this for is tracking specific referral traffic and visits to my to site.”
Changes in experiment results: Alejandro Rioja of soinfluential.com says, “When you are in the process of testing different acquisition channels and tracking goals, it becomes a little difficult to get notified of any big changes. Custom alerts help you get the notifications automatically to track your data trends.”
Automate reporting: “Custom alerts are a great way to automate the reporting that you do. When you set up custom alerts, you can be automatically notified that can help you monitor your data”, says Taylor Roberts of Movers Chicago.
How to create custom alerts?
“Custom alerts can be created in either the View panel in the Admin tab or through the Customize menu in the regular reports. To set it up, you just select which views you want to apply your custom alert to and then set your conditions. You can also sign up for SMS messages if you’d like”, says Roberts.
6. Event Tracking
Events are user interactions with the content on your page and can be set based on what’s important for your business.
“Events should be at the core of any Google Analytics strategy as it opens up a whole new dimension of understanding traffic patterns,” says Akash Makwana of Photocopiercompare.
How do Events help?
“Events allow marketers to precisely gauge the engagement on their websites and landing pages. Scroll depth, button clicks, .pdf downloads, video plays – any kind of interaction can be tracked with Events”, says Nikola Kožuljević of ThreatMark.
7. Pages Report
“Most people just look at the Acquisition overview and see the overall sources that drive traffic instead of seeing which sources drive traffic to specific pages. By seeing the specific pages and how they get their traffic, it helps much more with understanding your marketing and rooms for improvement”, says Marcus Cook of The Success Bug.
That’s where pages report comes to your rescue. And you can do much more with that.
“You can go into the secondary dimension, sort by acquisition source, and see exactly where your traffic is coming from for all your top-performing pages.”
8. Demographics
If you’re looking to understand the age group of your organic traffic and hence creating website elements accordingly, demographics will help you.
“Demographics are often overlooked, but knowing exactly who is visiting your site, including who is making product or service decisions, can be some of the most important information gained from Google Analytics.”
“When you can better understand your audience, then you can more aptly gear your campaigns in that direction,” says Brett Banchek of Overnight Flowers.
“Marketers often focus on the content when completely forgetting about other aspects, such as who is your audience.”
“With demographics, you can understand which age group your product is the most attractive to. Not only that – you can also learn their gender and interests”, says Milosz Krasinski of Chilli Fruit.
9. Interests
Interests data under the ‘Audience’ tab of your Google Analytics gives you data on your users’ interests based on search queries.
“The most underrated Google Analytics feature is Interests. By knowing the interests of your readers, you can create more content that your readers like. By boosting this user experience, you get more traffic, signups, social shares, and sales,” says Janice Wald of Mostly Blogging.
“For instance, one of my visitors’ interests is SEO; I’ll make sure to write about that topic regularly.”
10. Site Speed Report
“Site Speed feature enables you to check the average loading speed of your site and how it also performs when using different browsers,” says Tal Shelef of Condo Wizard.
“For example, my site performs best in Google Chrome, which provides me with useful information I need to help generate and direct more traffic to my site. Knowing your site speed is very important as people don’t want to sit around for a long time waiting for a page to load if it’s possible, a page must load in two seconds or less to keep their attention.”
11. Google Search Console
Google Search Console reports can be accessed in Google Analytics to evaluate the performance of your organic search traffic.
“In a perfect world, you would know how many times your website pages appeared in searches and what words made you appear.”
“While the world may not be perfect, you can know how many times you showed up in Google searches and what words got you there. There is a FREE tool in Google Analytics called Search Console. You can quickly see the number of times your website showed up in search results and what search terms made that happen. Your average CTR combined with your average position for that search term is an easy way to find improvements to your SEO strategy.” says Phil Wiseman of Analytics That Profit.
12. Insights Search Bar
Insights Search Bar is a way to question your Google Analytics any data point in a natural language and get answers.
“Instead of navigating through tabs and submenus, Google Analytics makes it easy to retrieve data based on your query. This means that if your CEO ambushes you with a question like “How much organic traffic did we get in 2019?” you can come up with a quick answer using the Google Analytics Insights search bar,” says Jordan Eller of Forma Life Science Marketing.
Eller adds, “GA vets may scoff at the idea of typing questions like “What was our Bounce Rate in August 2020?” into the Insights search bar, but the truth is that it provides unparalleled access to the user, regardless of how familiar they are with GA.”
13. Site Search Tracking
The site search button allows users to quickly skim through the content they wish to see on your website.
And if you get to know the data on what’s searched here, that’s an insightful data point for your marketing.
“Site search tracking is one of the most underrated Google Analytics features. Enabling site search tracking in Google Analytics allows us to view what users are searching for on our website, and in turn, allows us to optimize our website for what users are looking for”, says Tommy Perkins, Jr. of T.P. Trailers & Truck Equipment, Inc.
How do you enable site search tracking?

14. Entrance Pages under Behavior Section
Whenever a user starts a new session, that page is the entrance page.
“Entrance pages under the behavior section. This data shows which pages on your website were used to enter your site. This is very important to see because these could be pages that are pulling in visitors organically. This will allow you to understand better how your site ranks but also what changes to make. Hence, those important entrance pages convert visitors into customers/clients”, says Maciej Fita of Brandignity.
15. Behavior Flow
Behavior Flow shows how your visitors are behaving on your website.
“Yes, obviously, knowing your acquisition is paramount, but I love being able to see the customer journey and if our website content is helpful.”
For example, after reading an article, does the client leave, or do they click on another article? Which internal links get traffic, and which don’t? All good information and very helpful to see into the mind of the client”, says Roxanne Williams of System One.
Nikola Roza says, “Admittedly, it looks a bit of confusing and complicated, so it’s probably off-putting to most newbie marketers who’d rather not look at it. But it is a must-use feature.
The biggest value for me is checking out to see whether users move from one page to another. If they do, then internal links on that page are doing a good job.
If they don’t, then I go back and add a few relevant internal links, especially at the top of the page where users are more likely to click.”
16. Top Conversion Paths and Conversion Events
“Hands down, conversion events are by far the most underrated Google Analytics feature.
They are underrated because they are perhaps the most difficult feature to configure; it takes a combination of Google Tag Manager and Google event tracking (found under behaviors) for the ultimate conversion goals to appear magically” says, Steve Yanor of Sky Alphabet Social Media.
“If you want to track clicks on a button or visits from a landing page, you can’t do that effectively without configuring a conversion event in Google Tag manager, and only after the event is configured properly (it takes some doing if you are new to it) will it start recording in the ‘Behaviours’ tab in Google Analytics. Only after all of this is done can you configure your conversion goals properly because you now have data that has been manually configured and tested button by button, link click by link click”, says Yanor.
In combination with conversion events, the conversion path also helps in understanding all the different stages it took for someone to convert.
“It’s visual, which makes it really easy to get a grasp on your customer journey to convert. If you see lots of long pathways, perhaps people don’t have enough information to make a decision sooner, or perhaps there isn’t a strong enough call to action. This information can help guide you in a remarketing strategy for both Google and Facebook Ads”, says Daniella Pozzolungo of PupDigital.
Related Article: The 14 Most Important Conversion Metrics to Track Using Google Analytics
17. Custom Goals, Goal Funnel, and Funnel Visualization
“The ability to create custom goals is an unbelievably powerful feature that so many people don’t take full advantage of. With it, you can get a detailed analysis of the pages that convert for you and actually attach a monetary value to your traffic. Attaching ROI to traffic and SEO is difficult, but this is one way to actually do so”, says Jakub Rudnik.
Tony Mastri of MARION Digital Marketing agrees, “Without having to make any on-site changes, this feature lets you identify and measure your most valuable conversion sources while using a single goal type. This is great for measuring the ROI of your different marketing channels and making decisions that help optimize your marketing growth.”
“It’s great for getting an idea of how profitable particular traffic sources are,” says Adam Connell.
How do you set it up?
“If you’re looking to build one of Google Analytics distinctive goal tracker, select URL objective, clarify the goal URL (the ultimate URL that you expect people to reach), search “Use funnel,” and get into URLs of your funnel,” says Dev Raj Singh of The Yuvas.
Travis McGinnis of Leighton Interactive explains the goal tracking process.
“Start with a simple goal, like views of a Thank You Page. Start getting more complex by identifying specific actions that have value to the business, like button clicks, form submissions, phone calls, eCommerce purchases, etc.
Assign a monetary value to these, even if there isn’t a transaction that takes place on the site. This will populate the Goal Value column in GA reports.
Over time, and with multiple goals of varying monetary values (based on business importance), it’ll become clear which pages and/or channels are better at driving goals completion. The ones that work should be promoted more, and the ones that don’t should be optimized to work better.”
18. E-Commerce Tracking
E-Commerce websites are also websites but with additional properties from your e-commerce store.
“The other underrated Google Analytics feature is Ecommerce Tracking,” says Ashok Sharma of Signity Solutions.
“Every eCommerce site owner/digital marketing expert wants to know where the most profitable customers come from. With eCommerce tracking enabled, we can easily know from where users came.”
How do you set up e-commerce tracking:
- Go to your Google Analytics standard reports.
- Click on the “Admin” button in the top right.
- Click on “Profile Settings”
- Go to “Ecommerce Settings” and change the drop-down to “Yes, an Ecommerce Site”
- Click the “Apply” button at the bottom.”
19. Date-Range Comparison
Marketers always look to compare & skim through data in almost every uncanny format, probably that’s how they get their answers! Custom date-range comparison is one such way.
Juli Durante of Impulse Creative says, “I use many tools, and having the ability to get and customize time-based comparisons automatically is the single most valuable thing I can do in GA that I can’t always do in other tools.”
“Let’s say I’m trying to figure out why my organic traffic has grown – I want to know what pages of the site people are landing on from organic, and GA does this flawlessly.”
How is it different from other analytics tools?
“Other tools do, too – but what GA lets me do from there is throw on a data comparison, so that I can see which pages are actually growing (and maybe some that are shrinking). This helps me diagnose potential optimization opportunities: Where can I spend more time improving on-page experience to help convert visitors into leads? Do I have older posts that are getting traffic that actually needs a content refresh? Is a growing pillar page cannibalizing some traffic from other conversion pages?”
“If your analytics tool doesn’t help you ask and answer why, they’re not providing value.”
20. Block Company’s IP Address
I’m sure every marketer visits their business at least once a day or might even keep toiling around different pages. But that essentially shouldn’t be counted as a potential customer, right?
Matt Satell of Little Bundle says, “One of the most common issues with Google Analytics when a company’s employees accidentally skew the data. It’s normal for employees to visit their company’s website; however, it’s important to make sure that those visits are excluded from GA’s reporting.”
Why? “If not excluded, important metrics like sessions, conversion rates, bounce rate, and be thrown out of whack.”
“To exclude internal traffic, simply set up an IP address filter and input your company’s IP address is based in an office and/or the home IP addresses of your most active remote employees. Keep in mind, the filter will only apply to data going forward,” says Satell.
21. UTM Parameters
UTM Parameters, also known as UTM tags or codes, is an entity added to a URL that helps a data analytics software identify a particular online marketing campaign.
There are five types of UTM parameters that can be added to a URL: utm_source, utm_medium, utm_campaign, utm_content, and utm_term. Each of these parameters helps you track the source, medium, campaign, content, and keywords respectively of a campaign.
Divij Mehta of Websites ‘N’ More says, “UTM code is an excellent feature when it comes to providing insights into campaigns and allowing campaign managers to make better decisions, overall.”
“If you have an active email list but don’t use UTM parameters, this may be extremely problematic. Using ‘last non-primary attribution,’ Google Analytics dynamically records users, ensuring a guest who accesses the web with a Google search, accompanied by 5 direct visits, will be tracked as 6 organic visits.
If you do not have UTM criteria set up, Google can see all of your email traffic as direct traffic, which will be attributed to the last non-related visit in turn. This can really skew your traffic-by-channel data if you have a big, active email list” says, Eliza Nimmich of Tutor the People.
So, the next time you have a newsletter collaboration or a special marketing campaign, don’t forget to add your UTM codes.
22. Data Import
“Data Import – this feature is truly incredible is you are now able to analyze your traffic, and ad spend across multiple channels all in Google Sheets,” says Joe Sloan of Simplify Sheets.
Interesting way to use this data from Google Analytics.
Sloan says, “Every month we take our ad spend from Bing, Yelp, and Facebook place it in a Google Sheet document that will correctly format the spend from these different sources. We can then quickly upload the data.
We can see insights like Yelp has a higher cost per click but has a lower cost per conversion than Facebook. It helps your team and other departments see spend from different channels and conversions. Also, it makes it really simple to see ad spend month over month, week over week, or even compare daily spend for that specific day. Lots of insights can be uncovered by centralizing and standardizing your ad spend data.”
23. In-Page Analytics Report
“Curious where the most clicks on your pages are made by individuals?”
Well, there Google Analytics lets you do that.
“In-Page Analytics will pull the website from the Analytics browser under the Content toolbar with information on the percentage of clicks that have occurred on each internal link to the website,” says Derin Oyekan of Reel Paper.
24. Google Analytics API
The ability to use all your marketing software in sync is a bliss. And Google Analytics has an API feature to let you incorporate this data into the rest of your tools.
TJ Kelly of FansRaise says, “Integrate Google Analytics stats into your other marketing tools/reports using GA’s API. We use the API with Screaming Frog’s SEO Spider sitemaps to report Sessions, Users, Bounces, and Session Duration stats on each page of our site.”
Related Article: 20 Must-Have Google Analytics Integrations That Marketers Rely On
Wrap Up
As you can see, it turns out Google Analytics has many important features lurking beneath the surface that are incredibly valuable for making your analysis easy and intuitive. Use some of these features more often.


![How to Leverage Your Website Analytics to Acquire New Customers? [Research Findings Based on 100+ Companies]](https://cdnwebsite.databox.com/wp-content/uploads/2022/10/10044001/google-analytics-4-metrics-and-dimensions-guide-1000x563.png)


