


Table of contents
Studies conducted by McKinsey have been showing the same result for years: businesses that base their decisions on gut feeling are more likely to fail. On the other hand, companies that invest heavily in collecting and analyzing are more likely to outperform their competitors, acquire more customers, and become more profitable.
Instead of speaking about these findings in theory, we’re going to share several real-life examples to make case for business intelligence and show you how to leverage business analytics for growth.
- The Importance of Business Analytics for Business Strategy and Decisions
- How Often Do Companies Analyze Their Business Performance?
- Business Analytics Types
- 5 Business Analytics Examples that Prove the Value of BI
The Importance of Business Analytics for Business Strategy and Decisions
Most businesses worldwide understand the importance of business analytics for strategic decisions. According to a MicroStrategy study, 57% of global enterprises have a CDO, Chief Data Officer, helping teams across the organization get more and better insights from the data available.
The same study found that over 70% of international companies had planned to expand their investment in data and analytics.
Our recent survey showed similar results: most companies rely on data when making business decisions and building strategy. Out of 29 respondents, 51.72% were B2C services or products, 27.59% were B2B services or products, and 20.69% were agencies or consultants (marketing, digital or media).
Only around 3% of respondents claim they don’t take data analytics into account during the decision-making process.
For those who aren’t completely convinced just yet, we’ll break down the main reasons why data and analytics should be a vital part of strategy creation.
- Improved efficiency. Data provides an objective insight into the efficiency of your processes so you can optimize them. It allows you to identify bottlenecks and areas for improvement in how you manage your resources and people and automate specific steps in your processes that don’t require human intervention.
- Real-time insights. Data provides you with important business insights in real-time. This way, crucial decisions don’t need to be delayed, but made instantly and with confidence. There’s no waste of time and any issues can be fixed early on.
- Accurate forecast. Comparing different data sets can help you identify trends and create more accurate forecasts for the future. Based on this forecast, you can act proactively to prevent or mitigate risks or seize opportunities, accurately predicting the results of your activities.
- Increased revenue. When you rely on data analytics to optimize your business operations, marketing campaigns, sales pipeline, and more, you can expect a higher revenue (8% on average) and lower costs (10% on average).
Related: Business Intelligence Reporting: Definition, Benefits and Best Practices
How Often Do Companies Analyze Their Business Performance?
Databox ran a survey to find the answer to the question “how often do companies analyze their business performance.”
Most of our respondents are B2C and B2B product and service providers, with marketing, digital, or media agencies making around 20% of participants. According to our survey results, most companies analyze their business performance at least monthly. A bit over 40% of survey participants said they conduct this analysis once a week.
Business Analytics Types
You can conduct a business analysis by applying the four primary quantitative methods that allow you to interpret your data and gain insights from it: descriptive, diagnostic, prescriptive, and predictive analytics.
Our respondents top-ranked descriptive analytics (interpretation of historical data to identify trends and patterns), followed by diagnostic (identifying the root cause of a problem), prescriptive (determining which outcome will yield the best result in a given scenario) and predictive (forecasting future outcomes), respectively.
Let’s take a closer look at each type.
Descriptive Analytics
When using the descriptive analytics method, you simply summarize historical or present data with the goal to gain insight into the current business situation. This analysis allows you to identify patterns in your data and is useful when you need to report on past performance to managers or stakeholders.
The descriptive analytics method is a good starting point for new businesses that don’t know yet what strategies work and what don’t bring satisfactory results.
“We are in the early stage of company maturity, and most of our activities are focused on understanding which approaches work and which don’t. With descriptive analytics, we can get some quick insights into how close our business performance is next to the KPIs we set. We can also see which areas need more focus to achieve the best results in terms of growth,” explains Marcin Bartoszek of Spacelift.
Diagnostic Analytics
Once you have an overview of what happened in the past with your business performance, or what is going on at the moment, it’s time to dig into why it’s happened. That’s where diagnostic analytics steps in.
Here, you can drill-down into your data sets and look for correlations and causations to determine what factors contributed to specific results. When using diagnostic analytics, you can discover the root cause of an issue that’s been affecting your performance or why a campaign failed.
“Identifying problems and opportunities for optimisation is where we get the most value from our analytics,” says James Kinsley of Incendium AI. “Highlighting sticking points for particular segments of users, and improving our user journeys to maximize conversion has helped us most. There have been numerous times analytics has highlighted very expensive issues that happened with some new website updates, blocking conversions for certain users for example.”
Prescriptive Analytics
Prescriptive analytics include various techniques that businesses use to come up with recommendations for next steps that will improve their performance. Based on prescriptive analytics, a business can create a course of action in which various solutions can be tested to find the optimal one.
This optimal solution is most likely to lead the business toward achieving its goals, but needs to include regular feedback and repeated analyses to ensure the desired outcome.
“I chose Prescriptive first and foremost because it’s always best to know, when looking at analytics, which outcome would most likely help your business the best,” says Blake Brossman of PetCareRX. “This is followed by Descriptive because, to know which outcome would give you the best business, you have to look at the data that would figure that out.”
Predictive Analytics
Businesses use predictive analytics to forecast future events, figures, and outcomes. The forecast is based on the data you get during descriptive analysis and operates with probabilities rather than certainties.
Predictive analytics relies on machine learning and artificial intelligence and is commonly used in sentiment analysis: by analyzing opinions collected from social media, we can forecast how people will react to future products or services a business may launch. For many, predictive analytics are the most valuable type of business analytics.
Tom McSherry of Smuggs shares: “Predictive analytics help us identify future trends and patterns, so that we can make better decisions about where to allocate our resources. This information helps us improve our bottom line and grow our business.” explains McSherry and adds that the combination of different analytics methods usually generates the best (and most accurate) results:
“Descriptive analytics give us a clear picture of what has happened in the past, while prescriptive analytics help us determine the best course of action to take in the future. By combining all three types of business analytics, we are able to make more informed decisions that drive our business forward,” concludes McSherry.
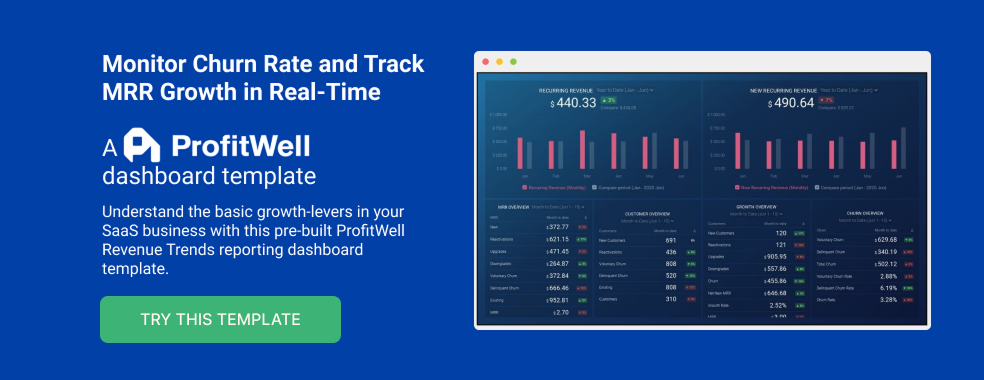
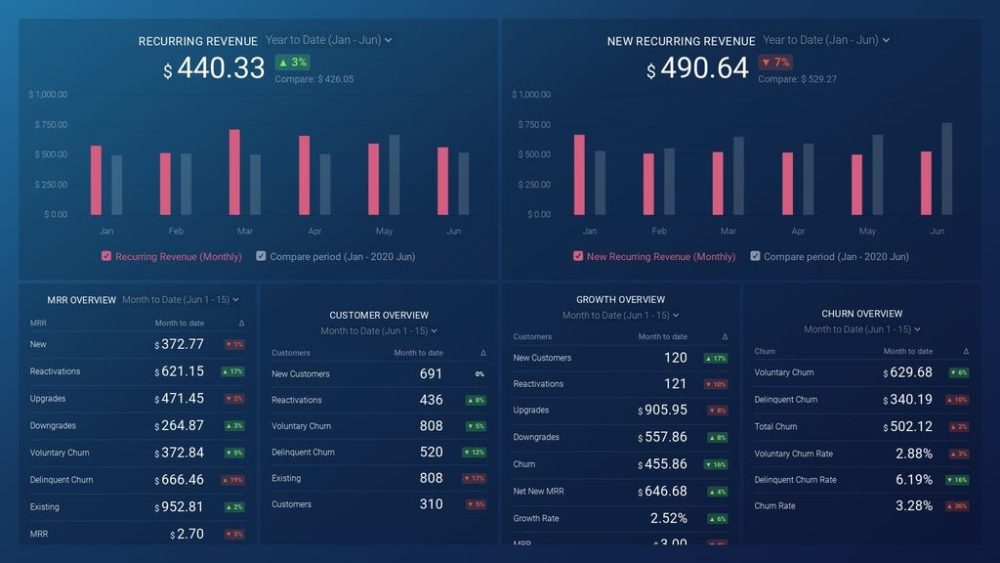
PRO TIP: Are You Tracking the Right Metrics for Your SaaS Company?
As a SaaS business leader, there’s no shortage of metrics you could be monitoring, but the real question is, which metrics should you be paying most attention to? To monitor the health of your SaaS business, you want to identify any obstacles to growth and determine which elements of your growth strategy require improvements. To do that, you can track the following key metrics in a convenient dashboard with data from Profitwell:
- Recurring Revenue. See the portion of your company’s revenue that is expected to grow month-over-month.
- MRR overview. View the different contributions to and losses from MRR from different kinds of customer engagements.
- Customer overview. View the total number of clients your company has at any given point in time and the gains and losses from different customer transactions.
- Growth Overview. Summarize all of the different kinds of customer transactions and their impact on revenue growth.
- Churn overview. Measure the number and percentage of customers or subscribers you lost during a given time period.
If you want to track these in ProfitWell, you can do it easily by building a plug-and-play dashboard that takes your customer data from ProfitWell and automatically visualizes the right metrics to allow you to monitor your SaaS revenue performance at a glance.
You can easily set it up in just a few clicks – no coding required.
To set up the dashboard, follow these 3 simple steps:
Step 1: Get the template
Step 2: Connect your Profitwell account with Databox.
Step 3: Watch your dashboard populate in seconds.
5 Business Analytics Examples that Prove the Value of BI
We’re sharing five examples of how different companies used business analytics to make progress toward their goals in different aspects of business:
- Deliver Outstanding Results to Clients
- Optimize Budget Spending
- Save Time for More Meaningful Tasks
- Achieve More Goals
- Improve Customer Retention
Deliver Outstanding Results to Clients
Business analytics can help you deliver outstanding results to your clients by creating in-depth reports with engaging data visualizations and actionable insights that the client can apply right away. This is particularly important for marketers (especially ones who run long-term games of content marketing and SEO), who often need more time to prove the value of their work.
Nextiny is a business growth and video agency that faced several challenges in client reporting: the agency was getting requests for tailored reports and had to track data in multiple tools, which caused many important insights to remain uncovered.
Using Databox features like Databoards, integrations with numerous data sources, and Data Calculations to track, view, and analyze the most relevant metrics, Nextiny managed to take client reporting to the next level. The agency is able to dive deep into customer data and provide more valuable and actionable insights to their clients.
As a result, Nextiny has 27 more clients than before doubling down on analytics.
Optimize Budget Spending
Matthew Ramirez of Paraphrase Tool optimized his team’s spending by analyzing the data available in Google Analytics. “We were able to use data from our Google Analytics reports, which were incorporated into our business intelligence dashboards, to measure the effectiveness of our ads and determine that we were spending more on ads than we were making in revenue. We then pivoted to a subscription model (from advertising-based) and have seen a four-time increase in profit in just six months.”
Relying on business intelligence helps you make more informed decisions about your next steps, and make them quickly. Access to real-time data analysis allows you to act on issues early on before too much budget is wasted.
Deeplite is a Canadian AI software optimization startup. To be able to dwell deep into data and gain actionable insights from it, the team needed to access the numbers in real time, understand it, and create meaningful presentations for stakeholders in a digestible way. At the same time, as a startup, Deeplite needed to be able to act fast on the available data to optimize their limited budget. Especially if a campaign was underperforming.
Using dashboards and reports in Databox, Deeplite is able to monitor both high-level data and specific channels and build any dashboard in a few hours. Moreover, the whole team can access the dashboards any time and see real-time data without manual updating of spreadsheets, which helps team members to be aligned, make decisions fast, and prevent issues to make the most out of their budget.
Related: How to Set a Marketing Budget for a Small Business: 20 Tips
Save Time for More Meaningful Tasks
Business analytics saves your time because it eliminates guesswork and testing based on gut feeling. With data analysis, it becomes easier to determine what works and what doesn’t. If you give your team access to data, they can complete reporting-related tasks faster and have more time to focus on execution.
This is particularly important for fast-growing businesses that need to streamline their processes quickly to avoid mistakes. Harmon Brothers wanted to track the data from their internal and external campaigns, especially social ads, and use it to prove the value of their efforts to their clients. Using Databox allowed the team to dig deep into the data to understand exactly what’s happening. They were also able to set up goal-tracking, so they could compare tracked metrics to the goals they had set. By relying on the right data and analytics tools, Harmon Brothers cut reporting time per client per month by five hours.
As a result, the agency enjoyed an improved internal ROAS: from $1.5 to $2.6.
Related: How to Automate Your Reporting Process with Databox
Achieve More Goals
“Business analytics is a powerful tool that can be used to improve many different aspects of a business. When used correctly, it can help businesses reach their goals and create lasting success,” says George Harrison of Pkgmaker.
Collecting and analyzing data allows you to measure your progress more accurately and react promptly in case you notice your performance hasn’t been up to par. By fixing issues (and seizing opportunities) on the go, you’re more likely to achieve your business goals.
GMS, a business communication solution company working with over 900 mobile operators globally, sits on a lot of data generated every day, but without proper analysis, the team wasn’t able to identify trends and achieve goals. One of the problems was that only 60% of the company could understand, and therefore pull insights from the available data.
By working with Databox analytics and dashboard tools, GMS managed to make data accessible for 100% of their team members and improve achievement of their performance goals by 30%. Thanks to the intuitive interface, even non-data-scientists could interpret the data and create better data practices that ultimately led to better business outcomes.
PRO TIP: Learn how Kristina Simonson is leading her team in restructuring the way they approach KPI and goal setting at Privy.
Improve Customer Retention
Accurate and effective reporting is impossible without access to data. Businesses need to be able to look back on their past performance to identify errors and eliminate them in the future. Each mistake you eliminate and each gap you fill in your processes is one step toward higher customer engagement and retention.
This was the case of Elenas, an app designed for social media selling, was facing complex data with no way to dig into it efficiently. The 30-person team needed to track internal and external metrics and present their performance to the stakeholders and investors, ensuring a smooth customer experience from the first touchpoint to the last.
Using Databoards allowed Elenas’ team members to track all relevant metrics in terms of sales growth and customer satisfaction. Insight into data allows them to react quickly in case of an issue and reduce the number of escalations and customer complaints.
As a result, the team grew their customer retention rate from 22% to 57% and reduced the number of cancellations from 57% to 10%.
Related: 26 Effective Ways for Improving Your Customer Retention Rate
Leverage Your Data for Success with Databox
As you have seen, data lets you complete tasks faster, more accurately, and act in real-time to prevent issues and budget waste. But even if you have access to all the data you need, you still have to choose the right ally to help you collect and interpret the data in the most efficient way possible.
Over 20,000 businesses worldwide trust Databox to be their business analytics partner in growth. Easy to set up, use, and customize, our tool offers 130+ integrations that allow you to connect and automatically pull data from any data source. You can build and customize dashboards with no coding skills required, view automatically updated data in real-time, and share it with your team without spending hours on building complex reports.
Save 3+ hours on reporting every month, build beautiful dashboards with easy-to-understand metrics, and receive alerts and recommendations when your campaigns are underperforming to quickly get back on track.
Start a fee trial today and monitor your business performance in one place.


